The Analysis of Regional Economic Structure in Regional
Development of Gunungsitoli City
1Selamat Berkat Perlindungan Zebua, 2Tarmizi, 3Rujiman
1Department of Regional and Rural Development Planning,
University of Sumatera Utara, North Sumatra, Indonesia
3Department of Economy Development, Faculty of Economy and Business
University of Sumatera Utara, North Sumatra, Indonesia
3Department of Economy Development, Faculty of Economy and Business
University of Sumatera Utara, North Sumatra, Indonesia
ABSTRACT
This research aimed to analyze the economic structure of Gunungsitoli City as an information and consideration in economic development planning. This research uses secondary data in the form of time series of the Gross Domestic Product (GDP) of Gunungsitoli City and Sumatera Utara Province in 2013-2017. The GDP value of Gunungsitoli City increased to 431.709,96 million rupiahs. This shift was influenced by the provincial share component of 538.471,80 million rupiahs, proportional shift component of 69.689,71 million rupiahs, and differential shift of 37.072,13 million rupiahs. Based on the calculation of the combined Klassen Typology, Loqation Quotient, Growth Ratio Model and Overlay analysis showed that the leading sector of Gunungsitoly City were watter supply sewerage waste management remediation activities sector, construction sector, wholesale and retail trade; repair of motor vehicles and motorcycles sector, and transportation and storage sector.
Keywords: Regional economic structure, sector contribution, sector growth, leading sector, and regional development.
Introduction
Gunungsitoli City is one of the autonomous regions in the Nias Islands. The Nias Islands region has great potential and natural wealth, but the condition of the Nias region has been left behind so far and development is very minimum. The first division in the Nias region was carried out in 2003, South Nias Regency, which was the division of Nias Regency. Then in 2008, Nias Regency was divided into three regencies and one city, Nias Regency, North Nias Regency, West Nias Regency, and Gunungsitoli City. However, the Nias Islands are still far behind compared to other regions in North Sumatra, both in terms of infrastructure, education, human resources (HR) and other development sectors.
increased to 5.18 percent, and in 2017 back down to 5.12 percent.
Source: Central Bureau of Statistics of Gunungsitoli City
Figure 1 Trend of Economic Growth Rate at 2010 Constant Prices Based on Gunungsitoli City and North Sumatra
Province 2013 - 2017 (%)
One indicator used to measure the economic condition of a region is Gross Domestic Product (GDP) for the national
level and Gross Regional Domestic Product (GRDP) for the provincial level and regency / city. Based on the role of each sector in the formation of a regional GDP, it can be seen the direction of the economic structure of the region.
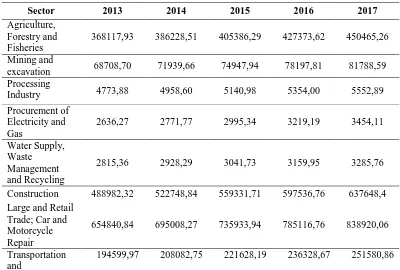
Table 1 GRDP of Gunungsitoli City at Constant Prices According to the Business Field in 2013-2017 (Million Rupiah)
Sector 2013 2014 2015 2016 2017
Agriculture, Forestry and Fisheries
368117,93 386228,51 405386,29 427373,62 450465,26
Mining and
excavation 68708,70 71939,66 74947,94 78197,81 81788,59
Processing
Industry 4773,88 4958,60 5140,98 5354,00 5552,89
Procurement of Electricity and Gas
2636,27 2771,77 2995,34 3219,19 3454,11
Water Supply, Waste Management and Recycling
2815,36 2928,29 3041,73 3159,95 3285,76
Construction 488982,32 522748,84 559331,71 597536,76 637648,4
Large and Retail Trade; Car and Motorcycle Repair
654840,84 695008,27 735933,94 785116,76 838920,06
Transportation and
Warehousing
Provision of Accommodation , Food and Beverage
85884,58 91387,13 96370,82 101809,52 107695,79
Information and Communication
54247,06 57283,90 59789,32 63048,92 66586,23
Services, Finance and Insurance
79410,96 83689,36 87838,68 92499,70 96036,84
Real Estate 119650,03 126602,06 131905,03 138394,01 145162,22
Company Services
7010,43 7377,13 7741,27 8135,15 8559,08
Government Administration, Defense and Mandatory Social Security
119690,57 127541,46 136040,29 141703,18 147601,8
Education Services
140359,80 148580,10 156433,82 164836,05 173739,57
Health Services and Social Activities
17530,50 18393,11 19153,04 20063,31 21046,84
Other services 8459,68 8846,88 9185,32 9581,74 10000,26
GRDP 2417718,86 2564367,81 2712863,72 2876339,54 3049124,56
Source: Central Bureau of Statistics of Gunungsitoli City
Statement of the problem
1. What are the changes and shifts in the economic structure of the Gunungsitoli City?
2. What are the leading sectors in the economy of the Gunungsitoli City?
Literature Review
Development is a multi-dimensional process involving reorganization and reorientation of all existing social and economic systems (Michael P. Todaro, 1995). To measure economic growth, the value of GDP used is GDP based on constant prices. Because, by using constant prices, the effect of price changes has been removed, so that even if the numbers that appear are the money value of the total output of goods and services, the change in GDP values shows the change in the quantity of goods and services produced during the observation period (Prathama Rahardja, 2008) .
Lincolin Arsyad (2013) defines regional economic development as a process where local governments and their communities manage existing resources and make partnerships between local governments and the private sector to create new jobs and stimulate the development of economic activities in the region. In ideal conditions, regional development planning should begin after the regional spatial plan has been arranged, because regional spatial planning is the foundation but also at the same time the target of regional development planning (Tarigan, 2005).
around (hinterland) because this method will create optimization of benefits for the potential (economy) of regions and regions and will create strong competitiveness (economy) for the region (Miraza, 2010).
Changes in the structure (structural transformation) of the economy of a region are changes from the traditional economic system to the modern economic system. This means that there is also a change in the economic structure of the agricultural sector to the industrial sector and then from the industrial sector to the services sector (Sirojuzilam and Mahalli, 2010). In the development process efforts are made that aim to change the structure of the economy for the better (Kuncoro, 2004).
This economic base theory was put forward by Richardson (1973) which states that the main determinant of economic growth in a region is directly related to demand for goods and services from outside the region (Arsyad, 2013).
Chenery and Syrquin (1975) states that development can be seen as a multidimensional transition process that reflects the relationship between various processes of change within a country.
Material and Method
This research was conducted in Gunungsitoli City. This research is about the structure of the regional economy obtained from the Gross Regional Domestic Product (GRDP) of Gunungsitoli City in 2013-2017. The research method is carried out through library materials in the form of books, scientific writings, journals, articles, and research reports that have to do with research (Library Research). The data collection technique is carried out by
direct recording of time series data from 2013-2017 from books and publications issued by the Central Bureau of Statistics, as well as journals and literature relating to this research.
To answer the problem, several methods of data analysis are used, as follows:
1. Classification Typology Analysis is used to obtain the economic sector growth classification of Gunungsitoli City.
2. Loqation Quotient (LQ) analysis is used to determine the base and non-base sectors in the regional economy of Gunungsitoli City. 3. Shift Share Analysis is used to
analyze and determine the shift and role of the economy in Gunungsitoli City.
4. Analysis of the Growth Ratio Model (MRP) as an analytical tool in determining the leading sectors in Gunungsitoli City which emphasizes both external and internal growth criteria.
5. Typology Overlay analysis as an analytical tool in determining the leading sectors in Gunungsitoli City.
The definitions and limitations of operational variables are as follows:
1. Gross Regional Domestic Product (GRDP) is the gross added value of all economic sectors in rupiah units in Gunungsitoli City in 2013-2017. 2. Economic growth is the percentage
change in the GRDP of Gunungsitoli City on the basis of constant prices in units of percent in 2013-2017.
belas) sektor utama menurut Badan Pusat Statistik (BPS).
4. The base sector is the economic sector of the City of Gunungsitoli in 2013-2017 which is able to export its products to other regions. 5. The shift in the economic sector is a change in contributions between the determinants of the Gunungsitoli City GRDP in
2013-2017 which are classified into 17 (seventeen) main sectors.
6. The competitive sector is the economic sector that determines the Gunungsitoli City GRDP in 2013-2017 which is the base sector and has growth above the reference area average.
Result
Table 2 Provincial Growth Rate and Contribution of GRDP North Sumatra and the City of Gunungsitoli in 2013-2017
No Sector North Sumatera Gunungsitoli
s sk si sik
1 Agriculture, Forestry and Fisheries 4,92 24,92 5,29 14,97
2 Mining and excavation 9,54 1,32 4,50 2,76
3 Processing Industry 3,82 19,64 3,94 0,19
4 Procurement of Electricity and Gas 4,23 0,14 6,65 0,11
5 Water Supply, Waste Management and Recycling
6,11 0,10 4,29 0,11
6 Construction 6,47 12,31 6,89 20,58
7 Large and Retail Trade; Car and Motorcycle Repair
5,50 17,44 6,22 27,22
8 Transportation and Warehousing 6,42 4,60 6,49 8,16
9 Provision of Accommodation, Food and Beverage
7,02 2,24 6,15 3,55
10 Information and Communication 7,69 2,52 5,56 2,21
11 Services, Finance and Insurance 4,79 3,12 5,40 3,23
12 Real Estate 6,55 4,12 5,17 4,86
13 Company Services 6,54 0,87 5,46 0,29
14 Government Administration, Defense and Mandatory Social Security
4,32 3,26 5,20 4,94
15 Education Services 5,91 2,01 6,29 5,76
16 Health Services and Social Activities 7,95 0,92 4,76 0,71
17 Other services 7,05 24,92 4,35 0,34
Source: Data processed by the author
Where:
si = Average growth rate in the Gunungsitoli City sector
s = Average growth rate in the regional sector of North Sumatra Province sik = The average contribution of the sector of Gunungsitoli City
sk = The average contribution of the regional sector of North Sumatra Province
Table 2 above shows that sectors that have the largest average contribution to the GRDP of Gunungsitoli City are the large and retail trade sectors, then the
agriculture, forestry and fisheries, then other service sectors, and the
manufacturing sector.
Table 3 Classification of the GRDP Sector in Gunungsitoli City According to the Klassen Typology of 2013-2017
Quadrant I Developed Sector si > s dan sik > sk
Construction sector
Large and Retail Trade; Car and Motorcycle Repair sector
Transportation and Warehousing sector
Services, Finance and Insurance
Government Administration, Defense and Mandatory Social Security
Education Service
Quadrant II Stagnan Sector si < s dan sik > sk
Mining and excavation sector
Water Supply, Waste Management and Recycling sector
Provision of Accommodation, Food and Beverage sector
Real Estate sector
Quadrant III Developing Sector si > s dan sik < sk
Agriculture, Forestry and Fisheries sector
Processing Industry
Sektor pengadaan listrik dan gas
Quadrant IV
Underdeveloped Sector si < s dan sik < sk
Sektor informasi dan komunikasi
Sektor jasa perusahaan
Sektor jasa kesehatan dan kegiatan sosial
Sektor jasa lainnya Source: Data processed by the author
Where:
si = Average growth rate in the Gunungsitoli City sector
s = Average growth rate in the regional sector of North Sumatra Province sik = The average contribution of the sector of Gunungsitoli City
sk = The average contribution of the regional sector of North Sumatra Province
From the results of the Klassen Typology analysis of the GRDP of Gunungsitoli City in 2013-2017, it shows that there are six sectors that occupy the fast and growing sectors (quadrant I) of the construction sector, the large and retail trade sectors;
car and motorcycle repair, transportation and warehousing sector, financial and insurance services sector, government administration sector, mandatory social security and defense, and education services sector.
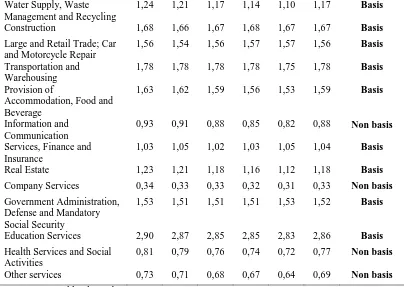
Table 4 Results of Calculation of Location Quotient (LQ) Gunungsitoli City 2013-2017
Sector Year Mean Description
2013 2014 2015 2016 2017 Agriculture, Forestry and
Fisheries
0,61 0,61 0,60 0,60 0,59 0,60 Non basis
Mining and excavation 2,17 2,15 2,09 2,05 2,03 2,10 Basis
Processing Industry 0,01 0,01 0,01 0,01 0,01 0,01 Non basis
Procurement of Electricity and Gas
Water Supply, Waste Management and Recycling
1,24 1,21 1,17 1,14 1,10 1,17 Basis
Construction 1,68 1,66 1,67 1,68 1,67 1,67 Basis
Large and Retail Trade; Car and Motorcycle Repair
1,56 1,54 1,56 1,57 1,57 1,56 Basis
Transportation and Warehousing
1,78 1,78 1,78 1,78 1,75 1,78 Basis
Provision of
Accommodation, Food and Beverage
1,63 1,62 1,59 1,56 1,53 1,59 Basis
Information and Communication
0,93 0,91 0,88 0,85 0,82 0,88 Non basis
Services, Finance and Insurance
1,03 1,05 1,02 1,03 1,05 1,04 Basis
Real Estate 1,23 1,21 1,18 1,16 1,12 1,18 Basis
Company Services 0,34 0,33 0,33 0,32 0,31 0,33 Non basis
Government Administration, Defense and Mandatory Social Security
1,53 1,51 1,51 1,51 1,53 1,52 Basis
Education Services 2,90 2,87 2,85 2,85 2,83 2,86 Basis
Health Services and Social Activities
0,81 0,79 0,76 0,74 0,72 0,77 Non basis
Other services 0,73 0,71 0,68 0,67 0,64 0,69 Non basis
Source: Data processed by the author
The city of Gunungsitoli calculates Location Question (LQ) on average resulting in ten basic sectors, mining and excavation sector, water supply sector, waste management, waste and recycling, construction sector, large and retail trade sector; car and motorcycle repairs, transportation and warehousing sectors, provision of accommodation, food and beverage, the service sector, finance and insurance, the real estate sector, the government administration, defense and social sectors, and the education services
sector. The education service sector has the highest base value, which are 2.86. While the services, finance, and basic insurance sectors are 1.04 as the lowest value. The seven other sectors have a value of <1 so that it is a non-base sector including agriculture, forestry and fisheries, manufacturing industry, electricity and gas procurement sector, information and communication sector, corporate services sector, health services sector and social activities, and other services sector.
Table 5 Results of Calculation of Shift-share Value Gunungsitoli City 2013-2017
Sector Provincial Proportional Differential Total
Share (PS) Shift (P) Shift (D)
Agriculture, Forestry and Fisheries
81986,84 -3106,28 3466,77 81626,35
Mining and excavation 15302,73 -579,78 -3069,52 18952,03
Processing Industry 1063,23 58,83 61,07 943,33
Procurement of Electricity and Gas
587,15 -190,68 95,09 682,74
Management and Recycling
Construction 108905,63 24483,22 16309,53 68112,87
Large and Retail Trade; Car and Motorcycle Repair
145845,46 31405,27 28345,88 86094,32
Transportation and Warehousing 43341,10 2938,40 4370,67 36032,04
Provision of Accommodation, Food and Beverage
19128,12 4090,83 -4147,16 19184,45
Information and Communication 12081,85 4314,17 -6309,47 14077,14
Services, Finance and Insurance 17686,33 9612,96 4677,43 3395,93
Real Estate 26648,33 -8645,37 -8471,22 43764,92
Company Services 1561,36 429,77 -461,69 1593,27
Government Administration, Defense and Mandatory Social Security
26657,36 7665,58 4578,06 14413,72
Education Services 31260,79 -3898,24 1123,71 34035,31
Health Services and Social Activities
3904,37 124,31 -2132,70 5912,77
Other services 1884,13 841,92 -1066,74 2108,95
Total 538471,80 69689,71 37072,13 431709,96
Source: Data processed by the author
Based on Table 5, it can be seen that the value of the sectoral GRDP of Gunungsitoli City has shifted and changed. The GRDP value of Gunungsitoli City grew by IDR 431,709.96 million. This shift is influenced by the national share component of IDR 538,471.80 million, the proportional shift component of IDR
69,689.71 million and the differential shift component of IDR 37,072.13 million. Sectoral contributions are often associated with changes in the concentration of regional economic activities. The economy is believed to move from the agricultural sector to the industrial sector and then the service sector.
Table 6 Contributions of the Gunungsitoli City GRDP Sector 2013-2017 (%)
No Sector Year
2013 2014 2015 2016 2017 Primary
1 Agriculture, Forestry and Fisheries 15,23 15,06 14,94 14,86 14,77
2 Mining and excavation 2,84 2,81 2,76 2,72 2,68
Total 18,07 17,87 17,7 17,58 17,45
Secondary
3 Processing Industry 0,20 0,19 0,19 0,19 0,18
4 Procurement of Electricity and Gas 0,11 0,11 0,11 0,11 0,11
5 Water Supply, Waste and Recycling Management
0,12 0,11 0,11 0,11 0,11
6 Construction 20,22 20,39 20,62 20,77 20,91
7 Large and Retail Trade; Car and Motorcycle Repair
27,09 27,10 27,13 27,30 27,51
Total 55,79 56,01 56,33 56,7 57,07
Tertiary
9 Provision of Accommodation, Food and Beverage
3,55 3,56 3,55 3,54 3,53
10 Information and Communication 2,24 2,23 2,20 2,19 2,18
11 Services, Finance and Insurance 3,28 3,26 3,24 3,22 3,15
12 Real Estate 4,95 4,94 4,86 4,81 4,76
13 Company Services 0,29 0,29 0,29 0,28 0,28
14 Government Administration, Defense and Mandatory Social Security
4,95 4,97 5,01 4,93 4,84
15 Education Services 5,81 5,79 5,77 5,73 5,70
16 Health Services and Social Activities
0,73 0,72 0,71 0,70 0,69
17 Other services 0,35 0,34 0,34 0,33 0,33
Total 26,15 26,1 25,97 25,73 25,46 Source: Data processed by the author
Table 6 shows that the primary sector experienced a decline in contribution from 18.07 percent in 2013 to 17.45 percent in 2017. The secondary sector experienced an increase in
contribution from 55.79 percent in 2013 to 57.07 percent in 2017. The tertiary sector decreased its contribution from 26.15 percent in 2013 to 25.46 percent in 2017.
Table 7 Planning for the Economic Sector of Gunungsitoli City in 2017
Sub-district Sector Pattern
Industry (I) Service (S) Agriculture (A)
2013 55,79 26,15 18,07 I-S-A
2014 56,01 26,1 17,87 I-S-A
2015 56,33 25,97 17,7 I-S-A
2016 56,7 25,73 17,58 I-S-A
2017 57,07 25,46 17,45 I-S-A
Mean 56,38 25,89 17,73 I-S-A
To see the pattern of shifting economic structure in Gunungsitoli City in 2013-2017, the sectors are grouped into three parts, Agriculture (P), Industry (I) and Services (J) which can be seen in table 7. The table shows that Gunungsitoli City has not changed economy in the last five years such as Industry (I) - Services (J) - Agriculture (P). The sector of large and
retail trade, car and motorcycle repair is the dominant sector in the GRDP structure of Gunungsitoli City which is followed by construction and agriculture, forestry and fisheries sectors. Based on the contribution of sectoral GDP, the city of Gunungsitoli has moved from the agricultural sector to the industrial sector.
Table 8 Results of Calculation of the Gunungsitoli City Material Resource Planning (MRP) for 2013-2017
No Sector RPr RPs
Real Nominal Rill Nominal
1 Agriculture, Forestry and Fisheries 0,96 - 0,86 -
2 Mining and excavation 1,06 + 0,73 -
3 Prcessing Industry 0,68 - 0,62 -
4 Procurement of Electricity and Gas 1,23 + 1,19 +
5 Water Supply, Waste and Recycling Management
1,22 + 0,64 +
6 Construction 1,22 + 1,16 +
7 Large and Retail Trade; Car and Motorcycle Repair
1,07 + 1,08 +
8 Transportation and Warehousing 1,21 + 1,12 +
9 Provision of Accommodation, Food and Beverage
1,36 + 0,97 -
10 Information and Communication 0,96 - 0,87 -
11 Services, Finance and Insurance 0,68 - 0,80 -
12 Real Estate 1,28 + 0,82 -
13 Company Services 1,29 + 0,85 -
14 Government Administration, Defense and Mandatory Social Security
0,88 - 0,89 -
15 Education Services 1,03 + 0,91 -
16 Health Services and Social Activities 1,45 + 0,77 -
Source: Data processed by the author
The results of the calculation of the Gunungsitoli City MRP for the period 2013-2017 show the electricity and gas procurement sector, the water, waste and recycling procurement sector, the construction sector, the large and retail
trade sectors; car and motorcycle repairs, and the transportation and warehousing sector has RPr (+) and RPs (+) values which means the sector has prominent growth in Gunungsitoli City and in North Sumatra Province. The mining and
Industri, 2013, 55.79
Industri, 2014, 56.01
Industri, 2015, 56.33
Industri, 2016, 56.7
Industri, 2017, 57.07
Jasa, 2013, 26.15 Jasa, 2014, 26.1 Jasa, 2015, 25.97 Jasa, 2016, 25.73 Jasa, 2017, 25.46Pertanian, 2013, 18.07
Pertanian, 2014, 17.87
Pertanian, 2015, 17.7
Pertanian, 2016, 17.58
Pertanian, 2017, 17.45 Industri
Jasa
excavation sector, accommodation, food and beverage sector, the real estate sector, the corporate services sector, the education service sector, the social services sector and other service sectors have RPr (+) and RPs (-) values, meaning in Sumatra Province North growth is more prominent than in Gunungsitoli City. While the agriculture, forestry and fisheries sector,
the manufacturing industry sector, the information and communication sector, the financial and insurance services sector, and the government administration, defense and social security sectors must have RPr (-) and RPs (-) values, meaning sector-growth the sector is not prominent in Gunungsitoli City and at the North Sumatra Province.
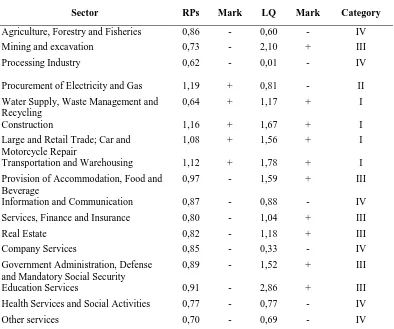
Table 9 Results of Sector Overlay Analysis Economy of the City of Gunungsitoli in 2013-2017
Sector RPs Mark LQ Mark Category
Agriculture, Forestry and Fisheries 0,86 - 0,60 - IV
Mining and excavation 0,73 - 2,10 + III
Processing Industry 0,62 - 0,01 - IV
Procurement of Electricity and Gas 1,19 + 0,81 - II
Water Supply, Waste Management and Recycling
0,64 + 1,17 + I
Construction 1,16 + 1,67 + I
Large and Retail Trade; Car and Motorcycle Repair
1,08 + 1,56 + I
Transportation and Warehousing 1,12 + 1,78 + I
Provision of Accommodation, Food and Beverage
0,97 - 1,59 + III
Information and Communication 0,87 - 0,88 - IV
Services, Finance and Insurance 0,80 - 1,04 + III
Real Estate 0,82 - 1,18 + III
Company Services 0,85 - 0,33 - IV
Government Administration, Defense and Mandatory Social Security
0,89 - 1,52 + III
Education Services 0,91 - 2,86 + III
Health Services and Social Activities 0,77 - 0,77 - IV
Other services 0,70 - 0,69 - IV
Source: Data processed by the author
Where:
Category I = Leading sector Category II = Potential sector Category III = Declining sector Category IV = Lagging sector
From the results of the overlay analysis of Gunungsitoli City during the period 2013-2017, the sectors of water supply, waste management, waste and recycling, the construction sector, the large and retail
and LQ (-) which are potential sectors that are developing and need attention, especially their contribution to the formation of GRDP in Gunungsitoli City. While the mining and excavation sector, the provision accomodation and of food and beverage sector, the service, financial and insurance sectors, the real estate sector, the government administration, defense and social security sectors, and the
education suit sector have RPs (-) and LQ (+) values thus including potential sectors which tend to decline. While the agriculture, forestry and fisheries sector, manufacturing industry sector, information and communication sector, company services sector, health services and social activities sector, and other service sectors are lagging sectors.
Discussion
Recapitulation of the Results of Development Per Sector Analysis in Gunungsitoli City
Table 10 Recapitulation of Results of Per Sector Analysis and Development Priorities Economic Sector in Gunungsitoli City 2013-2017
No Sector Category Priority
1 Agriculture, Forestry and Fisheries Lagging P-3
2 Mining and excavation Potential P-2
3 Processing Industry Lagging P-3
4 Procurement of Electricity and Gas Potential P-2
5 Water Supply, Waste Management and Recycling Leading P-1
6 Construction Leading p-1
7 Large and Retail Trade; Car and Motorcycle Repair Leading P-1
8 Transportation and Warehousing Leading P-1
9 Provision of Accommodation, Food and Beverage Leading P-2
10 Information and Communication Lagging P-3
11 Services, Finance and Insurance Potential P-2
12 Real Estate Potential P-2
13 Company Services Lagging P-3
14 Government Administration, Defense and Mandatory Social Security
Potential P-2
15 Education Services Potential P-2
16 Health Services and Social Activities Lagging P-3
17 Other services Lagging P-3
Based on the recapitulation of the results of the analysis above, it can be concluded that in Gunungsitoli City there are 4 (four) leading sectors, 7 (seven) potential sectors, and 6 (six) lagging sectors. It should be noted that the selection of priority sectors of the economy is the most important thing in development and depends on regional policies. Therefore from the results of data
analysis and discussion per economic sector in Gunungsitoli City can be recommended as follows:
leading sectors and encourage the growth of other sectors (potential sectors and lagging sectors) generated by leading sectors in achieving community welfare. Because the leading sector is the driving force for other sectors, it needs special attention and focus from the local government in the form of maximum budget allocation to leading sector programs so that the allocation of regional expenditure budgets can be more targeted, effective and efficient.
In essence all sectors in the regional economy have important values for society but not all economic sectors have the ability to advance and develop both for the sector itself and for the development of other sectors. Based on table 10 above, it shows that sectors that can be prioritized in the Short Term Development Plan (1-5) in Gunungsitoli City are the water supply, waste, waste and recycling management, construction sector, large and retail trade sectors; car and motorcycle repairs, and the transportation and warehousing sector because these four sectors are leading sectors. This means that regional budget allocations for the four sectors must be prioritized and given a broad space to develop other sectors. Furthermore, the priorities of the Medium Term Development Plan (1-10) are developed together with potential sectors, including the electricity and gas procurement sector, the mining and excavation sector, the provision of accommodation, food and beverage sector, the service sector, finance and insurance, the real estate sector, the administration sector compulsory government, defense and social security, and the education service sector. This means that the budget allocation for this sector is the second priority because of its nature as a second sector. And lagging sectors (1-20) years, including agriculture, forestry and fisheries, manufacturing
industry, information and communication sector, corporate services sector, health services and social activities sector, and other service sectors are prioritized for the Long Term Development Plan. This means that the budget allocation for the lagging sector is adjusted to the conditions of regional financial capacity because it is the third priority.
Conclusions
From the description of the results of the analysis and discussion, some conclusions can be drawn as follows:
1. Based on the average classification of the Klassen Typology sector, six developed sectors, the construction sector, the retail and wholesale trade sectors were produced; car and motorcycle repair, transportation and warehousing sector, financial and insurance services sector, government administration sector, mandatory social security and defense, and education services sector.
2. Based on a combination of Klassen Typology calculations, Location Quotient, Growth Ratio Model and Overlay analysis, the leading sectors in Gunungsitoli City are the water supply, waste and recycling management, construction sector, large and retail trade sectors; car and motorcycle repair, and the transportation and warehousing sector.
Suggestions
Based on the results of the conclusions above, the author provides input as a suggestion to the relevant parties, especially policy makers in Gunungsitoli City, namely:
overriding the development of other sectors as supporters. The priority of leading sector development is expected to provide a multiplier effect on economic growth so that it can stimulate the economic development of Gunungsitoli City which in turn will add to the development / progress of other sectors that are supporting it.
2. Because in this study only using aspects of the economic sectors, it is necessary to have a comprehensive follow-up study to see further where the locations (sub-districts) are leading sectors and potential sectors in Gunungsitoli City.
REFERENCE
[1] Todaro, Michael P, 1995. Ekonomi
Untuk Negara Berkembang, Bumi
Aksara, Jakarta.
[2] Pratama Rahardja dan Mandala Manurung, Teori Ekonomi Makro: Suatu Pengantar, Lembaga Penerbit FE UI, 2008.
[3] Arsyad, Lincolin, 2013. Ekonomi
Pembangunan, Bagian Penerbitan STIE
YKPN, Yogyakarta.
[4] Tarigan, Robinson. 2005. Ekonomi
Regional, Teori dan Aplikasi. Bumi
Aksara, Jakarta.
[5] Miraza, B.H., 2010. Medan Belawan Daerah tertinggal, Waspada 23 Februari 2010.
[6] Kuncoro, Mudrajad, 2004. Otonomi dan Pembangunan Daerah: Reformasi,
Perencanaan, Strategi, dan Peluang,
Erlangga, Jakarta.
[7] Sirojuzilam dan Mahalli, Kasyful. 2010. Regional, Pembangunan,
Perencanaan dan Ekonomi. USU Press,
Medan
[8] Richardson, H.W. (1973) Regional Growth Theory, London: Macmillan. [9] Chenery, H. dan Syrquin, M. (1975).
Patterns of Development, 1950-1970.