Diets of Black-tailed Jack Rabbits in Relation
to Population Density and Vegetation
RANDAL D. JOHNSON AND JAY E. ANDERSON
Diets of black-tailed jack rabbits (Lepus cutYfornicus) and com- position of plant communities were compared among habitats that supported different densities of jack rabbits in sagebrush (Arlemi- sia tridentata)/perenniaI grass communities on the Idaho National Engineering Laboratory (INEL) in southeastern Idaho. Diets were more similar than vegetation among areas, indicating that jack rabbits feed selectively; winterfat (Ceratoides hata) and perennial grasses were staple foods, comprising about 80% of the diet in all areas. Jack rabbit densities were higher in areas having higher proportions of grass cover. Similarity between diet and vegetation was positively correlated with jack rabbit density and with the amount of grass cover in the habitat. Jack rabbits selected grass- dominated areas for feeding at night and then fed as generalists on the grass species present.
The black-tailed jack rabbit (Lepus californicus) is the most widely distributed jack rabbit species in North America (Hall and Kelson 1959) and has been described as flexible in habitat require- ments (Vorhies and Taylor 1933). Although jack rabbits may not have rigid habitat requirements, researchers often have observed high densities of black-tailed jack rabbits in some local areas but not others (Vorhies and Taylor 1933, Phillips 1936, Wagner and Stoddart 1972). Factors promoting such patchy distributions are not understood. Some authors proposed that high densities reflect responses to environmental disturbances such as overcrowding and food shortage (Woodbury 1955); drought (Bronson and Tie- meier 1959); or the presence of succulent vegetation (Nagy et al. 1976) cultivated crops (Fagerstone et al. 1980), or abundant sage- brush cover (Adams and Adams 1959, French et al. 1965). In addition, black-tailed jack rabbit populations are thought to fluc- tuate sharply, cycling from low to high densities in 7 to IO-year periods (Wagner and Stoddart 1972, Gross et al. 1974).
Because black-tailed jack rabbits use a variety of habitats, their diets are extremely variable. Jack rabbits are generalist herbivores (Westoby 1974); however, diets vary seasonally in response to forage maturity and availability (Vorhies and Taylor 1933, Hansen et al. 1969, Fagerstone et al. 1980). Grasses dominate the diet in spring and early summer, forbs become more important in late summer and early fall, and shrubs are selected in late fall and winter. Although general seasonal patterns of diet have been iden- tified, recent studies in cold desert, shrub-steppe habitats (Westoby 1973, Uresk 1978, Johnson 1979) have yielded somewhat dissimilar results in terms of importance of specific food items. Johnson (1979) found that a variety of grasses comprised the bulk of the diet. Cheatgrass (Bromus tectorum)was an important diet constit- uent, but needle-and-thread (Stipa comata) was not. These results conflict with those of Uresk (1978), who found that needle-and- thread was the most preferred food, whereas cheatgrass, though
Authors are graduate assistant and associate professor, Department of Biology, ldaho State University, Pocatello 83209.
This paper is a contribution from the Idaho National Engineering Laboratory Ecological Studies Program, supported by the Office of Health and Environmental Research, U.S. Department of Energy. We thank O.D. Markham for hissupport and suggestions, N. Ruffridge for assisting with data collection. and numerous colleagues who have assisted with spotlight counting. J.D. Anderson provided helpful comments on the manuscript.
abundant, was selected against. These results also conflict with Westoby’s (1973) report that halogeton (Halogeton glomeratus) was the most important food item in jack rabbit diets.
We hypothesized that such differences among studies might have resulted from differences in vegetation and jack rabbit popu- lation densities of local areas that were sampled or from confound- ing effects of seasonal differences in diet (e.g. Johnson 1979). The objectives of this study were to compare the composition of vegeta- tion among areas having different population densities of black- tailed jack rabbits and to compare diet with vegetal composition in these areas. The results of this study are useful in understanding the distribution and feeding behavior of black-tailed jack rabbits on shrub-steppe rangeland.
Study Area and Methods
This study was conducted during the summer of 1980 on the Idaho National Engineering Laboratory (INEL). The INEL occu- pies 2,315 km* of the upper Snake River Plain in southeastern Idaho. Climate, soil, and vegetation of the INEL were described by Harniss and West (1973) and Anderson and Holte (1981). The vegetation is characteristic of a northern cold desert shrub biome; big sagebrush (Artemisia tridentata) is the dominant plant on about 80% of the area (Harniss and West 1973). Common under- story species include wheatgrasses (Agropyron spp.), bottlebrush squirreltail (Sitanion hystrix), Indian ricegrass (Oryzopsis hyme- noides), winterfat (Ceratoides lanata), and needle-and-thread.
Based on data from spotlight counts along backroads (see John- son 1982) 11 study sites were chosen in June 1980; these areas represented a variety of population densities and plant community compositions. Eight study sites (SI-S8) were 50-m X 100-m in size, one (S9) was 30-m X 40-m (on top of a sand dune), and the 2 remaining sites (S 10-S 11) were areas from which vegetal data were taken in 1979. At the first eight sites, ten 50-m sample lines, oriented perpendicular to a 100-m baseline, were used to sample plant cover and to establish locations of pellet plots, which were used to estimate the population density at each site. At the sand dune site, six 30-m sample lines were used.
We sampled vegetation and diets only during June and early July to avoid seasonal variation in food availability and nutritional quality; this is the mid to latter portion of the growing season, a time of high nutritional quality of many plant species.
Plant cover was estimated by point interception (Floyd and Anderson 1982). A 0.5-m X 1.0-m point frame was used; it con- sisted of 2 rectangular frames superimposed 10 cm anart. Fishing line was strung at IO-cm intervals in each frame to produce a double-sighting grid of 36 points. The upper and lower grid inter- sections were used as double cross hairs to vertically sight points. The frame was leveled using 3 adjustable legs, over a taut steel tape at l-m intervals, and all hits on stems and leaves of shrubs and forbs and basal areas of grasses were recorded. Data were collected from 100 placements of the frame within 8 sites, whereas 42 place- ments were read in the sand dune site. Percent cover for each plant species within a study area was calculated by dividing the number of points falling on a species by the total number of points sampled.
Table 1. Deta from study sitea including: (1) density of black-triled jack rabbits derived from pellet plot censusing, (2) relative cover (%) of gnsees, forbe, end shrubs In the habitats, end (3) relative deneitiee (%) of grasses, forbe, and shrubs in fecal pellets used in diet snalysis.
Study site
Sl
:: s4 s5 S6 s7 S8 s9 SlO Sll
Density estimate (Jack rabbits/ha)
18.4 f 5.3
9.2 8.0 f f 3.3 3.3 7.3 f 2.6 8.5Y3
5 8.0 f 4:3 5.7 f 2.8 1.4 l 0.7
NA NA
Habitat relative cover Diet relative density
Grasses Forbs Shrubs Grasses Forbs Shrubs
58.9 10.0 31.1 94.5 4.0 1.5
44.0
28.4 15.5 5.7 56. 50.3 I 86.3 71.8 8.4 6.7 2:.:
18.4 73.8 7.8 74.4 20.2 514
12.2 85.7 2.1 79.6 Il.3 9.1
7.2 56.4 36.4 65.5 23.0 11.5
17.9 28.8 53.3 24.2 6.8 69.0
12.8 30.3 56.9 79.6 10.3 10.1
4.5 3.6 91.9 72.5 14.9 12.6
1.8 38.2 89.2 9.3 1.5
4.2 67.5 37.8 15.3 46.9
NA = Not Available
Twenty I-m2 pellet plots per study site were used to estimate jack rabbit population density and to provide fresh pellets for diet analysis. Plots were not established on S 10 or S 11. Pellet plots were cleared in June 1980 on all sites except SS, which was not estab- lished until July 1980. Pellets were collected in July 1980 from all sites, and 3 replicate samples, consisting of 30 large pellets chosen randomly from each study site’s pooled sample, were submitted to the Composition Analysis Laboratory, Colorado State University, Fort Collins, for microhistological analysis (Sparks and Malechek 1968). Only large pellets were submitted to insure that cottontail (Sylvilagus nuttallii) and pygmy rabbit (Sylvilagus idahoensis) pellets were not included. At the Composition Analysis Labora- tory, 5 microscope slides were prepared per sample; 20 microscope fields per slide were systematically located and examined at 100 power magnification. Data taken from the slides were first expressed as per cent frequency of each plant species identified, then converted to density of plant particles per slide location, and finally converted to relative density, following Hansen and Flind- ers (1969).
Statistical tests followed Zar (1974) with u = 0.05. Arcsin trans- formations were performed on the diet and vegetal cover data before correlation analyses because the percentage data covered a wide range of values (Steel and Torrie 1960: 158). Diet and habitat vegetal composition were analyzed for similarity with Kulczynski’s coefficient of similarity (Oosting 1956:77). Preference indices for plant taxa or groups were calculated by dividing the relative den- sity of a plant taxon or group in the diet by the relative cover of that taxon (group) in the habitat (Krueger 1972). A preference index value greater than 1 indicates selection for that food, whereas a
value less than 1 indicates selection against it. Reciprocal averaging ordinations (Gauch 1977) were used to obtain rankings of the study sites based on total floristic composition of either the diet or vegetation data. Spearman’s rank correlation coefficient (Zar 1974) was used to test for a relationship between rankings of vegetation and diet.
Results
Census data from pellet plots (Table 1) and backroads spotlight counts showed wide variation in numbers of jack rabbits within local areas. However, for any given area the relative population density remained about the same throughout the summer of 1980. Based on spotlight census data collected regularly over the INEL (Andersonand Johnson 1982). the black-tailed jack rabbit popula- tion reached a peak in 1981, 1 year after this study. The average population density during the summer of 1980 was approximately one-third of the peak value.
Vegetation of study sites varied markedly among areas (Table 1). Sixty-six plant species including 11 grasses, 7 shrubs, and 48 forbs were identified on the 11 sites (Johnson 1982). On 6 sites, shrubs contributed over 50% of the vegetal cover. Shrub species composi- tion varied among sites; only big sagebrush was recorded on all study areas. Green rabbitbrush (Chrysothamnus viscidtjlorus) was found at 7 sites, saltsage (Atriplex nuttallii)at 6, and winterfat at 3 sites.
Relative cover of grasses ranged from 4.5% to 60% among sites, whereas relative cover of forbs ranged from 1.7% to 8690 (Table 1). Grasses found in a majority of the sites included wheatgrasses
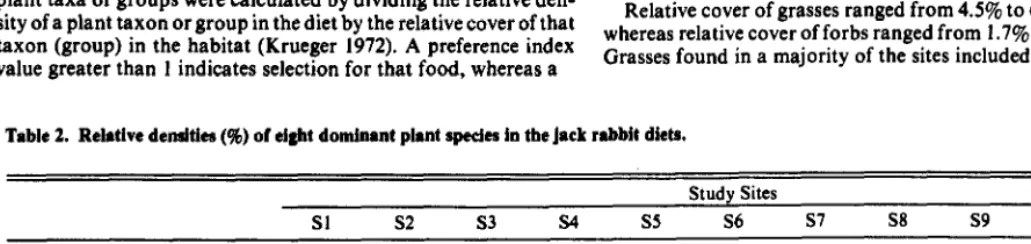
Table 2. Relative densltiea (98) of eight dominant plant specirs in the Jack rabbit diets.
Sl s2 s3 s4
Study Sites
S5 S6 s7 S8 s9 SIO Sll
Agropyron sp. 76 22 36 16 15 16 1 II 26 5 9
Bromus tectorum 1 3 3 2 7 5 1 7 3 6 2
Elymus sp. II f 5 8 9 I 8 13 4 7
PO0 sp. 0 I
:
5 9 I 12 2 2 0
Sitanion hystrix 4 19 6 26 17 19 7 14 17 21 4
Stipa comata I IO 2 II 17 : 6 6 2 19 4
Oryzopsis hymenoides 2 23 18 9 4 8 9 10 32 I2
Ceratoides lanata 0 1 13 I 1 0 67 1 4 I 42
Total 95 86 84 72 74 63 92 68 77 90 80
Table 3. Percent similarity between study she breed on diet composition (values in lower left half of matrix) or veptai cover data (veiua in upper right haif of m8trlx).
Study Sites
Study Sites S1 s2 s3 s4 SS S6 Sl S8 s9 SIO Sll
si 60.2 13.3 22.0 20.9 40.2 44.3 31.3 35.7 20.6 51.4
t: 40.8 52.7 64.7 17.5 24.1 16.7 15.5 13.2 21.7 44.8 48.9 15.5 46.6 11.0 51.1 6.4 37.6 17.8 60.5 14.6
s4 34.0 71.6 49.7 55.6 33.7 28.9 31.7 9.7 10.8 II.2
SS 35.5 65.9 46.4 74.4 31.2 28.3 30. I 4.9 9.3 9.5
S6 32.2 58.5 43.2 67.5 71.4 51.9 55.1 40.5 18.4 32.8
:: 31.7 14.1 30.0 59.2 46.3 36.9 68.1 30.5 77.1 27.2 28.7 16.9 30.6 55.0 36.2 35.1 44.3 35.3 56.5 37.5
S9 49.7 73.0 68.0 61.6 59.3 51.2 29.7 57.7 18.2 30.5
sio 21.0 73.1 45.2 61.4 63.5 53.5 29.0 54.5 48.5 27.3
SII 29. I 47.1 54.7 41.2 38.2 41.6 67.3 42.4 so.4 36.8
Mean rank of indices based on diet data, 7 I .3, is significantly higher (U=S. 18; X0.05) than that based on cover data, 39.8, by Mann Whitney test.
(primarily A. dasytachyum), Indian ricegrass, bottlebrush squir- reltail, and needle-and-thread. Ryegrasses (Elymus spp.) were found on 5 sites. Forbs occurring on most study sites included members of the Leguminosae and Boraginaceae families, particu- larly the genera Astrugulus and Cryptunthu respectively, tansy- mustard (Descuruiniu spp.), little blazing-star (Mentzeliu ulbicuu- lis), and Russian thistle (Sulsolu kuli).
Black-tailed jack rabbits on the INEL ate a wide variety of plants; 43 taxa of plants including 11 grasses, 7 shrubs, and 25 forbs were identified in the fecal pellets (Johnson 1982). Grasses formed the bulk of the diets, whereas shrubs and forbs, although recorded in diets from all study sites, comprised much smaller proportions (Table 1). Only on 2 sites (S7 and Sl 1) did grasses make up less than half of the diets. At these sites, winterfat was the major food item (Table 2); these were the only sites where winterfat was abundant. For all sites combined, winterfat and 7 grass taxa com- prised about 80% of the jack rabbit diet (Table 2). Shrubs, other than winterfat, were not eaten in large amounts. Forbs comprised from 4% to 23% of the jack rabbit diet (Table 1) with only 2 groups, the Boraginaceae and the Leguminosae, found in diets from all 11 study sites.
Study site ranks from the ordinations of diet and vegetal data were not significantly correlated (Spearman’s ~0.68, m.05). This was also true when the 2 sites having an abundance of winter- fat (S7 and Sl 1) were deleted and the data were reordered (Spear- man’s r=O. 12, IQO.05). Thus, jack rabbit diets were not simply a reflection of plant abundance.
The mean rank of similarity indices based on diet data was significantly higher (U=S. 18; KO.05; Mann Whitney test) than those based on cover data across study sites (Table 3). Thus, there was greater similarity among diets from the sites than there was among vegetation found at the sites.
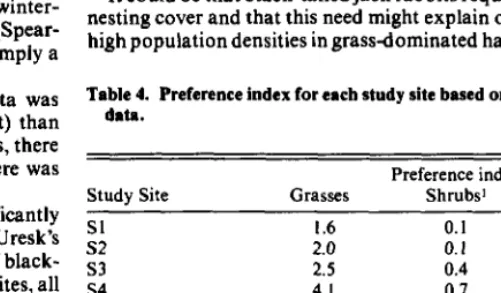
The mean rank of food preference for grasses was significantly higher than that for forbs or shrubs (Table 4), supporting Uresk’s (1978) report that grasses were the most preferred foods of black- tailed jack rabbits in shrub-steppe habitats. At most study sites, all grass species present had preference indices greater than one (Johnson 1982); winterfat, prickly-pear cactus (Opuntiupolyucun- thu), and members of the Boraginaceae and Leguminosae were the only other plant taxa for which jack rabbits consistently exhibited a preference. The high preference index for shrubs at site S5 (Table 4) resulted from low relative cover of shrubs at that site (Table 1) and a moderate amount of prickly-pear in the diet (Johnson 1982). The relatively high preference index for shrubs at sites S7 and S 11
(Table 4) reflects the abundance and consumption of winterfat at those sites.
Jack rabbit density was positively correlated with total grass cover (rz0.82, KO.OS), but not with forb or shrub cover. There was no significant correlation between jack rabbit density and the
JOURNAL OF RANGE MANAGEMENT 37(l), January 1994
relative proportion of any individual plant species in either the cover or diet data. The amount of grass in the diet was positively correlated with grass cover in the habitat (~0.85, KO.05) when study sites high in winterfat cover (S7 and S I 1) were deleted from the analysis. No such relationships were found for shrubs or forbs. Black-tailed jack rabbit diets became significantly more similar to the vegetation as jack rabbit population density increased (r=0.75, KO.05). Jack rabbit diets also became more similar to the vegetation of the habitat as grass cover increased (Fig. I). No relationships between the similarity indices and shrub or forb cover were found.
Discussion
The distribution of black-tailed jack rabbits on the INEL in the summer of 1980 appeared to be related to the relative cover of grasses. Data from the study sites as well as our repeated observa- tions along all backroad spotlight routes showed clearly that the highest numbers of rabbits were associated with areas having high proportions of grass cover (Table 1). These data support Mac- Cracken and Hansen’s (1982) report that black-tailed jack rabbits were found in higher densities in areas that had large amounts of grass biomass.
It could be that black-tailed jack rabbits require grassy areas for nesting cover and that this need might explain our observations of high population densities in grass-dominated habitats. If such were
Table 4. Preference index for each study site based on diet and vegetation data.
Preference index
Study Site Grasses Shrubs’ Forbs
Sl 0.1 0.4
s2 :.:
s3 2:s
0.1 1.5
0.4 0.4
s4 4.1 0.7 0.3
ss 6.5 4.3 0.1
S6 9.1 0.3 0.4
Sl 1.4 1.3 0.2
S8 6.3 0.2 0.3
s9 16.1 0.1 4. I
SIO I.5 0.0 5.4
Sli 1.3 0.7 3.7
Mean Rank* 25.32 10.55 15.14
‘Includes prickly-pear cactus
*H = 13.5; FCO.05 by Kruskal Wallis test. The mean rank for grasses is significantly different from that of shrubs or forbs by the STP non-parametric multiple range te-st (Sokal and Rohlf 198 1). The mean rank for shrubs is not significantly different from that of forbs.
r = 0.83
P<O.O5
0 0
0
0 0
00
0 0
0 0
I I I I I I I I I I
5 IO 15 20 25 30 35 40 45 50
SIMILARITY INDEX
Fig. 1. Relarionship between relative grass cover of the habitat and rhe diet/vegetation similarity indexfor that study site.
the case, we would expect to see numerous young jack rabbits in grass-dominated areas while spotlighting at night as well as nesting adults in grassy areas during the daytime. Our observations sup- port neither of these predictions. Even during the peak year (1981) of the population cycle, we infrequently saw jack rabbits in grassy areas during daytime although they were commonly flushed and observed amongst shrub cover. Similarly, French et al. (1965) reported that high densities ofjack rabbits were found on the INEL in areas supporting a vigorous growth of shrubs; their census observations were made during the daytime. We have never observed a nest, a nesting jack rabbit, or an adult with a litter in a grass-dominated area during the daytime, and in approximately 120 hours of spotlighting of backroads habitats during which we have counted over 5,000 jack rabbits, we have observed an adult with a suckling litter on only one occasion. We conclude that the jack rabbits select open, grass-dominated habitats for feeding at night and then retreat to shrub cover during the day. Similar findings were reported by Fautin (1946), Lechleitner (1959), and Haug( 1969), who thought that the taller, denser canopies provided protection from the sun and from predators.
Jack rabbits on the INEL are generalist herbivores, as is evident in their use of a wide variety of food items. Diets varied consider- ably between areas depending on taxa available. Nevertheless, the rabbits were selective feeders and did not consume plants in pro- portion to their abundance in the habitat. Our results support those of other investigators who have reported that grasses are the major component of diets when they are available in spring and summer (Currie and Goodwin 1966, Hayden 1966, Hansen et al. 1969, Fagerstone et al. 1980). Because the diet data for each study site was from a composite pellet sample, the diet probably reflects what was eaten by a number of individuals. Thus, diversity in food items may have resulted from selection of different diets by differ- ent individuals or from “sampling” as described by Westoby (1974). Alternatively, it may reflect diversity within individual diets.
Jack rabbits did not appear to select habitats for specific grass species; rather, they selected open, grass-dominated habitats and then tended to eat whatever grasses were found there, as shown by the positive correlation between the diet/vegetation similarity index and grass cover of the habitat (Fig. 1). In areas supporting high population densities, jack rabbits foraged even more as gener- alist herbivores than their counterparts in areas having low popula- tion densities. This was probably due to the availability of larger
82
amounts of preferred grasses in those areas having high population densities. Thus, there was a difference in diets between high and low population density areas, but this difference was only apparent when the vegetal composition of the habitats was known.
By selecting grass-dominated habitats for feeding at night, the jack rabbits have easy access to their preferred foods, which may reduce search costs (Westoby 1978) in terms of both time (risk) and energy (Flinders and Hansen 1972). Jack rabbits in areas having lower proportions of grass cover still selected grasses as their major diet component, but such selective feeding may be less time/energy efficient in comparison to that in the grass-dominated areas.
Literature Cited
Adams, H.B., and L. Adams. 1959. Black-tailed jackrabbit carcasses on the highways in Nevada, Idaho, and California. Ecology 40:718-720. Anderson, J.E., and K.E. Holte. 1981. Vegetation development over 25
years without grazing on sagebrush-dominated rangeland in southeast- ern Idaho. J. Range Manage. 34:25-29.
Anderson, J-E., and R.D. Johnson. 1982. Impacts ofjack rabbit herbivory on sagebrush steppe vegetation. In: Ecological Studies on the Idaho National Engineering Laboratory Site, 1982 Progress Report, O.D. Markham, Ed. U.S. Department of Energy, Idaho Operations Office, Idaho Falls. In Press.
Bronson, F.H., and O.W. Tiemeier. 1959. The relationship of precipitation and black-tailed jack rabbit populations in Kansas. Ecology40: 194-198. Currie, P.O., and D.L. Goodwin. 1966. Consumption of forage by black-
tailed jackrabbits on salt-desert ranges of Utah. J. Wild]. Manage. 30:304-3 I I.
Fagerstone, K.A., C.K. Lavoie, and R.E. Griffith Jr. 1980. Black-tailed jackrabbit diet and density on rangeland and near agricultural crops. J.
Range Manage. 33:229-233.
Fautin, R.W. 1946. Biotic communities of the northern desert shrub biome in western Utah. Ecol. Monogr. 16:251-310.
Flinders, J.T., and R.M. Hansen. 1972. Diets and habitats ofjackrabbits in northeastern Colorado. Colorado State Univ. Range Sci. Dep. Sci. Ser. No. 12.
Floyd, D.A., and J.E. Anderson. 1982. A new point interception frame for estimating cover of vegetation. Vegetatio. 50:185-186.
French, N.R., R. McBride, and J. Detmer. 1965. Fertility and population density of the black-tailed jackrabbit. J. Wildl. Manage. 29:14-26. Gauch Jr., H.G. 1977. Ordiflex. Ecology and Systematics. Cornell Univ.,
Ithaca, NY.
Gross, J.E., L.C. Stoddart, and F.H. Wagner. 1974. Demographic analysis of a northern Utah jackrabbit population. Wild]. Monogr. 40:63. Hall, E.R., and K.R. Kelson. 1959. The mammals of North America.
Ronald Press Co., New York.
Hansen, R.M., and J.T. Flinders. 1969. Food habitats of North American hares. Range Sci. Dep. Sci. Ser. No. 1. Colorado State Univ., Fort Collins.
Hansen, R.M., N.E. Green, and D.R. Sparks. 1969. Black-tailed jackrab- bits on sandhill rangeland. Colorado State Univ. Exp. Sta. Progress Report, Fort Collins.
Harniss, R.O., and N.E. West. 1973. Vegetation patterns of the National Reactor Testing Station, southeastern Idaho. Northwest Sci. 47:30-43. Haug, J.C. 1969. Activity and reproduction of the black-tailed jackrabbit
in the coastal cordgrass prairie of Texas. M.S. Thesis. Texas A & M Univ., College Station.
Hayden, P. 1966. Food habits of black-tailed jack rabbit in southern Nevada. J. Mammal. 47:42-46.
Johnson, M.K. 1979. Foods of primary consumers on cold desert shrub- steppe of southcentral Idaho. J. Range Manage. 35:365-368.
Johnson, R.D. 1982. Relationships of black-tailed jack rabbit diets to population density and vegetal components of habitat. M.S. Thesis. Idaho State Univ., Pocatello.
Krueger, W.C. 1972. Evaluating animal forage preference. J. Range Man- age. 25~471-475.
Lechleitner, R.R. 1959. Movements, density, and mortality in a black- tailed jack rabbit population. J. Wildl. Manage. 22:371-384.
MacCracken, J.G., and R.M. Hansen. 1982. Herbaceous vegetation of habitat used by blacktail jackrabbits and Nuttall cottontails in sou- theastern Idaho. Amer. Midl. Natur. 107:180-184.
Nagy, K.A., V.H. Shoemaker, and W.R. Costa. 1976. Water, electrolyte, and nitrogen budgets ofjack rabbits (Lepus californicus)in the Mojave Desert. Physiol. Zool. 49:351-363.
Oosting, H.J. 1956. The study of plant communities. 2nd ed. W.H. Free- man and Co., San Francisco.
Phillips, P. 1936. The distribution of rodents in overgrazed and normal grasslands of Oklahoma. Ecology 17:673-679.
Sokal, R.R., and F.J. Rohlf. 1981. Biometry. W.H. Freeman and Co. San Francisco.
Sparks, D.R., and J.C. Malechek. 1968. Estimating percentage dry weight in diets using a microscope technique. J. Range Manage. 21:264-265. Steel, R.G.D., and J.H. Torrie. 1960. Principles and procedures of statis-
tics. McGraw-Hill Book Co., Inc. New York.
Ureak, D.W. 1978. Diets of the black-tailed hare in steppe vegetation. J. Range Manage. 31:439-442.
Vorhies, C.T., and W.P. Taylor. 1933. The life histories and ecology ofjack rabbits, Lepus alleni and Lepus californicus spp.. in relation
to grazing in Arizona. Univ. Arizona Agr. Exp. Sta. Tech. Bull. 49:471-587. W;gner,-F.H., and L.C. Stoddart. 1972. Influence of coyote predation on black-tailed iackrabbit oouulations in Utah. J. Wildl. Manage. 6:329-342. Westoby, M. i973. Impact of black-tailed jack rabbit (Lepus-cafifornicus)
on vegetation in Curlew Valley, northern Utah. Ph.D. Thesis. Utah State Univ., Logan.
Westoby, M. 1974. An analysis of diet selection by large generalist herbi- vores. Amer. Natur. 108:290-304.
Westoby, M. 1978. What are the biological bases of varied diets? Amer. Natur. I 12:627-63 1.
Woodbury, A.M. 1955. Ecology of the Great Salt Lake Desert. 1. An annual cycle of the desert jack-rabbit. Ecology 36353-356.