Available Online atwww.ijcsmc.com
International Journal of Computer Science and Mobile Computing
A Monthly Journal of Computer Science and Information Technology
ISSN 2320–088X
IMPACT FACTOR: 6.017
IJCSMC, Vol. 6, Issue. 6, June 2017, pg.465 – 472
Social Media Sentiment Analysis using
Machine Learning Classifiers
Bharat Naiknaware
1, Bindesh Kushwaha
2, Seema Kawathekar
31, 3
Dept. of CS and IT, Dr. Babasaheb Ambedkar Marathwada University, Aurangabad
1
3
2
Salesforce Developer, Wipro Technologies, Pune
2
Abstract: Comparison of different machine learning techniques applied to the case of sentiment analysis in social media. Several machine learning methods were used during experimentation session: Maximum Entropy, Naive Bayes and Support Vector Machines we tried to compare different techniques for preprocessing Social media data and find those ones which impact on the building accurate classifiers. We use Twitter, an online social networking and micro blogging tweets facility, which user can update related post in the form of content type is text, known as tweets, with 140-character limit. There are also many sources that express opinions of news entities (people, places, things) while publishing recent events. We develop an automated system which extracts the sentiments from the online posts from twitter. Our system shows sentiment identification, which expresses opinion associated with each entity. Also it consists of scoring phase, which assigns scores to each entity, on which the tweets are classified. Finally we have leveraged Naive Bayes, Support vector machine and Maximum Entropy classifiers Algorithms to do the sentiment analysis on this myriad of data.
Keywords: SVM, Naïve Bayes, Maximum Entropy MAE, ME, Sentiment Analysis
Introduction:
available. This data consisted primarily Textual and numerical forms that can be categorized as Structured, semi-structured or non-structured. The focus of most of the researchers revolves around the Approaches and Techniques to extract and apply useful information from this myriad of data.
The sudden spike in Computer technology advancements in area of Sentiment Analysis and Opinion mining which deals with the analysis of subjectivity and sentiment of the posted content using different retrieval techniques and tools. As a result of this advancement in data and text mining, researchers have shown considerable interest in Sentiment analysis of this relevant cloud data. Sentiment analysis, also known as opinion mining is basically done to computationally identify and extract subjective information from source materials and to categorize this information to know the user‟s attitude towards a particular agenda. This categorization is basically done broadly into Positive, Neutral, or Negative.
Using appropriate mechanisms and techniques, this vast amount of data can be processed into information to support operational, managerial, and strategic decision making [8]. Sentiment analysis aims to identify and extract opinions and attitudes from a given piece of text towards a specific subject [11]. This Sentiment Analysis process delivers a smarter and more of human-like artificial intelligence, which can analyze and respond in a unique way based on the emotions user show in a written chat/tweet/blog conversation. There has been much progress on sentiment analysis of conventional text which is usually found in open forums, blogs and the typical review channels. Through the platforms like Facebook, Yammer and Twitter, millions of status updates, posts and Tweet messages, which reflects people‟s present opinion and attitude towards particular agenda, are created and posted every day. However, Sentiment analysis of micro blogs like twitter is considered as a much harder problem due to the unique characteristics possessed by micro blogs (e.g. short length of status updates and language variations with regional language influence).
Related Work:
authors aim of paper is to find best effective features which provide better result and also provide better feature selection method. They have also express that how unigram feature set can be reduced to get better result.
Experimental Setup:
Datasets Collection from Twitter:
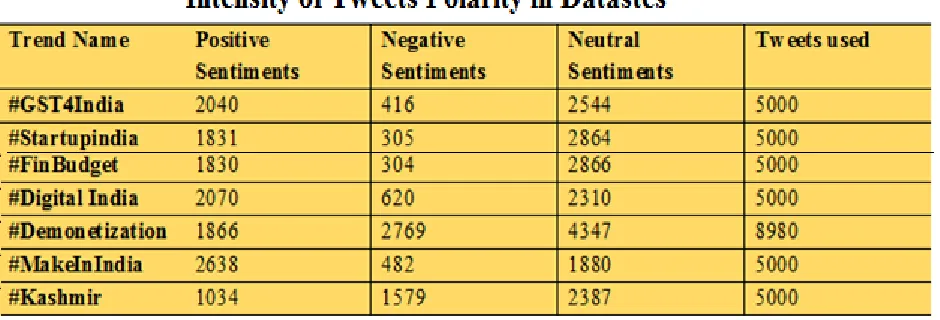
We are collecting twitter datasets is used to collect a corpus of text posts and a dataset is formed of three classes: positive, negative and neutral sentiments. We are using Indian government announced schemes in 2017 like Budget2017, Demonetization, Digital India, GST Kashmir, Make in India, Swach Bharat, the data on twitter was all datasets collected in March 2017.
FEATURE EXTRACTION
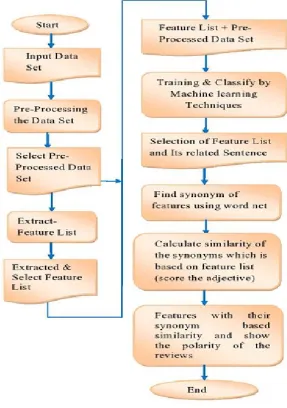
The collected dataset is used to extract features that will be used to train the sentiment classifier. Experimentation is carried out using n-gram binary features. The process of obtaining n-grams from the Twitter post is as follows.
i) Filtering: here we are Removing URL links that are in datasets files before preprocessing ii) Tokenization: Tokenization is the process of breaking a stream of text up into words, phrases, symbols, or other meaningful elements called tokens. The list of tokens becomes input for further processing such as parsing or text mining. Tokenization is useful both in linguistics we segment text by splitting it by spaces and punctuation marks. However, we make sure that short forms such as “din‟t”, “w‟ll”, remain as one word.
iii) Removing stop words: we remove articles (“a”, “an”, “the”) from datasets.
iv) Removing numbers, punctuation, and unnecessary spaces: e.g. Photoset httptco46iM8j8pkt after preprocessing is obtained as Photoset https://t.co/f9zDs2Zr9v Missing values: NA is assigned to the missing values.
v) Converting to lower case: All the letters in the sentences are converted into lower case. vi) Constructing n-grams: we make a set of n-grams out of consecutive words. A negation (such as “no” and “not”) is attached to a word which precedes it or follows it. For example, a sentence “I do not like fish” will form two bigrams: “I do+not”, “do+not like”,“not+like fish”
Generate Score for sentiment Analysis:
Fig 1.Proposed methodology
Machine Learning Methods:
Result Analysis:
We are using the classifiers that are compared based on the accuracy measures such as Mean error (ME), Root mean square error (RMSE), Mean absolute error (MAE), Mean Percentage Error (MPE), Mean Absolute Percentage Error (MAPE). This are accuracy measurement parameters in sentiment analysis. Here we are comparing majorly two important parameters i.e. ME (Mean error) and (MAE) Mean absolute error the simplest measure of forecast accuracy is called Mean Absolute Error (MAE). MAE is a quantity used to measure how close forecasts or predictions are to the eventual outcomes or in other words we can say it simply the mean of the absolute errors. The absolute error is the absolute value of the difference between the forecasted value and the actual value.
MAE tells us how big of an error we can expect from the forecast on average. Cort J. Willmott et.al [19] indicates that MAE is the most natural measure of average error magnitude also the Mean Error is important here we are finding the error value of particular datasets than RMSE. Evaluations and inter-comparisons of average model performance error should be based on ME and MAE. Table1 shows the ME and table 2 shows MAE for the datasets Budget2017, Demonetization, GST2017, Digital India, Kashmir, Make in India, Startup India and Table 3 shows the intensity of Datasets.
Table 1 ME (Mean Error) of Datasets Classifier ME
Datasets Budget2017 Demonetization GST2017 Digital India
Kashmir Make in India
Startup India
Naïve Bayes
45 97 15 20 27 35 30
SVM 66 78 31 47 91 12 36
Maximum Entropy
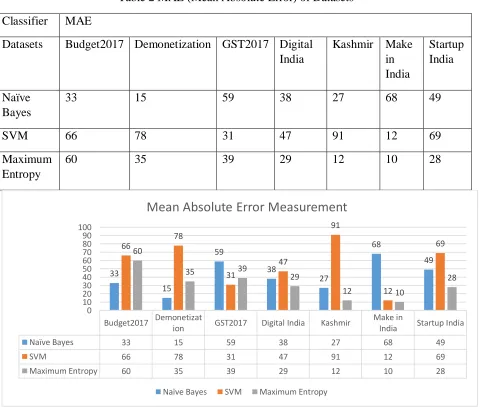
Table 2 MAE (Mean Absolute Error) of Datasets
Classifier MAE
Datasets Budget2017 Demonetization GST2017 Digital India
Kashmir Make in India Startup India Naïve Bayes
33 15 59 38 27 68 49
SVM 66 78 31 47 91 12 69
Maximum Entropy
60 35 39 29 12 10 28
Budget2017 Demonetiza
tion GST2017 Digital India Kashmir
Make in India
Startup India
Naïve Bayes 45 97 15 20 27 35 30
SVM 66 78 31 47 91 12 36
Maximum Entropy 60 35 39 39 12 10 28
45
97
15 20
27 35 30
66 78 31 47 91 12 36 60
35 39 39
12 10
28 0 10 20 30 40 50 60 70 80 90 100
%
Mean Error Measurement
Naïve Bayes SVM Maximum Entropy
Budget2017 Demonetizat
ion GST2017 Digital India Kashmir
Make in
India Startup India
Naïve Bayes 33 15 59 38 27 68 49
SVM 66 78 31 47 91 12 69
Maximum Entropy 60 35 39 29 12 10 28
33 15 59 38 27 68 49 66 78 31 47 91 12 69 60
35 39 29
12 10
28 0 10 20 30 40 50 60 70 80 90 100
Mean Absolute Error Measurement
Table 3 Intensity of Tweets polarity in Datasets
Conclusions and Future Scope
If the MAE is smaller than accuracy is more. The results show that the performance of the classifiers is same. There is marginal difference in the MAE. The performance of the classifiers was made for seven datasets (Budget2017, Demonetization, GST2017, Digital India, Kashmir, Make in India, Startup India). In the Budget2017 dataset Naïve Bayes performs best, In Demonetization dataset Naïve Bayes performs best. In the GST2017 SVM is showing best performance, whereas in the Digital India, Kashmir, Make in India and Startup shows Max Entropy performs best. Here we are also find the Mean Error for predicting the Mean Absolute Error easily. In future we plan find the other accuracy measurement parameters.
References:
1) Varsha D. Jadhav , S.N. Deshmukh ”Comparison Of Classifiers For Sentiment Analysis” Novateur Publications International Journal Of Innovations In Engineering Research And Technology [IJIERT] ISSN: 2394-3696 Volume 3, Issue 1, Jan.-2016.
2) Warih Maharani “Microblogging Sentiment Analysis with Lexical Based and Machine Learning Approaches” International Conference of Information and Communication Technology (ICoICT) 20-22 March 2013.
3) Rohit Joshi Rajkumar Tekchandani “Comparative Analysis Of Twitter Data Using Supervised Classifiers” 2016 International Conference on Inventive Computation Technologies (ICICT) Volume 3 26-27 August 2016
4) Luiz F. S. Coletta, N´adia F. F. da Silva, Eduardo R. Hruschka Estevam R. Hruschka Jr “Combining Classification and Clustering for Tweet Sentiment Analysis” Brazilian Conference on Intelligent Systems 18-22 Oct. 2014
5) R. Nivedha , N. Sairam “ A Machine Learning based Classification for Social Media Messages” ISSN (Print) : 0974-6846 ISSN (Online) : 0974-5645 Indian Journal of Science and Technology, Vol 8(16), July 2015
6) Lopamudra Dey, Sanjay Chakraborty, Anuraag Biswas, Beepa Bose, Sweta Tiwari “Sentiment Analysis of Review Datasets Using Naïve Bayes„ and K-NN Classifier” International Journal Information Engineering and Electronic Business, 2016, 4, 54-62 Published Online July 2016 in MECS (http://www.mecs-press.org/) DOI: 10.5815/ijieeb.2016.04.07
8) Suchita V. Wawre , Sachin N. Deshmukh ” Sentimental Analysis of Movie Review using Machine Learning Algorithm with Tuned Hype parameter” International Journal of Innovative Research in Computer and Communication Engineering Vol. 4, Issue 6, June 2016
9) Chandrika Chatterjee, Kunal Chakma “A Comparison between Sentiment Analysis of Student Feedback at Sentence Level and at Token Level” IJCSN International Journal of Computer Science and Network, Volume 4, Issue 3, June 2015 ISSN (Online) : 2277-5420
10) Bhumika M. Jadav ,Vimalkumar B. Vaghela, ”Sentiment Analysis using Support Vector Machine based on Feature Selection and Semantic Analysis” International Journal of Computer Applications (0975 – 8887) Volume 146 – No.13, July 2016
11) Sunny Kumar, Dr. Paramjeet Singh, Dr. Shaveta Rani “Study of Different Sentimental Analysis Techniques: Survey” International Journal of Advanced Research in Computer Science and Software Engineering Volume 6, Issue 6, June 2016 ISSN: 2277 128X