Electronic Thesis and Dissertation Repository
11-11-2019 10:00 AM
Exploring the Temporal Variability of Speech Intensity, Speech
Exploring the Temporal Variability of Speech Intensity, Speech
Intelligibility, and Communicative Participation in Individuals with
Intelligibility, and Communicative Participation in Individuals with
Hypophonia and Parkinson’s Disease
Hypophonia and Parkinson’s Disease
Cynthia Mancinelli
The University of Western Ontario
Supervisor Adams, Scott G.
The University of Western Ontario Co-Supervisor Page, Allyson D.
The University of Western Ontario
Graduate Program in Health and Rehabilitation Sciences
A thesis submitted in partial fulfillment of the requirements for the degree in Doctor of Philosophy
© Cynthia Mancinelli 2019
Follow this and additional works at: https://ir.lib.uwo.ca/etd
Part of the Speech and Hearing Science Commons Recommended Citation
Recommended Citation
Mancinelli, Cynthia, "Exploring the Temporal Variability of Speech Intensity, Speech Intelligibility, and Communicative Participation in Individuals with Hypophonia and Parkinson’s Disease" (2019). Electronic Thesis and Dissertation Repository. 6704.
https://ir.lib.uwo.ca/etd/6704
This Dissertation/Thesis is brought to you for free and open access by Scholarship@Western. It has been accepted for inclusion in Electronic Thesis and Dissertation Repository by an authorized administrator of
Abstract
Hypophonia, or reduced speech intensity, is frequently observed in individuals with Parkinson’s disease (PD). This speech deficit can impact speech intelligibility and communicative participation. However, there is little empirical evidence exploring the day-to-day variability of speech and communicative participation in individuals with PD. The purpose of this study is to investigate the temporal variability of acoustic and
perceptual speech measures and psychosocial measures in individuals with hypophonia and PD. Additionally, this study seeks to examine the relationships among measures of speech intensity, speech intelligibility, self- and proxy-rated communicative participation, demographic factors, and non-speech factors. Twenty-three participants with PD, 23 primary communication partners, and 30 control participants attended three experimental visits. At each visit, participants completed questionnaires related to speech loudness and communicative participation. Participants with PD and control participants also
performed speech intensity and speech intelligibility tasks. Variability in habitual speech intensity and Lombard response slope was found for participants with PD. Differences were found in maximum speech intensity, magnitude production, speech intelligibility, and self-perceived typical speech loudness for participants with PD and control
participants. The results revealed similar self- and proxy-ratings of speech loudness in participants with PD. A significant difference was found between participants with PD and control participants across self-rated communicative participation measures. Greater variability was observed for the Communicative Participation Item Bank (CPIB), six questions of the Communicative Effectiveness Survey (CES), and two subsections of the Voice Activity and Participation Profile (VAPP) in participants with PD. Self- and proxy-rated communicative participation was comparable. Significant relationships were
and may provide context in the interpretation of treatment outcomes in this clinical population.
Keywords
Summary for Lay Audience
Hypophonia, or reduced speech loudness, is frequently observed in individuals with Parkinson’s disease (PD). This speech difficulty can impact an individual’s speech intelligibility (how understandable they are) and their communicative participation (engaging in situations where information is shared). However, there is little empirical evidence exploring the day-to-day variability of various speech and communication measures in individuals with PD. The purpose of this study is to investigate the
variability of such measures in individuals with hypophonia and PD. Additionally, this study seeks to examine the relationships among measures of speech loudness, speech intelligibility, communicative participation, and other demographic and non-speech factors. Twenty-three participants with PD, 23 communication partners of participants with PD, and 30 control participants attended three experimental visits. At each visit, participants completed questionnaires related to speech loudness and communicative participation. Participants with PD and control participants also performed speech intensity and speech intelligibility tasks. Significant variability was found in various speech tasks in participants with PD, including habitual speech loudness and Lombard response function (how one’s speech loudness changes in the presence of background noise). Differences were found between participants with PD and control participants for various speech loudness, speech intelligibility, and communicative participation
Acknowledgements
I would like to extend my appreciation and gratitude to my supervisors, Dr. Scott Adams and Dr. Allyson Page, for their support and guidance throughout my degree and the completion of this project. Their assistance and contributions have been invaluable throughout every step of the way. I would also like to thank my advisory committee, Dr. Mandar Jog and Dr. Julie Theurer, for their guidance and expertise. Many thanks to my thesis examination committee, Dr. Julie Theurer, Dr. Jeff Holmes, Dr. Mary Jenkins, and Dr. Mark Hakel, for taking the time to read my thesis and ensuring a high caliber final product.
These last six years would not have been possible without my parents, Diane Pardillo and John Mancinelli. Thank you for your unwavering encouragement and faith in me. Your unconditional love and support have allowed me to persevere and achieve my academic goals and realize that I am capable of accomplishing anything I chose to strive towards. I would also like to thank my brother and extended family for your love and
encouragement throughout this journey.
Thank you to my dearest friends and lab mates, Anita Abeyesekera, Thea Knowles, and Daryn Cushnie-Sparrow, and my treasured friends Caitlin Coughler, Anjana Balakrishna, and Meg Haggitt. Thank you for your friendship, support, and motivation. Thank you for helping me gain perspective, setting and accomplishing goals, and ensuring that I have balance in my life. I could not have asked for stronger and more supportive friends.
Table of Contents
ABSTRACT ... II
SUMMARY FOR LAY AUDIENCE ... IV
ACKNOWLEDGEMENTS ... V
LIST OF TABLES ... XVII
LIST OF FIGURES ... XXV
LIST OF APPENDICES ... XXXI
LIST OF ACRONYMS ... XXXII
Chapter 1 ... 1
1 Introduction ... 1
1.1 Hypophonia and Parkinson’s Disease ... 1
1.2 Regulation of Speech Intensity in Hypophonia and Parkinson’s Disease ... 3
1.2.1 Speech intensity in hypophonia and Parkinson’s disease ... 5
1.2.2 The effect of background noise on speech intensity in hypophonia and Parkinson’s disease ... 7
1.3 Loudness Perception in Hypophonia and Parkinson’s Disease ... 10
1.4 Speech Intelligibility in Hypophonia and Parkinson’s Disease ... 12
1.4.1 The effect of background noise on speech intelligibility in hypophonia and Parkinson’s disease ... 13
1.5 Communicative Participation in Hypophonia and Parkinson’s Disease ... 15
1.5.1 Communicative Participation Item Bank ... 17
1.5.2 Voice Activity and Participation Profile ... 17
1.5.3 Communicative Effectiveness Survey ... 18
1.6 Demographic and Non-Speech Factors in Hypophonia and Parkinson’s Disease 20 1.7 Rationale for the Current Study ... 22
1.8 Purpose ... 24
2 METHODS ... 27
2.1 Participants ... 27
2.1.1 Participants with Parkinson’s disease ... 27
2.1.2 Control participants ... 28
2.1.3 Primary communication partners of participants with Parkinson’s disease ... 28
2.1.4 Listener participants ... 29
2.2 Materials ... 29
2.2.1 Apparatus ... 29
2.2.2 Noise source ... 30
2.2.3 Audio recordings ... 30
2.2.4 Speech intensity measures ... 30
2.2.5 Speech intelligibility measures ... 31
2.2.5.1 Sentence Intelligibility Test ... 31
2.2.5.2 Conversational intelligibility ... 31
2.2.6 Questionnaires ... 31
2.2.6.1 Intake questions ... 31
2.2.6.2 Montreal Cognitive Assessment ... 35
2.2.6.3 Geriatric Depression Scale ... 36
2.2.6.4 Medication Effectiveness Scale ... 36
2.2.6.4 Typical Loudness Scale ... 36
2.2.6.5 Communicative Effectiveness Survey ... 36
2.2.6.6 Voice Activity and Participation Profile ... 37
2.2.6.7 Communication Participation Item Bank ... 37
2.2.6.8 Level of Speech Usage Scale ... 38
2.3 Procedures ... 38
2.3.1 Visit 1 ... 38
2.3.2 Visit 2 ... 43
2.3.3 Visit 3 ... 44
2.3.4 Listener perceptual evaluation ... 45
2.3.4.1 Sentence Intelligibility Test ... 45
2.3.4.2 Conversational intelligibility ... 46
2.4 Data Analysis ... 46
2.4.1 Statistical analysis for objective 1: Speech intensity ... 47
2.4.2 Statistical analysis for objective 2: Typical speech loudness ... 49
2.4.3 Statistical analysis for objective 3: Speech intelligibility ... 50
2.4.4 Statistical analysis for objective 4: Self-rated communicative participation .... 51
2.4.5 Statistical analysis for objective 5: Self- and proxy-rated communicative participation ... 52
2.4.6 Statistical analysis for objective 7: Inter-relationships among variables in participants with Parkinson’s disease ... 53
2.4.8 Statistical analysis for objective 9: Inter-relationships among variables in
control participants ... 54
CHAPTER 3 ... 55
3 Results ... 55
3.1 Statistical Power ... 55
3.2 Reliability ... 56
3.3 Statistical Analysis for Objective 1: Speech Intensity ... 58
3.3.1 Habitual speech intensity ... 58
3.3.1.1 Retest analyses ... 61
3.3.1.1.1 Retest analysis of habitual speech intensity for participants with Parkinson’s disease ... 62
3.3.1.1.2 Retest analysis of habitual speech intensity for control participants .... 63
3.3.2 Maximum speech intensity ... 64
3.3.2.1 Retest analyses ... 66
3.3.2.1.1 Retest analysis of maximum speech intensity for participants with Parkinson’s disease ... 67
3.3.2.1.2 Retest analysis of maximum speech intensity for control participants 68 3.3.3 Lombard response function ... 69
3.3.3.1 Retest analyses ... 70
3.3.3.1.1 Retest analysis of Lombard response function for participants with Parkinson’s disease ... 71
3.3.3.1.2 Retest analysis of Lombard response function for control participants 72 3.3.4 Magnitude production ... 72
3.3.4.1 Retest analyses ... 74
3.3.4.1.1 Retest analysis of magnitude production for participants with Parkinson’s disease ... 75
3.3.4.1.2 Retest analysis of magnitude production for control participants ... 76
3.4 Statistical Analysis for Objective 2: Typical Speech Loudness ... 77
3.4.1 Retest analyses ... 79
3.4.1.1 Retest analysis of self-rated typical speech loudness for participants with Parkinson’s disease ... 80
3.4.1.2 Retest analysis of self-rated typical speech loudness for control participants ... 81
3.5 Statistical Analysis for Objective 3: Speech Intelligibility ... 83
3.5.1 SIT transcription scores ... 83
3.5.1.1 Retest analyses ... 85
3.5.1.1.1 Retest analysis of SIT transcription scores of participants with Parkinson’s disease ... 86
3.5.1.1.2 Retest analysis of SIT transcription scores for control participants ... 87
3.5.2 SIT VAS scores ... 88
3.5.2.1 Retest analyses ... 89
3.5.2.1.1 Retest analysis of SIT VAS scores for participants with Parkinson’s disease….. ... 90
3.5.2.1.2 Retest analysis of SIT VAS scores for control participants ... 91
3.5.3 Conversational intelligibility VAS scores ... 92
3.5.3.1 Retest analyses ... 93
3.5.3.1.1 Retest analysis of VAS conversational intelligibility scores for participants with Parkinson’s disease ... 94
3.5.3.1.2 Retest analysis of VAS conversational intelligibility scores for control participants ... 95
3.6 Statistical Analysis for Objective 4: Self-Rated Communicative Participation .... 96
3.6.1 CES question scores ... 96
3.6.1.1 Retest analyses ... 109
3.6.1.1.1 Retest analysis of CES question 1 (Having a conversation with a family member or friends at home) scores for participants with Parkinson’s disease .... 110
3.6.1.1.2 Retest analysis of CES question 1 (Having a conversation with a family member or friends at home) scores for control participants ... 111
3.6.1.1.3 Retest analysis of CES question 2 (Participating in conversation with strangers in a quiet place) scores for participants with Parkinson’s disease ... 112
3.6.1.1.4 Retest analysis of CES question 2 (Participating in conversation with strangers in a quiet place) scores for control participants ... 114
3.6.1.1.5 Retest analysis of CES question 3 (Conversing with a familiar person over the telephone) scores for participants with Parkinson’s disease ... 114
3.6.1.1.6 Retest analysis of CES question 3 (Conversing with a familiar person over the telephone) scores for control participants ... 116
3.6.1.1.8 Retest analysis of CES question 4 (Conversing with a stranger over the telephone) scores for control participants ... 118 3.6.1.1.9 Retest analysis of CES question 5 (Being part of a conversation in a noisy environment (social gathering)) scores for participants with Parkinson’s disease….. ... 119 3.6.1.1.10 Retest analysis of CES question 5 (Being part of a conversation in a noisy environment (social gathering)) scores for control participants ... 120 3.6.1.1.11 Retest analysis of CES question 6 (Speaking to a friend when you are emotionally upset or you are angry) scores for participants with Parkinson’s disease….. ... 121 3.6.1.1.12 Retest analysis of CES question 6 (Speaking to a friend when you are emotionally upset or you are angry) scores for control participants ... 123 3.6.1.1.13 Retest analysis of CES question 7 (Having a conversation while
travelling in a car) scores for participants with Parkinson’s disease ... 123 3.6.1.1.14 Retest analysis of CES question 7 (Having a conversation while
traveling in a car) scores for control participants ... 125 3.6.1.1.15 Retest analysis of CES question 8 (Having a conversation with
someone at a distance (across a room)) scores for participants with Parkinson’s disease….. ... 126 3.6.1.1.16 Retest analysis of CES question 8 (Having a conversation with
someone at a distance (across a room)) scores for control participants ... 127 3.6.2 VAPP subsection scores ... 128 3.6.2.1 Retest analyses ... 140
3.6.2.1.1 Retest analysis of VAPP self-perceived voice problem scores for
participants with Parkinson’s disease ... 141 3.6.2.1.2 Retest analysis of VAPP self-perceived voice problem scores for
control participants ... 142 3.6.2.1.3 Retest analysis of VAPP daily communication scores for participants with Parkinson’s disease ... 143 3.6.2.1.4 Retest analysis of VAPP daily communication scores for control
3.6.2.1.5 Retest analysis of VAPP social communication scores for participants
with Parkinson’s disease ... 146
3.6.2.1.6 Retest analysis of VAPP social communication scores for control participants ... 147
3.6.2.1.7 Retest analysis of VAPP emotion scores for participants with Parkinson’s disease ... 148
3.6.2.1.8 Retest analysis of VAPP emotion scores for control participants ... 150
3.6.2.1.9 Retest analysis of VAPP activity limitation scores for participants with Parkinson’s disease ... 150
3.6.2.1.10 Retest analysis of VAPP activity limitation scores for control participants ... 152
3.6.2.1.11 Retest analysis of VAPP participation restriction scores for participants with Parkinson’s disease ... 153
3.6.2.1.12 Retest analysis of VAPP participation restriction scores for control participants ... 154
3.6.2.1.13 Retest analysis of VAPP total scores for participants with Parkinson’s disease….. ... 155
3.6.2.1.14 Retest analysis of VAPP total scores for control participants ... 157
3.6.3 CPIB scores ... 157
3.6.3.1 Retest analyses ... 160
3.6.3.1.1 Retest analysis of CPIB scores for participants with Parkinson’s disease….. ... 160
3.6.3.1.2 Retest analysis of CPIB scores for control participants ... 162
3.6.4 LSUS scores ... 162
3.6.4.1 Retest analyses ... 165
3.6.4.1.1 Retest analysis of LSUS scores for participants with Parkinson’s disease….. ... 165
3.6.4.1.2 Retest analysis of LSUS scores for control participants ... 167
3.7 Statistical Analysis for Objective 5: Self- and Proxy-Rated Communicative Participation ... 167
3.7.1 CES question scores ... 168
3.7.1.1.1 Retest analysis of CES question 1 (Having a conversation with a family member or friends at home) scores for participants with Parkinson’s disease .... 180 3.7.1.1.2 Retest analysis of CES question 1 (Having a conversation with a family member or friends at home) scores for primary communication partners ... 180 3.7.1.1.3 Retest analysis of CES question 2 (Participating in conversation with strangers in a quiet place) scores for participants with Parkinson’s disease ... 181 3.7.1.1.4 Retest analysis of CES question 2 (Participating in conversation with strangers in a quiet place) scores for primary communication partners ... 181 3.7.1.1.5 Retest analysis of CES question 3 (Conversing with a familiar person over the telephone) scores for participants with Parkinson’s disease ... 182 3.7.1.1.6 Retest analysis of CES question 3 (Conversing with a familiar person over the telephone) scores for primary communication partners ... 182 3.7.1.1.7 Retest analysis of CES question 4 (Conversing with a stranger over the telephone) scores for participants with Parkinson’s disease ... 183 3.7.1.1.8 Retest analysis of CES question 4 (Conversing with a stranger over the telephone) scores for primary communication partners ... 183 3.7.1.1.9 Retest analysis of CES question 5 (Being part of a conversation in a noisy environment (social gathering)) scores for participants with Parkinson’s disease….. ... 184 3.7.1.1.10 Retest analysis of CES question 5 scores (Being part of a conversation in a noisy environment (social gathering)) for primary communication
partners….. ... 184 3.7.1.1.11 Retest analysis of CES question 6 (Speaking to a friend when you are emotionally upset or you are angry) scores for participants with Parkinson’s disease….. ... 185 3.7.1.1.12 Retest analysis of CES question 6 (Speaking to a friend when you are emotionally upset or you are angry) scores for primary communication
partners…. ... 185 3.7.1.1.13 Retest analysis of CES question 7 (Having a conversation while
3.7.1.1.14 Retest analysis of CES question 7 (Having a conversation while
traveling in a care) scores for primary communication partners ... 186 3.7.1.1.15 Retest analysis of CES question 8 (Having a conversation with
someone at a distance (across a room)) scores for participants with Parkinson’s disease….. ... 187 3.7.1.1.16 Retest analysis of CES question 8 (Having a conversation with
someone at a distance (across a room)) scores for primary communication
partners….. ... 187 3.7.2 VAPP subsection scores ... 188 3.7.2.1 Retest analyses ... 197
3.7.2.1.1 Retest analysis of VAPP self-perceived voice problem scores for
participants with Parkinson’s disease ... 198 3.7.2.1.2 Retest analysis of VAPP self-perceived voice problem scores for
primary communication partners ... 198 3.7.2.1.3 Retest analysis of VAPP daily communication scores for participants with Parkinson’s disease ... 199 3.7.2.1.4 Retest analysis of VAPP daily communication scores for primary communication partners ... 199 3.7.2.1.5 Retest analysis of VAPP social communication scores for participants with Parkinson’s disease ... 200 3.7.2.1.6 Retest analysis of VAPP social communication scores for primary communication partners ... 200 3.7.2.1.7 Retest analysis of VAPP emotion scores for participants with
Parkinson’s disease ... 201 3.7.2.1.8 Retest analysis of VAPP emotion scores for primary communication partners 201
3.7.2.1.9 Retest analysis of VAPP activity limitation scores for participants with Parkinson’s disease ... 202 3.7.2.1.10 Retest analysis of VAPP activity limitation scores for primary
communication partners ... 202 3.7.2.1.11 Retest analysis of VAPP participation restriction scores for
3.7.2.1.12 Retest analysis of VAPP participation restriction scores for primary
communication partners ... 203
3.7.2.1.13 Retest analysis of VAPP total scores for participants with Parkinson’s disease 204 3.7.2.1.14 Retest analysis of VAPP total scores for primary communication partners 204 3.7.3 CPIB scores ... 205
3.7.3.1 Retest analyses ... 206
3.7.3.1.1 Retest analysis of CPIB scores for participants with Parkinson’s disease 206 3.7.3.1.2 Retest analysis of CPIB scores for primary communication partners 207 3.7.4 LSUS scores ... 207
3.7.4.1.1 Retest analysis of LSUS scores for participants with Parkinson’s disease 209 3.7.4.1.2 Retest analysis of LSUS scores for primary communication partners209 3.8 Statistical Analysis for Objective 7: Inter-Relationships Among Variables in Participants with Parkinson’s Disease ... 210
3.8.1 Speech intensity measures ... 217
3.8.2 Speech intelligibility measures ... 217
3.8.3 Communicative participation measures ... 217
3.8.4 Demographic and non-speech factors ... 218
3.9 Statistical Analysis for Objective 8: Inter-Relationships Among Self- and Proxy-Measures in participants with Parkinson’s Disease ... 219
3.9.1 Speech intensity measures ... 227
3.9.2 Speech intelligibility measures ... 227
3.9.3 Communicative participation measures ... 228
3.9.4 Demographic and non-speech factors ... 229
3.10 Statistical Analysis for Objective 9: Inter-Relationships Among Variables in Control Participants ... 230
3.10.1 Speech intensity measures ... 238
3.10.2 Speech intelligibility measures ... 238
3.10.3 Communicative participation measures ... 238
3.10.4 Demographic and non-speech factors ... 239
CHAPTER 4 ... 241
4.1 Objective 1: Speech Intensity ... 244
4.1.1 Habitual speech intensity ... 244
4.1.2 Maximum speech intensity ... 248
4.1.3 Lombard response function ... 250
4.1.4 Magnitude production ... 252
4.2 Objective 2: Typical Speech Loudness ... 254
4.3 Objective 3: Speech Intelligibility ... 257
4.3.1 SIT transcription scores ... 257
4.3.2 SIT VAS scores ... 260
4.3.3 VAS conversational intelligibility scores ... 262
4.4 Objective 4: Self-Rated Communicative Participation ... 266
4.4.1 Communicative Effectiveness Survey ... 266
4.4.2 Voice Activity and Participation Profile ... 269
4.4.3 Communicative Participation Item Bank ... 271
4.4.4 Level of Speech Usage Scale ... 272
4.5 Objective 5: Self- and Proxy-Rated Communicative Participation ... 274
4.5.1 Communicative Effectiveness Survey ... 274
4.5.2 Voice Activity and Participation Profile ... 276
4.5.3 Communicative Participation Item Bank ... 278
4.5.4 Level of Speech Usage Scale ... 279
4.6 Objective 7: Inter-Relationships Among Variables in Participants with Parkinson’s Disease ... 280
4.6.1 Speech intensity measures ... 280
4.6.2 Speech intelligibility measures ... 283
4.6.3 Communicative participation ... 283
4.6.4 Demographic and non-speech factors ... 286
4.7 Objective 8: Inter-Relationships Among Proxy-Measures in Participants with Parkinson’s Disease ... 288
4.7.1 Proxy-rated speech loudness measures ... 288
4.7.2 Speech intelligibility measures ... 289
4.7.3 Proxy-rated communicative participation ... 289
4.7.4 Demographic and non-speech factors ... 291
4.8 Objective 9: Inter-Relationships Among Variables in Control Participants ... 292
4.8.1 Speech intensity measures ... 292
4.8.2 Speech intelligibility measures ... 292
4.8.3 Communicative participation ... 292
4.8.4 Demographic and non-speech factors ... 294
4.9 Study Limitations ... 294
4.11 Clinical Implications ... 297
4.12 Summary and Conclusion ... 298
REFERENCES ... 304
APPENDICES ... 319
List of Tables
Table 1: Description of Demographic and Non-Speech Factors for Participants with
Parkinson’s Disease ... 33
Table 2: Description of Demographic and Non-Speech Factors for Control Participants 34
Table 3: Description of Demographic and Non-Speech Factors for Primary
Communication Partners of Participants with Parkinson's Disease ... 35
Table 4: Description of Diadochokinetic Rates (syllables/second) for Participants with
Parkinson's Disease Across All Three Visits ... 40
Table 5: Description of Voice Quality for Participants with Parkinson's Disease Across
All Three Visits ... 41
Table 6: Description of Diadochokinetic Rates (syllables/second) for Control Participants
Across all Three Visits ... 42
Table 7: Description of Voice Quality for Control Participants Across All Three Visits . 43
Table 8: Inter-Rater Reliability for Listeners Across Measures of Speech Intelligibility . 57
Table 9: Intra-Rater Reliability for Listeners Across Measures of Speech Intelligibility . 57
Table 10: Descriptive Statistics of Speech Intensity Measures for Participants with
Parkinson's Disease and Control Participants Across Visits 1, 2, and 3 ... 60
Table 11: Retest Analyses of Habitual Speech Intensity for Participants with Parkinson's
Disease and Control Participants Across Visits 1, 2, and 3 ... 62
Table 12: Retest Analyses of Maximum Speech Intensity for Participants with
Parkinson's Disease and Control Participants Across Visits 1, 2, and 3 ... 67
Table 13: Retest Analyses of Lombard Response Function for Participants with
Table 14: Retest Analyses of Magnitude Production for Participants with Parkinson's
Disease and Control Participants Across Visits 1, 2, and 3 ... 75
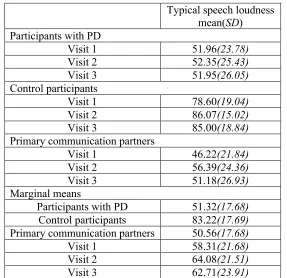
Table 15: Descriptive Statistics of Self- and Proxy-Rated Typical Speech Loudness for
Participants with Parkinson's Disease, Primary Communication Partners of Participants
with Parkinson's Disease, and Control Participants Across Visits 1, 2, and 3 ... 78
Table 16: Retest Analyses of Self- and Proxy-Rated Typical Speech Loudness for
Participants with Parkinson's Disease, Primary Communication Partners of Participants
with Parkinson's Disease, and Control Participants Across Visits 1, 2, and 3 ... 80
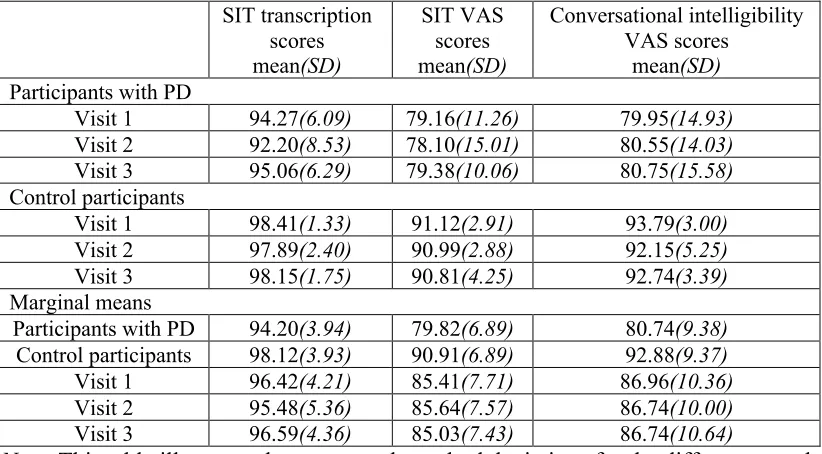
Table 17: Descriptive Statistics of Speech Intelligibility Measures for Participants with
Parkinson's Disease and Control Participants Across Visits 1, 2, and 3 ... 84
Table 18: Retest Analyses of Sentence Intelligibility Transcription Scores for Participants
with Parkinson's Disease and Control Participants Across Visits 1, 2, and 3 ... 86
Table 19: Retest Analyses of Speech Intelligibility Test Visual Analogue Scale Scores for
Participants with Parkinson's Disease and Control Participants Across Visits 1, 2, and 3 90
Table 20: Retest Analyses of Conversational Intelligibility Scores for Participants with
Parkinson's Disease and Control Participants Across Visits 1, 2, and 3 ... 94
Table 21: Descriptive Statistics of Self- and Proxy-Rated Individual Questions of the
Communication Effectiveness Survey for Participants with Parkinson's Disease, Primary
Communication Partners of Participants with Parkinson’s Disease, and Control
Participants Across Visits 1, 2, and 3 ... 98
Table 22: Multivariate Testing Analysis of Self-Rated Individual Questions of the
Communicative Effectiveness Survey for Participants with Parkinson's Disease and
Table 23: Univariate Testing Analysis of the Variability of Self-Rated Individual
Questions of the Communicative Effectiveness Survey for Participants with Parkinson’s
Disease and Control Participants Across Visits 1, 2, and 3 ... 109
Table 24: Retest Analyses of Communicative Effectiveness Survey Question 1 (Having a
Conversation with a Family Member or Friends at Home) for Participants with
Parkinson's Disease, Primary Communication Partners of Participants with Parkinson’s
Disease, and Control Participants Across Visits 1, 2, and 3 ... 110
Table 25: Retest Analyses of Communicative Effectiveness Survey Question 2
(Participating in Conversation with Strangers in a Quiet Place) for Participants with
Parkinson's Disease, Primary Communication Partners of Participants with Parkinson’s
Disease, and Control Participants Across Visits 1, 2, and 3 ... 113
Table 26: Retest Analyses of Communicative Effectiveness Survey Question 3
(Conversing with a Familiar Person over the Telephone) for Participants with Parkinson's
Disease, Primary Communication Partners of Participants with Parkinson’s Disease, and
Control Participants Across Visits 1, 2, and 3 ... 115
Table 27: Retest Analyses of Communicative Effectiveness Survey Question 4
(Conversing with a Stranger over the Telephone) for Participants with Parkinson's
Disease, Primary Communication Partners of Participants with Parkinson’s Disease, and
Control Participants Across Visits 1, 2, and 3 ... 117
Table 28: Retest Analyses of Communicative Effectiveness Survey Question 5 (Being
Part of a Conversation in a Noisy Environment (Social Gathering)) for Participants with
Parkinson's Disease, Primary Communication Partners of Participants with Parkinson’s
Table 29: Retest Analyses of Communicative Effectiveness Survey Question 6 (Speaking
to a Friend When You are Emotionally Upset or You are Angry) for Participants with
Parkinson's Disease, Primary Communication Partners of Participants with Parkinson’s
Disease, Control Participants Across Visits 1, 2, and 3 ... 122
Table 30: Retest Analyses of Communicative Effectiveness Survey Question 7 (Having a
Conversation While Traveling in a Car) for Participants with Parkinson's Disease,
Primary Communication Partners of Participants with Parkinson’s Disease, and Control
Participants Across Visits 1, 2, and 3 ... 124
Table 31: Retest Analyses of Communicative Effectiveness Survey Question 8 (Having a
Conversation with Someone at a Distance (Across a Room)) for Participants with
Parkinson's Disease, Primary Communication Partners of Participants with Parkinson’s
Disease, and Control Participants Across Visits 1, 2, and 3 ... 126
Table 32: Descriptive Statistics of Self- and Proxy-Rated Individual Subsections of the
Voice Activity and Participation Profile for Participants with Parkinson's Disease,
Primary Communication Partners of Participants with Parkinson’s Disease, and Control
Participants Across Visits 1, 2, and 3 ... 130
Table 33: Multivariate Testing Analysis of Self-Rated Individual Subsections of the
Voice Activity and Participation Profile for Participants with Parkinson's Disease and
Control Participants for Visits 1, 2, and 3 ... 131
Table 34: Univariate Testing Analysis of Self-Rated Individual Subsections of the Voice
Activity and Participation Profile for Participants with Parkinson's Disease and Control
Table 35: Retest Analyses of Voice Activity and Participation Profile Self-Perceived
Voice Problem Subsection Scores for Participants with Parkinson's Disease, Primary
Communication Partners of Participants with Parkinson’s Disease, and Control
Participants Across Visits 1, 2, and 3 ... 141
Table 36: Retest Analyses of Voice Activity and Participation Profile Daily
Communication Subsection Scores for Participants with Parkinson's Disease, Primary
Communication Partners of Participants with Parkinson’s Disease, and Control Partners
Across Visits 1, 2, and 3 ... 144
Table 37: Retest Analyses of Voice Activity and Participation Profile Social
Communication Subsection Scores for Participants with Parkinson's Disease, Primary
Communication Partners of Participants with Parkinson’s Disease, and Control
Participants Across Visits 1, 2, and 3 ... 146
Table 38: Retest Analyses of Voice Activity and Participation Profile Emotion
Subsection Scores for Participants with Parkinson's Disease, Primary Communication
Partners of Participants with Parkinson’s Disease, and Control Participants Across Visits
1, 2, and 3 ... 149
Table 39: Retest Analyses of Voice Activity and Participation Profile Activity Limitation
Subsection Scores for Participants with Parkinson's Disease, Primary Communication
Partners of Participants with Parkinson’s Disease, and Control Participants Across Visits
1, 2, and 3 ... 151
Table 40: Retest Analyses of Voice Activity and Participation Profile Participation
Communication Partners of Participants with Parkinson’s Disease, and Control
Participants Across Visits 1, 2, and 3 ... 153
Table 41: Retest Analyses of Voice Activity and Participation Profile Total Subsection
Scores for Participants with Parkinson's Disease, Primary Communication Partners of
Participants with Parkinson’s Disease, and Control Participants Across Visits 1, 2, and 3
... 156
Table 42: Descriptive Statistics of Self- and Proxy-Rated Communicative Participation
Item Bank for Participants with Parkinson's Disease, Primary Communication Partners of
Participants with Parkinson’s Disease, and Control Participants Across Visits 1, 2, and 3
... 159
Table 43: Retest Analyses of Communicative Participation Item Bank Scores for
Participants with Parkinson's Disease, Primary Communication Partners of Participants
with Parkinson’s Disease, and Control Participants Across Visits 1, 2, and 3 ... 161
Table 44: Descriptive Statistics of Self- and Proxy-Rated Level of Speech Usage Scale
for Participants with Parkinson's Disease, Primary Communication Partners of
Participants with Parkinson’s Disease, and Control Participants Across Visits 1, 2, and 3
... 164
Table 45: Retest Analyses of Level of Speech Usage Scale for Participants with
Parkinson's Disease, Primary Communication Partners of Participants with Parkinson’s
Disease, and Control Participants Across Visits 1, 2, and 3 ... 166
Table 46: Multivariate Testing Analysis of the Variability of Self-Rated Individual
Disease and Primary Communication Partners of Participants with Parkinson’s Disease
Across Visits 1, 2, and 3 ... 169
Table 47: Univariate Testing Analysis of the Variability of Self-Rated Individual
Questions of the Communicative Effectiveness Survey for Participants with Parkinson's
Disease and Primary Communication Partners of Participants with Parkinson’s Disease
Across Visits 1, 2, and 3 ... 171
Table 48: Multivariate Testing Analysis of the Variability of Self-Rated Individual
Subsections of the Voice Activity and Participation Profile for Participants with
Parkinson's Disease and Primary Communication Partners of Participants with
Parkinson’s Disease Across Visits 1, 2, and 3 ... 189
Table 49: Univariate Testing Analysis of the Variability of Self-Rated Individual
Subsections of the Voice Activity and Participation Profile for Participants with
Parkinson's Disease and Primary Communication Partners of Participants with
Parkinson’s Disease Across Visits 1, 2, and 3 ... 190
Table 50: Correlations of Speech Intensity Measures, Speech Intelligibility Measures,
Communicative Participation Measures, Demographic Factors, and Non-Speech Factors
for Participants with Parkinson's Disease for Visit 1 ... 211
Table 51: Correlations of Speech Intensity Measures, Speech Intelligibility Measures,
Communicative Participation Measures, Demographic Factors, and Non-Speech Factors
for Participants with Parkinson's Disease for Visit 2 ... 213
Table 52: Correlations of Speech Intensity Measures, Speech Intelligibility Measures,
Communicative Participation Measures, Demographic Factors, and Non-Speech Factors
Table 53: Descriptive Statistics of Demographic and Non-Speech Factors for Participants
with Parkinson's Disease and Control Participants ... 219
Table 54: Correlations of Speech Intensity Measures, Speech Intelligibility Measures,
Proxy-Rated Communicative Participation Measures, Demographic Factors, and
Non-Speech Factors for Participants with Parkinson's Disease for Visit 1 ... 221
Table 55: Correlations of Speech Intensity Measures, Speech Intelligibility Measures,
Proxy-Rated Communicative Participation Measures, Demographic Factors, and
Non-Speech Factors for Participants with Parkinson's Disease for Visit 2 ... 223
Table 56: Correlations of Speech Intensity Measures, Speech Intelligibility Measures,
Proxy-Rated Communicative Participation Measures, Demographic Factors, and
Non-Speech Factors for Participants with Parkinson's Disease for Visit 3 ... 225
Table 57: Correlations of Speech Intensity Measures, Speech Intelligibility Measures,
Communicative Participation Measures, Demographic Factors, and Non-Speech Factors
for Control Participants for Visit 1 ... 232
Table 58: Correlations of Speech Intensity Measures, Speech Intelligibility Measures,
Communicative Participation Measures, Demographic Factors, and Non-Speech Factors
for Control Participants for Visit 2 ... 234
Table 59: Correlations of Speech Intensity Measures, Speech Intelligibility Measures,
Communicative Participation Measures, Demographic Factors, and Non-Speech Factors
List of Figures
Figure 1: Means of Habitual Speech Intensity for Participants with Parkinson's Disease
and Control Participants Across Visits 1, 2, and 3 ... 61
Figure 2: Means of Maximum Speech Intensity for Participants with Parkinson's Disease
and Control Participants Across Visits 1, 2, and 3 ... 66
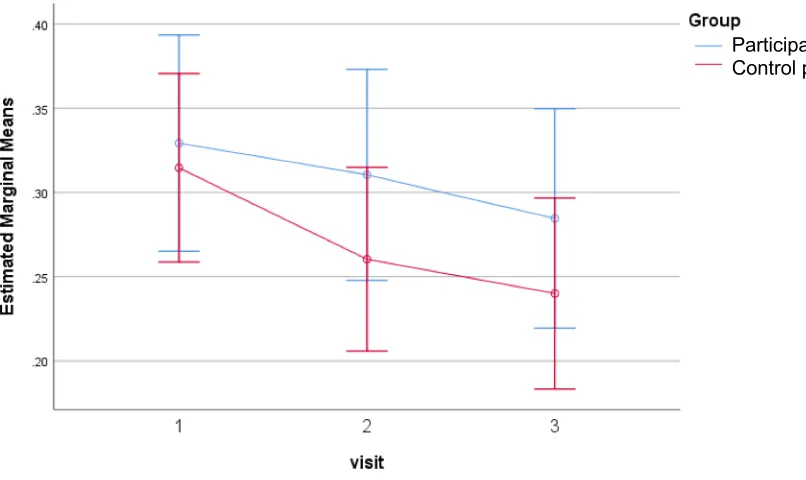
Figure 3: Means of Lombard Response Function for Participants with Parkinson's
Disease and Control Participants Across Visits 1, 2, and 3 ... 70
Figure 4: Means of Magnitude Production for Participants with Parkinson's Disease and
Control Participants Across Visits 1, 2, and 3 ... 74
Figure 5: Means of Typical Speech Loudness Perceptions by Participants with
Parkinson's Disease, Primary Communication Partners of Participants with Parkinson's
Disease, and Control Participants Across Visits 1, 2, and 3 ... 79
Figure 6: Means of Speech Intelligibility Test Transcription Scores for Participants with
Parkinson's Disease and Control Participants Across Visits 1, 2, and 3 ... 85
Figure 7: Means of Speech Intelligibility Test Visual Analogues Scale Scores for
Participants with Parkinson's Disease and Control Participants Across Visits 1, 2, and 3 89
Figure 8: Means of Conversational Intelligibility Scores for Participants with Parkinson's
Disease and Control Participants Across Visits 1, 2, and 3 ... 93
Figure 9: Means of Communicative Effectiveness Survey Question 1 (Having a
Conversation with a Family Member or Friends at Home) Scores for Participants with
Figure 10: Means of Communicative Effectiveness Survey Question 2 (Participating in
Conversation with Strangers in a Quiet Place) Scores for Participants with Parkinson's
Disease and Control Participants Across Visits 1, 2, and 3 ... 102
Figure 11: Means of Communicative Effectiveness Survey Question 3 (Conversing with
a Familiar Person over the Telephone) Scores for Participants with Parkinson's Disease
and Control Participants Across Visits 1, 2, and 3 ... 103
Figure 12: Means of Communicative Effectiveness Survey Question 4 (Conversing with
a Stranger over the Telephone) Scores for Participants with Parkinson's Disease and
Control Participants Across Visits 1, 2, and 3 ... 104
Figure 13: Means of Communicative Effectiveness Survey Question 5 (Being Part of a
Conversation in a Noisy Environment (Social Gathering)) Scores for Participants with
Parkinson's Disease and Control Participants Across Visits 1, 2, and 3 ... 105
Figure 14: Means of Communicative Effectiveness Survey Question 6 (Speaking to a
Friend When You are Emotionally Upset or You are Angry) Scores for Participants with
Parkinson's Disease and Control Participants Across Visits 1, 2, and 3 ... 106
Figure 15: Means of Communicative Effectiveness Survey Question 7 (Having a
Conversation While Traveling in a Car) Scores for Participants with Parkinson's Disease
and Control Participants Across Visits 1, 2, and 3 ... 107
Figure 16: Means of Communicative Effectiveness Survey Question 8 (Having a
Conversation with Someone at a Distance (Across a Room)) Scores for Participants with
Figure 17: Means of Voice Activity and Participation Profile Self-Perceived Voice
Problem Subsection Scores for Participants with Parkinson's Disease and Control
Participants Across Visits 1, 2, and 3 ... 133
Figure 18: Means of Voice Activity and Participation Profile Daily Communication
Subsection Scores for Participants with Parkinson's Disease and Control Participants
Across Visits 1, 2, and 3 ... 134
Figure 19: Means of Voice Activity and Participation Profile Social Communication
Subsection Scores for Participants with Parkinson's Disease and Control Participants
Across Visits 1, 2, and 3 ... 135
Figure 20: Means of Voice Activity and Participation Profile Emotion Subsection Scores
for Participants with Parkinson's Disease and Control Participants Across Visits 1, 2, and
3 ... 136
Figure 21: Means of Voice Activity and Participation Profile Activity Limitation
Subsection Scores for Participants with Parkinson's Disease and Control Participants
Across Visits 1, 2, and 3 ... 137
Figure 22: Means of Voice Activity and Participation Profile Participation Restriction
Subsection Scores for Participants with Parkinson's Disease and Control Participants
Across Visits 1, 2, and 3 ... 138
Figure 23: Means of Voice Activity and Participation Profile Total Subsection Scores for
Participants with Parkinson's Disease and Control Participants Across Visits 1, 2, and 3
... 139
Figure 24: Means of Communicative Participation Item Bank Scores for Participants with
Figure 25: Means of Level of Speech Usage Scale Scores for Participants with
Parkinson's Disease and Control Participants Across Visits 1, 2, and 3 ... 165
Figure 26: Means of Communicative Effectiveness Survey Question 1 (Having a
Conversation with a Family Member or Friends at Home) scores for Participants with
Parkinson's Disease and Primary Communication Partners of Participants with
Parkinson’s Disease Across Visits 1, 2, and 3 ... 172
Figure 27: Means of Communicative Effectiveness Survey Question 2 (Participating in
Conversation with Strangers in a Quiet Place) Scores for Participants with Parkinson's
Disease and Primary Communication Partners of Participants with Parkinson’s Disease
Across Visits 1, 2, and 3 ... 173
Figure 28: Means of Communicative Effectiveness Survey Question 3 (Conversing with
a Familiar Person over the Telephone) Scores for Participants with Parkinson's Disease
and Primary Communication Partners of Participants with Parkinson’s Disease Across
Visits 1, 2, and 3 ... 174
Figure 29: Means of Communicative Effectiveness Survey Question 4 (Conversing with
a Stranger over the Telephone) Scores for Participants with Parkinson's Disease and
Primary Communication Partners of Participants with Parkinson’s Disease Across Visits
1, 2, and 3 ... 175
Figure 30: Means of Communicative Effectiveness Survey Question 5 (Being Part of a
Conversation in a Noisy Environment (Social Gathering)) Scores for Participants with
Parkinson's Disease and Primary Communication Partners of Participants with
Figure 31: Means of Communicative Effectiveness Survey Question 6 (Speaking to a
Friend When You are Emotionally Upset or You are Angry) Scores for Participant with
Parkinson's Disease and Primary Communication Partners of Participants with
Parkinson’s Disease Across Visits 1, 2, and 3 ... 177
Figure 32: Means of Communicative Effectiveness Survey Question 7 (Having a
Conversation While Traveling in a Car) Scores for Participants with Parkinson's Disease
and Primary Communication Partners of Participants with Parkinson’s Disease Across
Visits 1, 2, 3 ... 178
Figure 33: Means of Communicative Effectiveness Survey Question 8 (Having a
Conversation with Someone at a Distance (Across a Room)) Scores for Participants with
Parkinson's Disease and Primary Communication Partners of Participants with
Parkinson’s Disease Across Visits 1, 2, and 3 ... 179
Figure 34: Means of Voice Activity and Participation Profile Self-Perceived Voice
Problem Subsection Scores for Participants with Parkinson's Disease and Primary
Communication Partners of Participants with Parkinson’s Disease Across Visits 1, 2, and
3 ... 191
Figure 35: Means of Voice Activity and Participation Profile Daily Communication
Subsection Scores for Participants with Parkinson's Disease and Primary Communication
Partners of Participants with Parkinson’s Disease Across Visits 1, 2, and 3 ... 192
Figure 36: Means of Voice Activity and Participation Profile Social Communication
Subsection Scores for Participants with Parkinson's Disease and Primary Communication
Figure 37: Means of Voice Activity and Participation Profile Emotion Subsection Scores
for Participants with Parkinson's Disease and Primary Communication Partners of
Participants with Parkinson’s Disease Across Visits 1, 2, and 3 ... 194
Figure 38: Means of Voice Activity and Participation Profile Activity Limitation
Subsection Scores for Participants with Parkinson's Disease and Primary Communication
Partners of Participants with Parkinson’s Disease Across Visits 1, 2, and 3 ... 195
Figure 39: Means of Voice Activity and Participation Profile Participation Restriction
Subsection Scores for Participants with Parkinson's Disease and Primary Communication
Partners of Participants with Parkinson’s Disease Across Visits 1, 2, and 3 ... 196
Figure 40: Means of Voice Activity and Participation Profile Total Subsection Scores for
Participants with Parkinson's Disease and Primary Communication Partners of
Participants with Parkinson’s Disease Across Visits 1, 2, and 3 ... 197
Figure 41: Means of Communicative Participation Item Bank Scores for Participants with
Parkinson's Disease and Primary Communication Partners of Participants with
Parkinson’s Disease Across Visits 1, 2, and 3 ... 206
Figure 42: Means of Level of Speech Usage Scale Scores for Participants with
Parkinson's Disease and Primary Communication Partners of Participants with
List of Appendices
Appendix A: Geriatric Depression Scale - 15-Item Short Form ... 319
Appendix B: Medication Effectiveness Scale ... 320
Appendix C: Typical Speech Loudness ... 321
Appendix D: Communication Effectiveness Survey ... 322
Appendix E: Voice Activity and Participation Profile ... 323
Appendix F: Communication Participation Item Bank ... 326
Appendix G: Level of Speech Usage Scale ... 327
Appendix H: Letter of Information for Participants with Parkinson's Disease ... 328
Appendix I: Consent Form for Participants with Parkinson's Disease ... 333
Appendix J: Letter of Information for Control Participants ... 334
Appendix K: Consent Form for Control Participants ... 339
Appendix L: Letter of Information for Primary Communication Partners of Participants
with Parkinson's Disease ... 340
Appendix M: Consent Form for Primary Communication Partners of Participants with
Parkinson's Disease ... 345
Appendix N: Letter of Information for Listeners ... 346
Appendix O: Consent Form for Listeners ... 350
List of Acronyms
PD Parkinson’s diseaseIWPD Individuals with Parkinson’s disease
dB Decibels
SPL Sound pressure level
LSVT Lee Silverman Voice Treatment SIT Sentence Intelligibility Test WHO World Health Organization
ICF International Classification of Functioning, Disability, and Health PRO Patient-reported outcome measures
CPIB Communicative Participation Item Bank VAPP Voice Activity and Participation Profile CES Communicative Effectiveness Survey UPDRS Unified Parkinson’s Disease Rating Scale LSUS Level of Speech Usage Scale
HL Hearing level
Hz Hertz
MOCA Montreal Cognitive Assessment
GDS-15 Geriatric Depression Scale – short form MES Medication Effectiveness Scale
m Meters
cm Centimeters
kHz Kilohertz
TLS Typical Loudness Scale VAS Visual analogue scale
CETI-M Communicative Effectiveness Index – Modified CETI Communicative Effectiveness Index
ANOVA Analysis of variance
SEM Standard error of measurement CR Repeatability coefficient
ICC Interclass correlations
SRD% Smallest real difference percentage MANOVA Multivariate analysis of variance MDD Minimum detectable difference VHI Voice Handicap Index
Chapter 1
1
Introduction
Parkinson’s disease (PD) is a progressive neurodegenerative disease that typically affects individuals between the ages of 60 and 70 years (Adams & Jog, 2009). The hallmark motor features of PD: tremor, bradykinesia, rigidity, and postural instability, typically appear once 50 – 60% and 80% of dopamine has been depleted in the substantia nigra, and striatum, respectively (Duffy, 2013; Sapir, 2014; Schneider & Obeso, 2014; Wirdefeldt, Adami, Cole, Trichopoulos, & Mandel, 2011). The degeneration of
dopaminergic pathways can also result in speech difficulties (Duffy, 2013; Sapir, 2014).
Over the course of the disease, approximately 70 – 90% of individuals with PD (IWPD) will develop a variety of speech impairments, collectively referred to as hypokinetic dysarthria (Sapir, 2014). Darley, Aronson, and Brown (1969a; 1969b) coined the term hypokinetic dysarthria in order to describe the most common characteristics of
Parkinsonian speech. The distinctive features of hypokinetic dysarthria include monopitch, reduced stress, monoloudness, reduced loudness, imprecise consonants, inappropriate silences, short rushes of speech, harsh voice, breathiness, low pitch, and variable rates of speech (Darley et al., 1969a; 1969b; Duffy, 2013). While it is unlikely for any one IWPD to express all of the above described speech features, there is a variety in symptom manifestation, suggesting heterogeneity in the dysarthric profiles of IWPD (Duffy, 2013).
1.1 Hypophonia and Parkinson’s Disease
Hypophonia, or reduced speech intensity, is a commonly treated and highly debilitating speech feature of Parkinsonian speech, affecting an estimated 50% of IWPD (Adams, Dykstra, Abrams, Winnell, Jenkins, & Jog, 2006a; Adams, Dykstra, Jenkins, & Jog, 2008; Adams, Haralabous, Dykstra, Abrams, & Jog, 2005; Adams, Moon, Dykstra, Abrams, Jenkins, & Jog, 2006b; Dykstra, Adams, & Jog, 2012a). Additionally,
speakers consider hypophonia, along with other aspects of their speech impairments, to be among the most devastating of their PD-related symptoms (Berke, Gerratt, Kreiman, & Jackson, 1999). Challenges frequently experienced by individuals with hypophonia include difficulty being heard in social settings, and numerous requests from
communication partners to speak louder and to repeat themselves (Adams et al., 2006a; Adams et al., 2006b; Dykstra et al., 2012a).
Hypophonia can also have a negative impact on the acoustics of an individual’s speech production (Kwan & Whitehill, 2011; Tjaden, Richards, Kuo, Wilding, & Sussman, 2013). Judgements pertaining to the severity of an individual’s hypophonia may be made via acoustic measures, including but not limited to habitual speech intensity, intensity decay, and intensity variability (Adams, Winnell, & Jog, 2010; Ho, Iansek, & Bradshaw, 2001; McCaig, Adams, Dykstra, & Jog, 2016; Rosen, Kent, Delaney, & Duffy, 2006; Rosen, Kent, & Duffy, 2005;).
The habitual speech intensity of individuals with hypophonia and PD is typically reduced by 2 – 5 decibels (dB) sound pressure level (SPL) compared to healthy speakers (Adams et al., 2010). This difference can be quite dramatic, as a reduction of 4 dB SPL in speech intensity is equivalent to a 40% decrease in the perceived loudness level (McCaig et al., 2016). Intensity decay is defined as the declination of an individual’s speech intensity (Ho et al., 2001; Rosen et al., 2005). Intensity decay can be calculated by examining the average and peak intensity of a syllable or prolonged vowel, as well by examining the intensity contour of a sentence or conversation (Rosen et al., 2005). Furthermore, the rate and amount of intensity declination can be observed (Ho et al., 2001; Rosen, et al., 2005). To some extent, intensity decay naturally occurs in speech tasks, such as at the end of declarative sentences (Rosen et al., 2005). However, individuals with hypophonia and PD have demonstrated a larger declination in intensity than control participants in vowel prolongation and syllable repetition, but not in conversational tasks, and with inconsistent results for sentence reading tasks (Ho et al., 2001; Rosen et al., 2005). It has been
suggested that neurological differences are present in speech and non-speech motor tasks (Kent, 2004). These differences may include the complex and unique musculature
and laryngeal muscles as compared to skeletal muscles, and the effects of medical intervention. The task-specific intensity decay reported by Rosen and colleagues (2005) may suggest that declination is the result of the interference between sub-processes required for the tasks described by Kent (2004), in addition to task demands or goals. Intensity variability is the standard deviation observed in the intensity contour of an utterance (Rosen et al., 2006). While intensity variability is typically observed during conversational speech, the proportion of variability appears to differ in IWPD and healthy speakers (Rosen et al., 2006). Rosen and colleagues (2006) found that overall intensity variability was reduced in IWPD compared to control participants during sentence and conversational tasks, at levels of 5.4 dB SPL and 6.5 dB SPL, respectively. Additionally, the speech intensity range of individuals with hypophonia may also be reduced (Adams & Dykstra, 2009; Darley et al., 1969a; 1969b; Darley, Aronson, & Brown,1975). Decreased intensity variability in conjunction with reduced speech intensity range may contribute to the perception of monoloudness in the speech of IWPD (Adams & Dykstra, 2009; Darley et al., 1969a; 1969b; 1975). While there are numerous methods to assess an individual’s speech intensity, the mechanisms that regulate speech intensity in IWPD are poorly understood.
1.2 Regulation of Speech Intensity in Hypophonia and
Parkinson’s Disease
hypothesized to be the underlying cause of speech impairments such as hypophonia in IWPD (Ho et al., 1999b).
The basal ganglia are dopamine-modulated subcortical structures that are impacted in PD (Sapir, 2014). The dopamine depletion observed in PD affects all of the structures
comprising the basal ganglia, particularly the globus pallidus, subthalamic nucleus, substantia nigra, and striatum; the latter of which is composed of the caudate nucleus and putamen (Sapir, 2014). While it has been demonstrated that a reduction of dopamine within these structures results in the classic motor symptoms associated with PD, it has been suggested that basal ganglia pathology and direct cortico-striatal pathways
connecting the ipsilateral caudate nucleus to the dorsolateral prefrontal cortex can be attributed to the development of hypokinetic dysarthria symptoms associated with PD, including hypophonia, (Arnold et al., 2014; Sapir, 2014). However, several studies suggest that the presentation of hypokinetic dysarthria may also be related to pathologies in non-dopaminergic structures and pathways at earlier stages of PD development (Braak et al., 2004; Sapir, 2014). Several of these key neural structures, such as the striatum, are involved in motor and sensory activities, as well as sensorimotor integration (Conte et al., 2013; Kempler & Van Lancker, 2002). These functions include the regulation of muscle tone, coordinating and stabilizing the body during voluntary movements, scaling the force, amplitude, and duration of movements, adapting movements to suit the environment, as well as play a role in learning, planning, and initiating movements (Duffy, 2013). Therefore, it has been hypothesized that the presentation of hypophonia may be causally related to a sensorimotor integration deficit in IWPD (Clark et al., 2014; Ho, Bradshaw, & Iansek, 2000).
1.2.1 Speech intensity in hypophonia and Parkinson’s
disease
As discussed previously, differences in the habitual speech intensity of individuals with hypophonia compared to healthy speakers can be quite dramatic (Adams et al., 2010; McCaig et al., 2016). In addition, hypophonia may be assessed via several acoustic measures, including habitual speech intensity, intensity decay, and intensity variability (Adams et al., 2010; Ho et al., 2001; McCaig et al., 2016; Rosen et al., 2006; Rosen et al., 2005). However, anecdotal evidence suggests that IWPD and hypophonia may
experience a range in their day-to-day speech intensity. Little is known about the natural variability of individuals’ speech in everyday situations. While many studies have examined the day-to-day speech behaviours of teachers (Astolfi et al., 2012; Astolfi, Puglisi, Pavese, & Carullo, 2014; Bottalico, & Astolfi, 2012; Franca, 2013; Schmidt, Andrews, & McCutcheon, 1998), few studies have examined speech patterns and behaviours in individuals with speech and voice disorders (Fox & Ramig, 1997; Ramig, Sapir, Fox, & Countryman, 2001; Sapir, Spielman, Ramig, Story, & Fox, 2007;
Schalling, Gustafsson, Ternström, Bulukin Wilén, & Södersten, 2013). A study by Schalling and colleagues (2013) tracked daily voice use over three weeks in six IWPD and hypophonia. Participants wore a VoxLog which recorded their speech intensity and the general noise level. A range of 11 dB was observed over the course of three weeks, which may demonstrate a potential for a substantial degree of day-to-day variation and individual differences in a population of IWPD and hypophonia.
The previously described study by Schalling and colleagues (2013) appears to be the only published study to have examined the long-term daily speech behaviours of individuals with hypophonia and PD. However, several other studies have explored the variations of speech intensity and self-perceptions of communication in IWPD and hypophonia (Fox & Ramig, 1997; Ramig et al., 2001; Sapir et al., 2007). Ramig and colleagues (2001)
group, twice immediately following the completion of LSVT, and twice six months following the completion of LSVT. The results demonstrated that the speech intensity of participants not receiving treatment remained relatively consistent across all speech tasks at each of the three time points, with mean intensity ranging from 69.3 – 71.9 dB, across all time points and speech tasks.
Similarly, Sapir and colleagues (2007) sought to explore the impact of LSVT on the articulation and intensity of vowels in IWPD and dysarthria. Fourteen IWPD who received LSVT, 15 IWPD who did not receive speech treatment, and 14 control
participants were audio recorded while reading three different phrases during each visit in order to obtain speech intensity levels for each of the vowels /i/, /u/, and /a/. Speech recordings were collected for all participants on three different days prior to LSVT onset, as well as on two different days following the completion of LSVT. The average speech intensity for these vowels of the IWPD who received treatment ranged from 72.6 – 73.6 dB, in the pre- and post-LSVT conditions. Non-significant differences were also observed between pre- and post-LSVT values for the IWPD who did not receive treatment.
Fox and Ramig (1997) examined the speech intensity of 15 male and 15 female IWPD and dysarthria, and seven male and seven female control participants. Participants attended three visits during a four-day period, wherein they completed four speech tasks at every visit. The results demonstrated that the speech intensity differences among all four groups were statistically different from one another. It was also reported that the speech intensity of IWPD was 2 – 4 dB lower than that of control participants.
Additionally, the IWPD demonstrated a smaller variability of speech intensity compared to control participants, as demonstrated by their smaller standard deviations.
It is important to note that the above-mentioned studies reported the range and standard deviations of speech intensity measures for their participants. (Fox & Ramig, 1997; Sapir et al., 2007; Schalling et al. 2013). However, measurements such as interclass
correlations (ICC) and coefficients of repeatability (CR) would provide greater information. ICC are used to assess the correlation between multiple sets of
average change of a group mean over time (Vaz, Falkmer, Passmore, Parsons, & Andreou, 2013). The CR, also referred to as the Smallest Real Difference and the
Minimal Detectable Difference (Beckerman et al., 2001; Furlan & Sterr, 2018; Steffen & Seney, 2008), is the value below which the absolute differences between two
measurements would lie with 0.95 probability (Vaz, et al., 2013). In other words,
difference values above the CR would reflect 95% probability of a true level of change as opposed to a difference that may simply be due to measurement error. It is also suggested that CR reflects the minimal detectable true level of change of an outcome measure. Examining the retest reliability and repeatability of speech intensity in IWPD and hypophonia via ICC and CR may provide valuable insight into the variability of the measure.
1.2.2 The effect of background noise on speech intensity
in hypophonia and Parkinson’s disease
The Lombard effect is described as an involuntary and reflexive increase in speech intensity in the presence of background noise (Brumm & Zollinger, 2011; Garnier & Henrich, 2014). This reflex serves to monitor and adjust one’s speech intensity as needed in order to ensure appropriate speech intensity levels with communication partners in the presence of background noise (Brumm & Zollinger, 2011; Dykstra et al., 2012a). The Lombard effect is present in individuals with hypophonia and PD, as well as healthy individuals without neurological disease (Adams & Lang, 1992; Adams et al., 2005; Stathopoulos et al., 2014).
A similar study by Stathopoulos and colleagues (2014) examined responses to the Lombard effect in 33 IWPD during a speech task. The intensity level of the background noise presented to participants increased until participants’ speech intensities were an average of 3 dB SPL higher than their habitual speech intensity. The manipulation resulted in 79% of participants with PD speaking with increased speech intensity in the presence of background noise. The authors did not report any data regarding the intensity level of background noise presented. However, it is possible that the manipulation of the level of background noise by Stathopoulos and colleagues (2014) for each participant to achieve a similar increase in speech intensity is related to the individual variability in the Lombard response previously discussed by Adams and Lang (1992).
While several studies have examined the Lombard effect in individuals with hypophonia and PD (Adams et al., 2006a; Adams et al. 2005; Adams & Lang, 1992; Dykstra et al., 2012a; Ho, Bradshaw, Iansek, & Alfredson, 1999a; Stathopoulos et al., 2014), few studies have attempted to delineate potential relationships among speech intensity and different intensity levels (i.e., ranging from 50-90 dB) and types (i.e., pink, instrumental music, and multi-talker) of background noise presented (Adams et al. 2006a; Adams et al., 2005; Adams & Lang, 1992). Adams and colleagues (2005) investigated whether such a relationship between speech intensity and type of background noise existed by having 10 individuals with hypophonia and PD and 10 control participants repeat
sentences in five multi-talker background noise conditions. These researchers found that a Lombard response was elicited in both experimental groups, however IWPD
consistently produced speech intensity levels that were 2 – 3 dB SPL lower than control participants across all background noise conditions. In 2006a, Adams and colleagues sought to investigate the effect of different types of background noise on speech intensity. In their study, 23 IWPD and hypophonia and 15 control participants conversed for two minutes in the presence of three types of background noise (i.e., multi-talker noise, instrumental music, and pink noise), each presented at five different intensity levels. Both groups of participants demonstrated the Lombard sign, however the speech intensity levels of IWPD was on average 3 – 5 dB SPL lower than that of their healthy
observed with pink noise and multi-talker noise when presented at specific intensity levels. The speech intensity of IWPD was 0.66 dB SPL higher in the presence of 70 dB SPL of multi-talker noise, as compared to 70 dB SPL of pink noise. The speech intensity of control participants was 0.69 dB SPL higher in the presence of 70 dB SPL of multi-talker noise, compared to 70 dB SPL of pink noise. The speech intensity of control participants was also 0.74 dB SPL higher in the presence of 55 dB SPL of multi-talker noise, compared to 55 dB SPL of pink noise. These results support the findings of Adams and colleagues (2005) and suggest that the relationship between speech intensity and background noise for individuals with hypophonia and PD is similar, but attenuated, in comparison to the response of control participants. Additionally, the results of Adams and Lang (1992) may suggest that multi-talker background noise, compared to pink noise or instrumental music, may be more beneficial in eliciting a Lombard response in IWPD and healthy individuals without neurological impairment.
Dykstra and colleagues (2012a) investigated maximum intensity, habitual intensity, and the effect of various intensity levels of background noise (ranging from 50 – 70 dB SPL) on the conversational speech intensity of 30 individuals with hypophonia and 15 control participants. Participants with PD demonstrated reduced maximum intensity of
approximately 10 dB SPL compared to control participants. Participants with PD demonstrated reduced habitual intensity of approximately 5 dB compared to control participants. Both groups of participants demonstrated a Lombard response during the conversational speech task. However, the conversational speech intensity levels of IWPD were reduced by approximately 5 dB across noise conditions. The conversational
intensity response pattern in IWPD was parallel, but attenuated, compared to the response pattern of control participants. The findings from this study further support the previously identified parallel but attenuated Lombard effect (Adams et al., 2006a; Adams et al., 2005) in individuals with hypophonia and PD compared to control participants.
of IWPD parallels that of control participants regardless of the type of noise used to elicit the Lombard effect.
Additionally, noise may play multiple roles in communication in individuals with hypophonia and PD. In addition to increasing speech intensity, background noise may also influence listener perceptions of hypophonia severity, and potentially introduce communication challenges, such as reducing the speech intelligibility (Adams et al., 2008; Dykstra, Adams, & Jog, 2012b) and communicative participation (Baylor, Burns, Eadie, Britton, & Yorkston, 2011) of individuals with hypophonia.
1.3 Loudness Perception in Hypophonia and Parkinson’s
Disease
Individuals with hypophonia and PD may be unaware of their reduced speech loudness level (Adams & Dykstra, 2009; Clark et al., 2014; Fox & Ramig, 1997; Ho et al., 2000; Huber, Stathopoulos, Ramig, & Lancaster, 2003). Individuals with hypophonia are frequently requested by communication partners to speak louder and to repeat themselves (Dykstra et al., 2012a). A number of studies have explored loudness perception in this population (Clark et al., 2014; Fox & Ramig, 1997; Ho et al., 2000).
Ho and colleagues (2000) examined the ability of 15 individuals with hypophonia and PD and 15 control participants to perceive the loudness level of their own speech production. Participants were audio-recorded using their soft, normal, and loud voice while
completing a reading task, and while engaged in conversation. Participants then adjusted a volume control knob to indicate the loudness level at which they had just spoken. These volume adjustments were completed twice: immediately following each speech
production, and after replaying the recorded sample. The authors found that IWPD significantly over-estimated their spoken loudness levels during both reading and conversational tasks compared to control participants. These observed discrepancies between perceived and produced speech intensity levels may suggest impaired
sensorimotor integration deficits in individuals with hypophonia and PD (Ho et al., 2000).