Recognizing personal characteristics of readers
using eye-movements and text features
Pascual Martínez-Gómez
1,2Tadayoshi Hara
2Akiko Aizawa
1,2 (1) The University of Tokyo(2) National Institute of Informatics {pascual, harasan, aizawa}@nii.ac.jp
A
BSTRACTIn the present work we raise the hypothesis that eye-movements when reading texts reveal task performance, as measured by the level of understanding of the reader. With the objective of testing that hypothesis, we introduce a framework to integrate geometric information of eye-movements and text layout into natural language processing models via image processing techniques. We evidence the patterns in reading behavior between subjects with similar task performance using principal component analysis and quantify the likelihood of our hypothesis using the concept of linear separability. Finally, we point to potential applications that could benefit from these findings.
K
EYWORDS:
eye-tracking, natural language processing, image recognition.T
ITLE ANDA
BSTRACT INJ
APANESE視
視
視
線
線
線
の
の
の
動
動
動
き
き
きと
と
と
テ
テ
テキ
キ
キス
ス
スト
ト
ト
素
素
素
性
性
性
を
を
を
用
用
用
い
い
いた
た
た
読
読
読
み
み
み
手
手
手
の
の
の
個
個
個性
性
性
認
認
認
識
識
識
本研究では、テキストを読む際の視線の動きから、テキストの理解度によって測定され るような読み手のタスクパフォーマンスが予測可能である、という仮説を立てる。この
仮説を検証するため、我々はまず、画像処理技術を介して、視線の動きとテキスト配置 に関する位置情報を、自然言語処理のモデルとして統合する枠組を導入する。次に我々
は、近いタスクパフォーマンスの被験者間に共通した読解行動のパターンを主成分分析
によって同定し、この線形分離可能性を求めることで我々の仮説の蓋然性を定量的に示
す。最後に、我々はこれらの発見から恩恵を受け得る応用例について述べる。
1 Introduction
Reading is a common activity that is part of the process of information transfer between humans. However, despite of the important role it has played in recent history and its current wide use, this process of information transfer is not well understood. The difficulty in modelling the reading activity stems from the direct unobservability of human mental states and how the information is decoded and integrated into the brain, or simply forgotten.
The reading act can be seen as an interaction between the reader and the writer where the information and other aspects of the communication are transferred via the document. If we could observe the detailed editing process of a writer, that would indeed give us valuable information about the writer, useful to interpret the message to be sent. However, information on the editing process is usually not available, but the final result in the form of a document is. On the other side of the communication channel, the reader does not necessarily evidence any reading actions except for the movements of the eyes, and that is all we have to understand the reading process.
Several psycholinguistic studies (Rayner, 1998; McDonald and Shillcock, 2003) have shown that document characteristics influence on cognitive processing and that they are reflected on eye-movements in an on-line manner. There have been attempts to also quantify the influence of textual linguistic characteristics on reading behavior for certain types of reading tasks (Martínez-Gómez et al., 2012b), noting that although linguistic features of documents can be used to explain eye-movements and reading behavior, there might be other influencing factors. In our work, we consider the document and the eye-movements of the reader as the only
observablevariables in the reading act, and our general objective is to unveil thehidden
variables intervening and influencing the interaction, such as writer’s and reader’s personal characteristics. Examples of writer’s personal characteristics are writer’s intention, concerns or emotional state, while reader’s characteristics could be the reading objective, nationality, domain of expertise or literacy. We think that personal characteristics of readers define the mechanisms of their cognitive activity, and that when performing certain tasks, the eye-movements may reflect part of these personal characteristics. One of the hidden variables of the reader is the task performance achieved after reading a text, which is an intimate piece of information about the reader that could only be extracted so far by explicitly inquiring the subjects. Due to the interest and the broad range of applications that could benefit from the recognition of reading performance from eye-movements and document characteristics, we will narrow our study to this variable.
The objective of this work is then to use the spatiotemporal data that can be obtained by an eye-tracker when a subject reads a text and the linguistic information of the text itself, to capture common patterns in reading behavior across subjects with similar task performance. Thus, our hypothesis states that:
Hypothesis. Subjects with a high performance in reading tasks have characteristic patterns of reading behavior and can be distinguished from the subjects with low performance.
method to measuring task performance, we will resort to measuring the level of understanding of subjects after reading a text.
In the next section, we describe the efforts from the psycholinguistic community in understand-ing the relationship between eye-movements and cognitive processunderstand-ing, and how the present work builds upon them. Section 3 introduces the models of reading behavior that are used to capture patterns in the eye-movements. A description of the data collection and experiment conditions can be found in Section 4 and the quantification of the likelihood of our hypothesis can be read in Section 5. In Section 6, we point at our next steps in recognizing reader’s personal characteristics and suggest some applications that could benefit from the current line of investigation, followed by our conclusions at the end of the paper.
2 Related work
With the emergence of tracking devices, the study on the relationship between eye-movements and cognitive processes experienced important advances. An interesting survey can be found in Rayner (1998) condensing the findings on characteristics of elemental eye-movements, lexical processing and integration of information during reading tasks. In McDonald and Shillcock (2003), it was shown that probabilistic language models implemented as bi-grams could help to explain the on-line cognitive processing of our brains and predict fixation times. That work suggested that statistical models can be used to model cognitive processing and that hypotheses could be tested using evidence extracted from the observation of eye-movements. Other models of eye-movements when reading were developed, being the E-Z reader (Re-ichle et al., 2003) one of the most comprehensive. Remarkably, a corpus of eye-movement data (Kennedy and Pynte, 2005) was also built to test previous computational models and paving the way to establish a common ground of computational model development. Following these ideas, we work under the assumption that eye-movements reflect cognitive processes and that the analysis of these eye-movements and the linguistic features of the text can be used to indirectly recognize the current mental state of the reader.
Cognitive load is an important variable that has received a significant amount of attention since it is a good signal of task difficulty and cognitive demand. In Tomanek et al. (2010), variations in eye-movements were used to build a cognitive cost model to predict human annotation costs of named entities, while in Doherty et al. (2010), variations in eye-movements were used to recognize hidden linguistic features from machine translation output such as sentence understandability. Although these two works appear to share the same idea, they point at different directions. The former uses linguistic features and eye-movements to unveil hidden cognitive costs, while the latter uses certainty on cognitive load and eye-movements to recognize textual characteristics such as sentence understandability. Both directions fall within our research interests, but in the present paper we follow the philosophy of Tomanek et al. (2010), in that we use observations of the text and the eye-movements to infer a hidden personal characteristic such as the level of understanding.
Eye-movements have also proved to characterize individuals, and there is a growing list of applications that would benefit from the refined user models that can be obtained by automatically processing eye-movements on text and other media (Xu et al., 2008; Buscher et al., 2008; Xu et al., 2009; Buscher and Dengel, 2009). With this motivation in mind, this paper contributes to better recognize personal characteristics of readers by using information from their eye-movements and the linguistic characteristics of the texts they read.
3 Methodology
3.1 Synthesizing images of linguistic and gaze evidence
With the objective of modelling the reading act, we first need to identify what variables are present in the process. The interaction between the reader and the document has latent and patent variables, where only the latter can be observed and measured. Nowadays, there is a large quantity of text that is being consumed in the form of digital content that is projected on a display, and it is reasonable to think that the structure, the contents and the linguistic features of the document can be observed and automatically extracted in the form ofstatistical evidence. In the present paper, we work under the assumption that eye-movements can also be observed by means of an eye-tracker system. There are multiple eye-movements that have been recognized and categorized (see (Rayner, 1998) for details), but we can roughly group them intofixations
andsaccades. Fixations are periods of time where the subject looks still at a certain location, and it is known to be used for object recognition in general tasks or for lexical processing in reading tasks. Saccades, on the contrary, are sudden eye-movements that are used to change the fixation location and it is believed that cognitive processing is suppressed during the eye-movement. There is a strong need of finding a suitable, unified representation of linguistic and gaze data in order to integrate these two sources of information. Gaze data can be naturally represented using synthesized images out of the(x,y)coordinates of the position where the eye-tracker “believes” the reader is gazing at. At a constant sampling rate, areas in the image where the reader gazed at longer will have a larger amount of pixels with high values, each pixel representing a gaze sample. There is, however, another aspect of the temporal data that can be obtained by an eye-tracker that is related to the sequential order of the gaze samples. The sequential order of the eye-movements is valuable to detect regressions, which are backward saccades usually used by readers for disambiguation, refreshing previously read passages or resolve apparent contradictions. Although these eye-movements are very interesting to infer the current state of mind of readers, they will not be included in our data representations due to their complex nature.
Raw gaze data Blurred gaze data
Figure 1: On the left, image representation of raw gaze data of an eye-tracking session. On the right, blurred image representation used to preserve uncertainty on the variable error introduced by the system. Pixel values are complemented for clarity.
Similarly, linguistic information can also be represented using synthesized images (Martínez-Gómez et al., 2012b), where the area of a word or phrase is filled with pixel values whose intensity is proportional to the quantification of a certain linguistic feature within the document. It should be noted at this stage that the image representations of linguistic features only quantify the presence of linguistic features within the document and does not take into account any gaze evidence. For this strategy of representation, there will be a synthesized image for each linguistic feature that we include in our model. The quantification of a linguistic feature can be normalized so that it falls within the[0, 1]interval and the distribution of the pixel
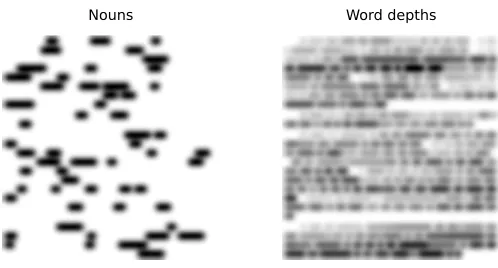
intensity values over that range can be adjusted in a similar manner as gaze images were, in order to compensate for linguistic features that occur too often or too rarely in the documents. An example of a binary feature that takes the values 1 or 0 to indicate whether a word is a noun or not can be seen on the left plot in Figure 2. The right plot in Figure 2 shows an image representation of a feature that quantifies the depth of a word in the parse tree of its corresponding sentence, normalized to fall within the interval[0, 1].
In this work, we characterize reading behavior by the eye-movements of a subject when reading, which are in turn characterized by the distribution of fixations on parts of the text with certain linguistic features. It is thus useful to quantify this distribution of attention on each linguistic feature. Once we obtained the image representations of gaze evidence and the image representations of linguistic features, we combine these two sources of information by computing how well each linguistic feature explains the eye-movements. In line with our methodology, we will perform such combination by using image processing methods.
Within the image recognition field, image registration is the technique to find correspondences between two or more images with the purpose of estimating transformations for spatial align-ment or detect temporal changes using pixel intensity differences. Although there is a wide variety of similarity measures that could be used to measure how well a certain linguistic feature explains the eye-movements, we opted for adapting precision, recall andF1scores as they are
Nouns Word depths
Figure 2: On the left, image representation of a linguistic feature indicating what words are nouns (binary). On the right, image representation of a linguistic feature quantifying the word depth in a parse tree (normalized). Again, pixel values are complemented for clarity.
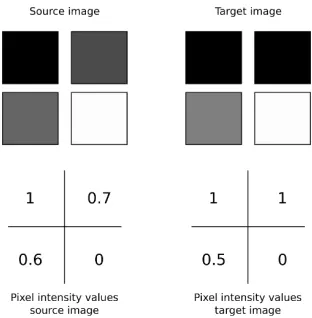
Computing the precision of how an image representation of a linguistic feature (source image) explains the image representation of gaze evidence (target image) consists in computing how much of pixel intensity in the source image is present in the target image, divided by the total amount of intensity across all pixels from the source image. Similarly, recall can be computed as the amount of pixel intensity from the source image that is present in the target image, divided by the amount of intensity across all pixels from the target image. Finally, the familiar expressionF1=2·precisionprecision·recall+recallcan be used to compute theF1score, which is a value in the
interval[0, 1]. An example of the computation of precision, recall andF1scores between images of only four pixels can be found in Figure 3.
3.2 Representation of observations
A reading session consists of a subject reading a document. From every reading session, we can obtain data from the eye-movements and data about the linguistic features of the text. As we described in Section 3.1, we can synthesize an image representation of the data from the eye-movements, and an image representation for each linguistic feature. Using theF1score, we computed how well the image representation of linguistic featureimatch (or explains) the image representation of the eye-movements, and obtained a numberoi∈ Rsuch that
0≤oi≤1. If we match the image representation of every linguistic feature against the image
representation of the eye-movements, we can obtain a fixed-size feature vectoro= [o1, . . . ,oL]
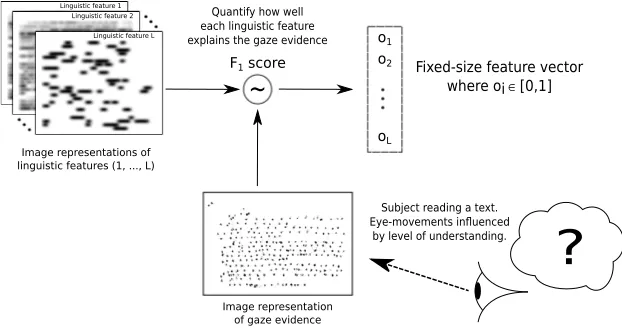
that has as many components (or dimensions) as linguistic features (L). An overview of the architecture can be found in Figure 4.
Figure 3: Example of computation of precision, recall andF1score between a source and
a target image. On the top row, four pixels (complemented for clarity) are displayed, and their corresponding pixel values on the bottom row. Precision=11++0.70.7++0.50.6=0.96. Recall= 1+0.7+0.5
1+1+0.5 =0.88. Thus,F1=0.92.
if they have similar feature vectors, as defined by a similarity metric in the feature space. For the sake of readability and ease of interpretation in posterior sections, we chose the euclidean distance between two observationsoando0as a similarity measure, defined as:
dist(o,o0) =p(f
1−f10)2+· · ·+ (fF−fF0)2 (1)
where the smaller the distance, the higher the similarity betweenoando0is.
As it has been said, each reading session is represented by a feature vectorothat defines a distribution on how well each linguistic feature helps to explain the gaze evidence from a certain subject. Our hypothesis is that this representation helps to discriminate between subjects with a low and a high task performance. In order to test this hypothesis, we will test forlinear separability, that is, how well we can separate subjects with a hypersurface1in a certain reduced
dimensionality.
4 Experimental framework
In order to collect data for experimentation purposes, 9 subjects were asked to read news and fiction documents in English following different reading strategies. Subjects were students from China (1), Indonesia (1), Japan (4), Spain (1), Sweden (1) and Vietnam (1) in Bachelor, Master, PhD and post-doctoral levels of education in computer science.
Three reading strategies were considered. The first strategy wasprecise reading, where subjects were told to read two documents with the objective of maximizing their comprehension and that their level of understanding would be tested after reading each document with yes-no questions,
[image:7.420.139.295.68.227.2]?
Linguistic feature 1Linguistic feature 2 Linguistic feature L
Image representations of linguistic features (1, ..., L)
Image representation of gaze evidence
~
F1 score
Quantify how well each linguistic feature
explains the gaze evidence o1
o2
oL
Fixed-size feature vector where oi ∈ [0,1]
Subject reading a text. Eye-movements influenced
[image:8.420.47.358.71.237.2]by level of understanding.
Figure 4: Schema of the methodology used in this work to estimate the distribution on how each linguistic feature explains subject’s reading behavior. First, a collection of image representations of linguistic features is synthesized. Then, using the imageF1score function, each linguistic
feature is matched against the gaze data to obtain a measure on how well it explains reading behavior. The result is a fixed-size feature vectororepresenting a reading session.
multiple-choice questions and free-answer questions. The second strategy wasskimming, with the objective of finding the answer to one or two questions (to each document, respectively) and the accuracy and completeness of their answer was measured after subjects claimed that they had found the necessary information to answer the questions. The third strategy was named
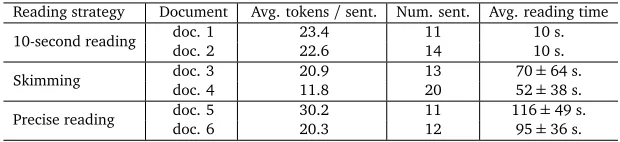
10-second reading, where subjects were given 10 seconds to obtain as much information as possible from two documents (respectively), and were asked to show the amount of information they got and were scored proportionally to correctness and completeness. Table 1 summarizes basic statistics of the documents. The total duration of the reading sessions and question answering to obtain subject’s level of understanding was, on average, 40 minutes.
Randomizing the presentation order of the documents is a standard practice in psycholinguistics. In the present work, however, the presentation order was kept constant, due to concerns about the effects of the randomization when working with a limited number of subjects. We believe that the results are not affected by this decision, since subjects were compared within the same document and reading strategy (thus, under the same experimental conditions).
Reading strategy Document Avg. tokens/sent. Num. sent. Avg. reading time
10-second reading doc. 1doc. 2 23.422.6 1114 10 s.10 s.
Skimming doc. 3doc. 4 20.911.8 1320 7052±64 s.
±38 s.
Precise reading doc. 5doc. 6 30.220.3 1112 11695±±36 s.49 s.
Table 1: Statistics on the average number of tokens per sentence (Avg. tokens/sent.), number of sentences (Num. sent.) and average reading time (Avg. reading time). Statistics were collected across all subjects for the 6 documents used during the experiments, to record eye-movements and obtain the linguistic features of those documents.
With the intention of capturing all possible linguistic influence on reading behavior, we collected a set of lexical, syntactic and semantic linguistic features on every document. Among the lexical linguistic features, we measured word length, whether the word contains a digit or not, the presence of upper case letters or word unpredictability, as given by the perplexity from a 5-gram language model trained on a big corpus (Koehn, 2005) and smoothed using modified Kneser-Ney technique (Chen and Goodman, 1999). Syntactic features were also included in our model, such as whether a word is the head of a phrase, binary features indicating whether a word has a certain Part-of-Speech (POS) tag, total height of the parse tree of the sentence each word corresponds to, word position in the sentence, etc. We believe that semantic features also may influence greatly on the eye movements, since it is reasonable to think that an important part of the cognitive processing consists in an incremental integration of the information into the personal knowledge base, right after the lexical and syntactic processing happens. However, due to the difficulty in formally defining and properly quantifying semantic features, only two were considered, namely the word ambiguity, as given by the number of senses in WordNet (Miller, 1995) that a word may have, and a feature indicating whether a word or phrase is a named entity or not. The complete list of linguistic features included in our model can be found in Table 2, and will be used to synthesize image representations and compute how well they help to explain the gaze evidence.
Prior recording the eye-movements during the reading session, every subject was informed of the dynamics of the reading tasks. Tobii TX300 and Text2.0(Biedert et al., 2010) were used to capture the(x,y)coordinates of the gaze samples for every subject reading every document, and the eye-tracker was calibrated before every subject read every document. In order to avoid introducing tracking errors as much as possible, a chin rest was used for subjects to keep their heads stable. A text-gaze aligner (Martínez-Gómez et al., 2012a) based on an image registration method was also used to correct variable and systematic errors in the coordinates of the gaze samples, and further corrections were manually performed when necessary. Finally, the eye-tracking session data of a subject reading one of the documents in the 10-second reading task was discarded due to unrecoverable errors during the eye-tracking session.
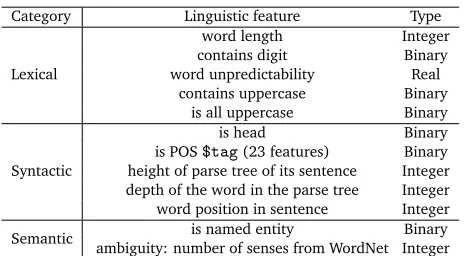
[image:9.420.62.372.86.157.2]Category Linguistic feature Type
Lexical
word length Integer
contains digit Binary
word unpredictability Real
contains uppercase Binary
is all uppercase Binary
Syntactic
is head Binary
is POS$tag(23 features) Binary
height of parse tree of its sentence Integer depth of the word in the parse tree Integer
word position in sentence Integer
[image:10.420.88.320.68.196.2]Semantic ambiguity: number of senses from WordNet Integeris named entity Binary
Table 2: Lexical, syntactic and semantic linguistic features considered in this work. Examples of POS$tagare “Nouns”, “Verbs” and “Prepositions”. Heads and parse trees were obtained using an HPSG parser (Miyao and Tsujii, 2008).
spending different amount of time on the documents, and to account for rare or too-frequent linguistic features that have a different amount of total pixel intensity in the image. Thus, the intensity was adjusted in such a way that 1% of the highest and the lowest non-zero pixel values were saturated (i.e. totally dark and totally white).
5 Results
5.1 Patterns in the variance
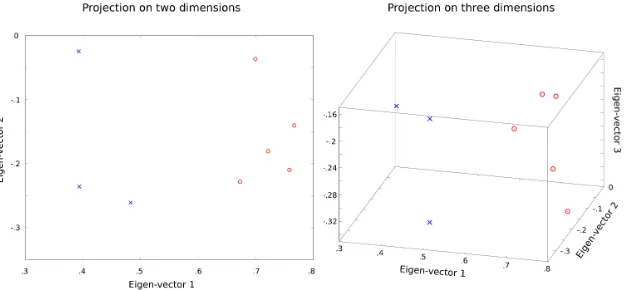
In our hypothesis, we stated that subjects with different task performance would have different patterns in reading behavior. With the objective of revealing these differences at a preliminary stage, we proceed to analyze the variability of the distribution of attention on the linguistic features across all subjects participating in our experiments. Studying the variability of data is of special interest because patterns in variance are usually good signals to be considered to discriminate between subjects. Thus, Principal Component Analysis (PCA) (Jolliffe, 2002) will be used to obtain the directions in the feature space where the covariance matrix of the observations varies the most, as given by the eigen-vectors associated to the highest absolute eigen-values.
Figure 5: Principal Component Analysis on the covariance matrix of the subjects reading document 1 during the 10-second reading task. Subjects with low level of understanding are marked asx, and subjects with a high understanding are marked aso. On the left plot, a projection onto two dimensions capture 74.8% of the variance; on the right plot, a projection onto three dimensions capture 85.6%.
5.2 Separability
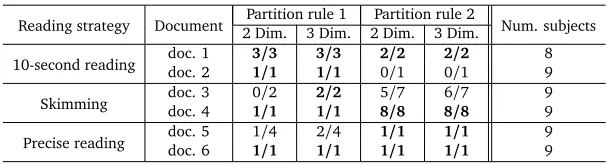
[image:11.420.65.377.71.216.2]Partition rule 1 Partition rule 2
Reading strategy Document 2 Dim. 3 Dim. 2 Dim. 3 Dim. Num. subjects
doc. 1 3/3 3/3 2/2 2/2 8
10-second reading doc. 2 1/1 1/1 0/1 0/1 9
doc. 3 0/2 2/2 5/7 6/7 9
Skimming doc. 4 1/1 1/1 8/8 8/8 9
doc. 5 1/4 2/4 1/1 1/1 9
Precise reading doc. 6 1/1 1/1 1/1 1/1 9
Table 3: Quantification of the separability for subjects reading two documents following 10-second, skimming and precise reading tasks. Subjects have been projected in two and three dimensions (Dim.), and linear separability have been tested for two different partition rules as described in Section 4. At every cell,X/Ydenotes thatY subjects were selected by the partition rule to test their linear separability, andXof them were successfully separated from the rest of the subjects.
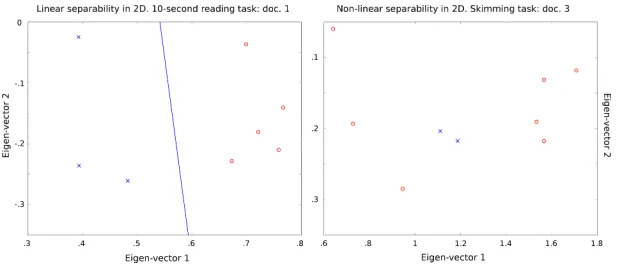
select the subset of subjects with the lowest level of understanding. From Table 3, it can be read that not a single subject with a low level of understanding can be linearly separated from the rest, thus not being distinguishable from the other subjects by using the patterns on reading behavior that are described in this paper. An illustration of these two examples can be found in Figure 6.
It can be observed that the subjects with a level of understanding below one third of the highest level of understanding can be linearly separated from the rest of the subjects in all documents of the 10-second and skimming reading strategies. This linear separation was feasible in two and three dimensions respectively2. At the precise reading strategy, only some subjects with the
lowest level of understanding were found to be linearly separable from the rest of the subjects, indicating that the distribution of the attention over linguistic features only contains limited information about reading performance and that the eye-movements might be influenced by factors of different nature, which is consistent with (Martínez-Gómez et al., 2012b).
Table 3 also contains a quantification of how well subjects with a high level of understanding could be linearly differentiated from the rest of the subjects (columns corresponding to partition rule 2). Although it can be appreciated that results are not consistent across all reading tasks, there is a positive trend of linear separability. In document 1 of the 10-second reading task, two subjects were selected by the partition rule 2, and both of them were successfully linearly separated from the rest of the subjects in 2 dimensions. In document 2, however, the partition rule only selected one subject with the highest level of understanding, but neither projections in 2 nor 3 dimensions allowed for linear separability. In document 3 of the skimming task, 7 subjects (out of 9) were selected as having the highest level of understanding, and 5 and 6 of them were successfully linearly separated in 2 and 3 dimensions respectively. In document 4 of the same task, the partition rule 2 selected 8 subjects, and all of them were linearly separated from the remaining subject. Finally, in both documents of the precise reading task, only 1 subject in every document was selected as having the highest level of understanding, and the subject was positively linearly separated from the rest of the subjects in 2 and 3 dimensions.
[image:12.420.50.354.69.151.2]Figure 6: On the left, a positive example of linear separability in a projection on two dimensions of the subjects reading document 1 in the 10-second reading task. On the right, a negative example of a projection on two dimensions of the subjects reading document 3 of the skimming task, where subjects with low level of understanding (x) cannot be linearly differentiated from the rest of the subjects (o), using the patterns in reading behavior described in this work.
6 Future work and applications
The work presented in this paper is a step towards recognizing personal characteristics by using data extracted from the eye-movements in combination with the linguistic properties of the documents being read. We believe that there are other personal characteristics that can be extracted from eye-movements. Language ability is one of them, and it could be recognized by analyzing the proportions in the quantity of attention paid on words or phrases with certain linguistic features such as verbs or nouns. Subject’s domain of expertise could also be recognized by analyzing fixation times on technical terms and comparing it to other subjects with different known domains of expertise. We also believe that the reading intention of users is also reflected on the eye-movements and it falls within our research road map. We are also interested in designing models to explain how the pupil size diameter depends on the linguistic characteristics and the amount of information contained in a text with the objective of quantifying the amount of surprise that readers received when exposed to the documents.
7 Conclusions
In the present work, we have introduced a method to represent subjects as fixed-size feature vectors that denote the distribution on how well each linguistic feature explains the eye-movements when reading a specific document. Information on gaze samples and linguistic features was integrated in a common framework by means of their encoding into synthesized images whose pixels quantify the strength of the statistical evidence. With the definition of image precision, recall andF1scores, we narrowed the gap between the image and natural
language processing fields. Although traditional statistical models could be used with similar results, our method allows to include geometric information into our linguistic models in a natural manner.
Examples of image processing techniques that resulted useful were the image registration to perform text-gaze alignment, blurring images to carry the uncertainty of the error-correction into our subsequent models, capabilities to adjust intensity of pixel values to compensate for too common or too rare linguistic features, ease in visually analyzing our reading models and more importantly, estimating how well each linguistic feature explains eye-movements data without the need of testing for significant decreases in perplexity when those features are added into the traditional statistical models.
We analyzed the variability on the distribution over the personal feature vectors by projecting them onto a lower dimensional space for visual inspection. We observed patterns in the distribution of those feature vectors across all subjects, found that they are characteristic of every subject and that they relate to the subject’s level of understanding. Finally, we tested the hypothesis that subjects with different levels of understanding can be distinguished from each other by using the information extracted from the combination of eye-movements captured by an eye-tracker and the linguistic information extracted from a document.
In order to test our hypothesis given the limited number of subjects, we used “linear separability”, which is a very exigent condition to satisfy conditioned on the low dimensionality and the number of subjects that we presented. We consistently succeeded in linearly discriminating subjects with low level of understanding from the rest of the subjects at the 10-second and skimming reading tasks. However, subjects with low task performance were not consistently linearly separable for the task of precise reading, suggesting that other methods might be necessary to discriminate them. Linear separability of subjects with high level of understanding showed a positive but not decisive trend and we will say, for now, that subjects with lower level of understanding are easier to recognize by their eye-movements on the documents they read, when compared to subjects with high task performance. The ability to distinguish readers according to their level of understanding can further be accomplished in a less exigent scenario by relaxing the condition of separability into a higher dimensionality or non-linearity with a larger number of subjects.
References
Biedert, R., Buscher, G., Schwarz, S., Möller, M., Dengel, A., and Lottermann, T. (2010). The text 2.0 framework - writing web-based gaze-controlled realtime applications quickly and easily. InProceedings of the International Workshop on Eye Gaze in Intelligent Human Machine Interaction (EGIHMI).
Biedert, R., Dengel, A., Elshamy, M., and Buscher, G. (2012). Towards robust gaze-based objective quality measures for text. InProceedings of the Symposium on Eye Tracking Research and Applications, pages 201–204. ACM.
Buscher, G. and Dengel, A. (2009). Gaze-based filtering of relevant document segments. In
International World Wide Web Conference (WWW).
Buscher, G., Dengel, A., and van Elst, L. (2008). Query expansion using gaze-based feedback on the subdocument level. InACM Special Interest Group on Information Retrieval (SIGIR).
Chen, S. F. and Goodman, J. (1999). An empirical study of smoothing techniques for language modeling.Computer Speech and Language, 4(13):359–393.
Doherty, S., O’Brien, S., and Carl, M. (2010). Eye tracking as an MT evaluation technique.
Machine Translation, 24:1–13. 10.1007/s10590-010-9070-9.
Haralick, R. and Shapiro, L. (1992).Computer and robot vision, volume 1. Addison-Wesley.
Hornof, A. and Halverson, T. (2002). Cleaning up systematic error in eye-tracking data by using required fixation locations.Behavior Research Methods, 34:592–604. 10.3758/BF03195487.
Hyrskykari, A. (2005). Utilizing eye movements: Overcoming inaccuracy while tracking the focus of attention during reading.Computers in Human Behavior, 22:657–671.
Jolliffe, I. (2002).Principal component analysis, volume 2. Wiley Online Library.
Kennedy, A. and Pynte, J. (2005). Parafoveal-on-foveal effects in normal reading. Vision Research, 45:153–168.
Koehn, P. (2005). Europarl: A parallel corpus for statistical machine translation. InProceedings of the 10th Machine Translation Summit, 2005, pages 79–86.
Martínez-Gómez, P., Chen, C., Hara, T., Kano, Y., and Aizawa, A. (2012a). Image registration for text-gaze alignment. InProceedings of the 2012 ACM international conference on Intelligent User Interfaces, IUI ’12, pages 257–260, New York, NY, USA. ACM.
Martínez-Gómez, P., Hara, T., Chen, C., Kyohei, T., Kano, Y., and Aizawa, A. (2012b). Syn-thesizing image representations of linguistic and topological features for predicting areas of attention. InProceedings of The Pacific Rim International Conference on Artificial Intelligence, PRICAI ’12.
McDonald, S. A. and Shillcock, R. C. (2003). Eye movements reveal the on-line computation of lexical probabilities during reading.Psychological Science, 14(6):648–652.
Miyao, Y. and Tsujii, J. (2008). Feature forest models for probabilistic HPSG parsing. Compu-tational Linguistics, 34:35–80.
Rayner, K. (1998). Eye movements in reading and information processing: 20 years of research.
Psychological Bulletin, 124:372–422.
Reichle, E., Rayner, K., and Pollatsek, A. (2003). The E-Z reader model of eye-movement control in reading: Comparisons to other models.Behavioral and brain sciences, 26:445–526.
Tomanek, K., Hahn, U., Lohmann, S., and Ziegler, J. (2010). A cognitive cost model of annotations based on eye-tracking data. InProceedings of the 48th Annual Meeting of the Association for Computational Linguistics, ACL ’10, pages 1158–1167, Stroudsburg, PA, USA. Association for Computational Linguistics.
Xu, S., Jiang, H., and Lau, F. C. (2008). Personalized online document, image and video recommendation via commodity eye-tracking. InACM Recommender Systems (RecSys).