Towards a validated model for affective classification of texts
Michel G´en´ereux and Roger Evans Natural Language Technology Group (NLTG)
University of Brighton, United Kingdom
{M.Genereux,R.P.Evans}@brighton.ac.uk
Abstract
In this paper, we present the results of experiments aiming to validate a two-dimensional typology of affective states as a suitable basis for affective classification of texts. Using a corpus of English weblog posts, annotated for mood by their authors, we trained support vector machine binary classifiers to distinguish texts on the ba-sis of their affiliation with one region of the space. We then report on experiments which go a step further, using four-class classifiers based on automated scoring of texts for each dimension of the typology. Our results indicate that it is possible to extend the standard binary sentiment anal-ysis (positive/negative) approach to a two dimensional model (positive/negative; ac-tive/passive), and provide some evidence to support a more fine-grained classifica-tion along these two axes.
1 Introduction
We are investigating the subjective use of language in text and the automatic classification of texts ac-cording to their subjective characteristics, or ‘af-fect’. Our approach is to view affective states (such as ‘happy’, ‘angry’) as locations in Osgood’s Evaluation-Activation (EA) space (Osgood et al. , 1957), and draws on work in psychology which has a long history of work seeking to construct a typology of such affective states (Scherer, 1984). A similar approach has been used more recently to describe emotional states that are expressed in speech (Cowie and Cornelius, 2002; Schr¨oder and Cowie, 2005). Our overall aim is to determine the extent to which such a typology can be vali-dated and applied to the task of text classification
using automatic methods. In this paper we de-scribe some initial experiments aimed at validating a basic two dimensional classification of weblog data, first with Support Vector Machine (SVM) binary classifiers, then with Pointwise Mutual In-formation - InIn-formation Retrieval (PMI-IR). The domain of weblog posts is particularly well-suited for this task given its highly subjective nature and the availability of data , including data which has been author-annotated for ‘mood’, which is a rea-sonable approximation of ‘affect’.
Recent attempts to classify weblog posts have shown modest, but consistent improvements over a 50% baseline, only slightly worse than human performance (Mishne, 2005). One important mile-stone is the elaboration of a typology of affec-tive states. To devise such a typology, our start-ing point is Figure 1, which is based on a model of emotion as a multicomponent process (Scherer, 1984). In this model, the distribution of the af-fective states is the result of analysing similar-ity judgments by humans for 235 emotion terms1
using cluster-analysis and multidimensional scal-ing techniques to map out the structure as a two-dimensional space. The positioning of words is not so much controversial as fuzzy; an affective state such as ‘angry’ to describe facial expression in speech may have a slightly different location than an ‘angry’ weblog post. In this model, the well-studied ‘sentiment’ classification is simply a specific case (left vs. right halves of the space). The experiments we describe here seek to go be-yond this basic distinction. They involve an addi-tional dimension of affect, theactivitydimension,
allowing textual data to be classified into four cat-egories corresponding to each of the four
quad-1Reduced to less than 100 in Figure 1.
Figure 1: Typology of affective states based on (Scherer, 1984)
rants in the space. Ultimately, once scores have been ‘promoted’ to real measures, classification can be more precise; for example, a text is not only negative and passive, it is more precisely ‘depres-sive’. With such a more precise classification one might, for example, be able to detect individuals at risk of suicide. In Experiment 1, we use bi-nary classifiers to investigate how the four quad-rants defined by the typology hold together, the assumption being that if the typology is correct, the classifiers should perform substantially better than a random baseline. In Experiment 2, we go a step closer towards a more fine-grained classifi-cation by evaluating the performance of an unsu-pervised automated technique for scoring texts on both axes. Both these experiments are preliminary — our long term goal is to be able to validate the whole typology in terms of computationally effec-tive classification.
2 Corpus
We have collected from Livejournal2 a total of
346723 weblogs (mood-annotated by authors) in 2http://www.livejournal.com.
English, from which almost half are annotated with a mood belonging to one of the four quad-rants, described as follows:
Quadrant1 bellicose, tense, alarmed, envious,
hateful, angry, enraged, defiant, annoyed, jealous, indignant, frustrated, distressed, disgusted, sus-picious, discontented, bitter, insulted, distrustful, startled, contemptuous and impatient.
Quadrant2 apathetic, disappointed, miserable,
dissatisfied, taken aback, worried, languid, feel guilt, ashamed, gloomy, sad, uncomfortable, em-barrassed, melancholic, depress, desperate, hes-itant, bored, wavering, droopy, tired, insecured, anxious, lonely and doubtful.
Quadrant3 feel well, impressed, pleased,
amourous, astonished, glad, content, hopeful, solemn, attentive, longing, relaxed, serious, serene, content, at ease, friendly, satisfied, calm, contemplative, polite, pensive, peaceful, conscientious, empathic, reverent and sleepy.
Quadrant4 happy, ambitious, amused,
conceited, self confident, courageous, feeling su-perior, enthusiastic, light hearthed, determined, passionate, expectant, interested, joyous and de-lighted.
In our experiments, we used 15662 from quad-rant Q1 (see Figure 1), 54940 from Q2, 49779 from Q3 and 35634 from Q4.
3 Experiment 1: Distinguishing the four Quadrants
Our hypothesis is that the classification of two dis-joint sets of moods should yield a classification ac-curacy significantly above a baseline of 50%. To verify our hypothesis, we conducted a series of ex-periments using machine learning to classify we-blog posts according to their mood, each class cor-responding to one particular quadrant. We used Support Vector Machines (Joachims, 2001) with three basic classic features (unigrams, POS and stems) to classify the posts as belonging to one quadrant or one of the three others. For each clas-sification task, we extracted randomly 1000 test-ing examples, and trained separately with 2000, 4000, 8000 and 16000 examples. In each case, ex-amples were divided equally among positive and negative examples3. The set of features used
var-ied for each of these tasks, they were selected by thresholding each (distinct) training data set, after removing words (unigrams) from the categories poor in affective content (prepositions, determin-ers, etc.). To qualify as a feature, each unigram, POS or stem had to occur at least three times in the training data. The value of each feature corre-sponds to its number of occurence in the training examples.
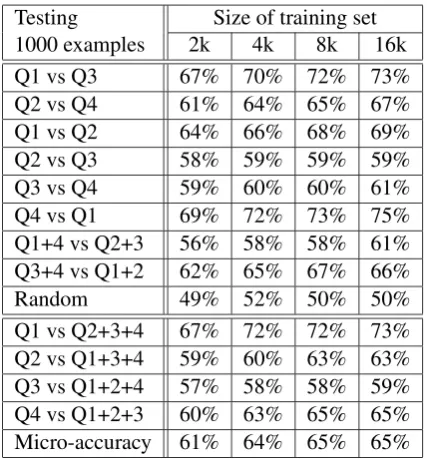
3.1 Results
Our hypothesis is that, if the four quadrants de-picted in Figure 1 are a suitable arrangement for affective states in the EA space, a classifier should perform significantly better than chance (50%). Table 1 shows the results for the binary classifi-cation of the quadrants. In this table, the first col-umn identifies the classification task in the form ‘P vs N’, where ‘P’ stands for positive examples and ‘N’ for negative examples. The ‘Random’ row shows results for selecting positive and negative examples randomly from all four quadrants. By 3For instance, 1000 = 500 positives from one RANT + 500 negatives among the other three QUAD-RANTS.
micro-averaging accuracy for the classification of each quadrant vs all others (rows 10 to 13), we obtain at least 60% accuracy for the four binary classifications of the quadrants4. The first six rows
show evidence that each quadrant forms a distinc-tive whole, as the classifer can easily decide be-tween any two of them.
Testing Size of training set
1000 examples 2k 4k 8k 16k
Q1 vs Q3 67% 70% 72% 73%
Q2 vs Q4 61% 64% 65% 67%
Q1 vs Q2 64% 66% 68% 69%
Q2 vs Q3 58% 59% 59% 59%
Q3 vs Q4 59% 60% 60% 61%
Q4 vs Q1 69% 72% 73% 75%
Q1+4 vs Q2+3 56% 58% 58% 61%
Q3+4 vs Q1+2 62% 65% 67% 66%
Random 49% 52% 50% 50%
Q1 vs Q2+3+4 67% 72% 72% 73%
Q2 vs Q1+3+4 59% 60% 63% 63%
Q3 vs Q1+2+4 57% 58% 58% 59%
Q4 vs Q1+2+3 60% 63% 65% 65%
[image:3.595.310.524.168.398.2]Micro-accuracy 61% 64% 65% 65% Table 1: Accuracy of binary classification
3.2 Analysis of Results
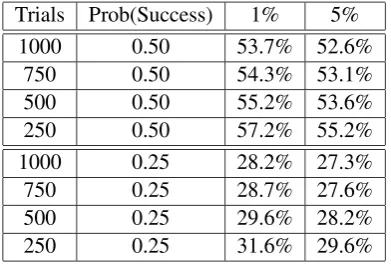
We introduce now table 2 that shows two thresh-olds of significance (1% and 5%) for the interpre-tation of current and coming results. For exam-ple, if we have 1000 trials with each trial having a probability of success of 0.5, the likelihood of get-ting at least 53.7% of the trials right is only 1%. This gives us a baseline to see how significantly well above chance a classifier performs. The SVM algorithm has linearly separated the data for each quadrant according to lexical and POS content (the features). The most sensible explanation is that the features for each class (quadrant) aresemantically
related, a piece of information which is relevant for the model (see section 4). It is safe to conclude that the results cannot be allocated to chance, that there is something else at work that explains the
4Micro-averaged accuracy is defined as:
P
i(tpi+tni) P
i(tpi+tni+f pi+f ni)
wheretpstands for “true positive”, fnfor “false negative”,
Trials Prob(Success) 1% 5%
1000 0.50 53.7% 52.6%
750 0.50 54.3% 53.1%
500 0.50 55.2% 53.6%
250 0.50 57.2% 55.2%
1000 0.25 28.2% 27.3%
750 0.25 28.7% 27.6%
500 0.25 29.6% 28.2%
[image:4.595.84.280.62.195.2]250 0.25 31.6% 29.6%
Table 2: Statistical Significance
accuracies consistently well above a baseline, and this something else is the typology. These results show that the abstraction offered by the four quad-rants in the model seems correct. This is also sup-ported by the observation that the classifier shows no improvements over the baseline if trained over a random selection of examples in the entire space.
4 Experiment 2: Classification using Semantic Orientation from Association
Our next goal is to be able to classify a text accord-ing to more than four classes (positive/negative, active/passive), by undertaking multi-category classification of texts according to particular re-gions of the space, (such as ‘angry’, ‘sad’, etc.). In order to do that we need a scoring system for each axis. In the following experiments we explore the use of such scores and give some insights into how to transform these scores of affect as measures of affect.
Using binary classifiers, we have already estab-lished that if we look at the lexical contents of we-blog posts tagged according to their mood by their author, these mood classes tend to cluster accord-ing to a two-dimensional typology defined by their semantic orientation: positive or negative ( evalu-ation), active or passive (activity). Beyond
aca-demic importance, the typology really becomes of practical interest if we can classify the posts us-ing pre-defined automated scores for both axis. One strategy of scoring is to extract phrases, in-cluding single words, which are good indicators of subjectivity in texts, and score them accord-ing to how they relate or ‘associate’ to one or the other extremity of each axis. This strategy, called Semantic Orientation (SO) from Association (A) has been used successfully (Turney and Littman, 2003) to classify texts or adjectives of all sorts ac-cording to their sentiments (in our typology this
corresponds to the evaluation dimension).
Ac-cording to these scores, a text or adjective can be said to have, for example, a more or less positive or negativeevaluation. We will use this strategy to
go further in the validation of our model of affec-tive states by scoring also theactivitydimension;
to our knowledge, this is the first time this strat-egy is employed to get (text) scores for dimen-sions other than evaluation. In SO-A, we score
the strength of the association between an indica-tor from the text and a set of positive or negative
words (the paradigms Pwords and Nwords)
cap-turing the very positive/active or negative/passive semantic orientation of the axis poles. To get the SO-A of a text, we sum over positive scores for indicators positively related toPwords and
nega-tively related to Nwords and negative scores for
indicators positively related to Nwordsand
nega-tively related to Pwords. In mathematical terms,
the SO-A of a text is:
T extX
ind (
P wordsX
p
A(ind, p)− N wordsX
n
A(ind, n))
whereindstands for indicator. Note that the
quan-tity ofPwordsmust be equal toNwords.
To compute A, (Kamps et al. , 2004) focus on the use of lexical relations defined in Word-Net5 and define a distance measure between two
terms which amounts to the length of the short-est path that connects the two terms. This strat-egy is interesting because it constrains all values to belong to the [-1,+1] range, but can be applied only to a finite set of indicators and has yet to be tested for the classification of texts. (Turney and Littman, 2003) use Pointwise Mutual Infor-mation - InforInfor-mation Retrieval (PMI-IR); PMI-IR operates on a wider variety of multi-words indi-cators, allowing for contextual information to be taken into account, has been tested extensively on different types of texts, and the scoring system can be potentially normalized between [-1,+1], as we will soon see. PMI (Church and Hanks, 1990) be-tween two phrases is defined as:
log2 prob(ph1is near ph2)
prob(ph1)∗prob(ph2)
PMI is positive when two phrases tend to co-occur and negative when they tend to be in a comple-mentary distribution. PMI-IR refers to the fact
that, as in Informtion Retrieval (IR), multiple oc-currences in the same document count as just one occurrence: according to (Turney and Littman, 2003), this seems to yield a better measure of semantic similarity, providing some resistance to noise. Computing probabilities using hit counts from IR, this yields to a value for PMI-IR of:
lognN ∗(hits(ph1N EAR ph2) + 1/N) (hits(ph1) + 1)∗(hits(ph2) + 1) where N is the total number of documents in the corpus. We are going to use this method for com-puting A in SO-A, which we call SO-PMI-IR. The configuration depicted in the remaining of this sec-tion follows mostly (Turney and Littman, 2003).
Smoothing values (1/N and 1) are chosen so that PMI-IR will be zero for words that are not in the corpus, two phrases are consideredNEARif they
co-occur within a window of 20 words, and log2 has been replaced bylogn, since the natural log is more common in the literature for log-odds ratio and this makes no difference for the algorithm.
Two crucial aspects of the method are the choice of indicators to be extracted from the text to be classified, as well as the sets of positive and neg-ative words to be used as paradigms for the eval-uationandactivity dimensions. The five
part-of-speech (POS) patterns from (Turney, 2002) were used for the extraction of indicators, all involving at least one adjective or adverb. POS tags were acquired with TreeTagger (Schmid, 1994)6.
Ide-ally, words used as paradigms should be context insensitive, i.e their semantic orientation is either always positive or negative. The adjectives good, nice, excellent, positive, fortunate, correct, supe-rior and bad, nasty, poor, negative, unfortunate, wrong, inferiorwere used as near pure
representa-tions of positive and negative evaluation
respec-tively, while fast, alive, noisy, young and slow, dead, quiet, oldas near pure representations of
ac-tive and passiveactivity(Summers, 1970).
Departing from (Turney and Littman, 2003), who uses the Alta Vista advanced search with ap-proximately 350 millions web pages, we used the Waterloo corpus7, with approximately 46 millions
pages. To avoid introducing confusing heuristics, we stick to the configuration described above, but (Turney and Littman, 2003) have experimented with different configuation in computing SO-PMI-IR.
6(Turney and Littman, 2003) uses (Brill, 1994). 7http://canola1.uwaterloo.ca/.
4.1 The Typology and SO-PMI-IR
We now use the typology with an automated scor-ing method for semantic orientation. The results are presented in the form of a Confusion Matrix (CM). In this and the following matrices, the top-left cell indicates the overall accuracy8, the
POS-itive (ACTive) and NEGative (PASsive) columns represent the instances in a predicted class, the P/T column (where present) indicates the average number of patterns per text (blog post), E/P indi-cates the averageevaluationscore per pattern and
A/P indicates the average activity score per
pat-tern. Each row represents the instances in an ac-tual class9.
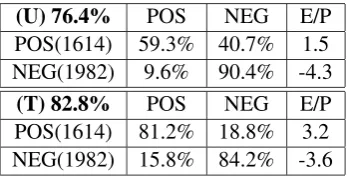
First, it is useful to get a clear idea of how the SO-PMI-IR experimental setup we presented compares with (Turney and Littman, 2003) on a human-annotated set of words according to their
evaluation dimension: the General Inquirer (GI,
(Stone, 1966)) lexicon is made of 3596 words (1614 positives and 1982 negatives)10. Table 3
summarizes the results. (Turney and Littman,
(U) 76.4% POS NEG E/P
POS(1614) 59.3% 40.7% 1.5
NEG(1982) 9.6% 90.4% -4.3
(T) 82.8% POS NEG E/P
[image:5.595.330.504.374.463.2]POS(1614) 81.2% 18.8% 3.2 NEG(1982) 15.8% 84.2% -3.6 Table 3: CM for the GI: (U)Us and (T)(Turney and Littman, 2003)
2003) reports an accuracy of 82.8% while clas-sifying those words, while our experiment yields an accuracy of 76.4% for the same words. Their results show that their classifier errs very slightly towards the negative pole (as shown by the accura-cies of both predicted classes) and has a very bal-anced distribution of the word scores (as shown by the almost equal but opposite in signs values of E/Ps). This is some evidence that the paradigm words are appropriate as near pure representations of positive and negative evaluation. By contrast, 8Recall that table 2 gives an interpretation of the statistical signifiance of accuracy, with trials≈750 and Prob(success) = 0.5.
9For example, in the comparative evaluation shown in ta-ble 3, our classifier classified 59.3% of the 1614 positive in-stances as positive and 40.7% as negative, with an average score of 1.5 per pattern.
10Note that all moods in the typology present in the GI have the same polarity forevaluationin both, which is some
our classifier appears to be more strongly biased towards the negative pole, probably due to the use of different corpora. This bias11should be kept in
mind in the interpretation of the results to come. The second experiment focuses on the words from the typology. Table 4 shows the results. The
81.1% POS NEG P/T E/P
POS(43) 60.5% 39.5% 1 0.4
NEG(47) 0.0% 100.0% 1 -6.4
66.7% ACT PAS P/T A/P
ACT(39) 33.3% 66.7% 1 -0.9
[image:6.595.316.516.133.225.2]PAS(51) 7.8% 92.2% 1 -2.9
Table 4: CM for the Typology affective states
value of 1 under P/T reflects the fact that the ex-periment amounts, in practical terms, to classify-ing the annotation of the post (a sclassify-ingle word). For theevaluationdimension, there is another shift
to-wards the negative pole of the axis, which suggests that words in the typology are distributed not ex-actly as shown on figure 1, but instead appear to have a true location shifted towards the negative pole. The activitydimension also appear to have
a negative (i.e passive) bias. There are two main possible reasons for that: words in the typology should be shifted towards the passive pole (as in theevaluationcase), or the paradigm words for the
passive pole are not pure representations of the ex-tremity of the pole12.
Having established that our classifier has a neg-ative bias for both axes, we now turn to the classifi-cation of the quadrants per se. In the next section, we used SO-PMI-IR to classify 1000 randomnly selected blog posts from our corpus, i.e 250 in each of the four quadrants. Some of these posts were found to have no pattern and were therefore not classified, which means that less than 1000 posts were actually classified in each experiment. We also report on the classification of an impor-tant subcategory of these moods called theBig Six
emotions.
11Bias can be introduced by the use of a small corpus, inad-equate paradigm words or typology. In practice, a quick fix for neutralizing bias would be to normalize the SO-PMI-IR values by subtracting the average. This work aims at tuning the model to remove bias introduced by unsound paradigm words or typology.
12At the time of experimenting, we were not aware of an equivalent of the GI to independently verify our paradigm words for activity, but one reviewer pointed out such a resource, seehttp://www.wjh.harvard.edu/ ˜inquirer/spreadsheet_guide.htm.
4.2 Results
Of the 1000 blog posts, there were 938 with at least one pattern. Table 5 shows the accuracy for the classification of these posts.
56.8% POS NEG P/T E/P
POS(475) 76.2% 23.8% 10 5.2
NEG(463) 63.1% 36.9% 9 3.5
51.8% ACT PAS P/T A/P
ACT(461) 20.6% 79.4% 8 -4.3
[image:6.595.82.281.157.247.2]PAS(477) 18.0% 82.0% 11 -4.2 Table 5: CM for all Moods
An important set of emotions found in the liter-ature (Ekman, 1972) has been termed theBig Six.
These emotions are fear, anger, happiness, sad-ness, surpriseanddisgust. We have used a
mini-mally extended set, addingloveanddesire(Cowie
and Cornelius, 2002), to cover all four quadrants (we called this set theBig Eight).Fear,angerand disgustbelong to quadrant 1,sadnessandsurprise
(we have taken it to be a synonym of ‘taken aback’ in the typology) belong to quadrant 2, love and desire (taken to be synonyms of ‘amorous’ and
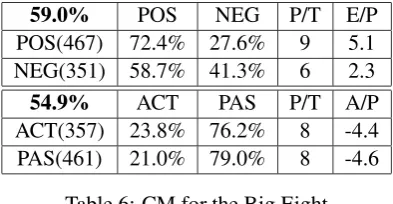
‘longing’ in the typology) belong to quadrant 3 andhappyto quadrant 4. Table 6 shows the results
for the classification of the blog posts that were tagged with one of these emotions. This amounts to classifying the posts containing only the Big Eight affective states.
59.0% POS NEG P/T E/P
POS(467) 72.4% 27.6% 9 5.1
NEG(351) 58.7% 41.3% 6 2.3
54.9% ACT PAS P/T A/P
ACT(357) 23.8% 76.2% 8 -4.4
PAS(461) 21.0% 79.0% 8 -4.6
Table 6: CM for the Big Eight
[image:6.595.318.515.495.597.2]classified the posts for which the resulting score was zero, which means that even fewer posts (741) than the previous experiment were actually evalu-ated. Table 7 shows the results for all moods and table 8 for the Big Eight.
55.7% POS NEG P/T E/P
POS(374) 53.2% 46.8% 11 0.03
NEG(367) 41.7% 58.3% 9 -0.11
53.3% ACT PAS P/T A/P
ACT(357) 21.8% 78.2% 8 -0.3
PAS(384) 17.4% 82.6% 12 -0.34 Table 7: CM for all Moods: Discrete scoring
59.8% POS NEG P/T E/P
POS(373) 52.3% 47.7% 10 0.01
NEG(354) 32.2% 67.8% 9 -0.2
52.8% ACT PAS P/T A/P
ACT(361) 25.8% 74.2% 10 -0.3
PAS(366) 20.5% 79.5% 9 -0.4
Table 8: CM for the Big Eight: Discrete scoring
4.3 Analysis of Results
Our concerns about the paradigm words for eval-uating theactivity dimension are clearly revealed
in the classification results. The classifier shows a heavy negative (passive) bias in all experiments. The overall accuracy for activity is consistently
below that for evaluation: three of them are not
statistically significant at 1% (51.8%, 53.3% and 52.8%) and two at even 5% (51.8% and 52.8%). The classifier appears particularly confused in ta-ble 5, averaging a score for active posts (-4.3) smaller than for passive posts (-4.2). It is not impossible that the moods present in the typol-ogy may have to be shifted towards the passive dimension, but further research should look first at finding better paradigm words for activity. A
good starting point for the calibration of the clas-sifier foractivityis the creation of a list of
human-annotated words foractivity, comparable in size to
the GI list, combined with an experiment similar to the one for which results are reported in table 3. With regards to the evaluation dimension,
ta-bles 5 and 6 reveal a positive bias (despite having a classifier which has a ‘built-in’ negative bias, see section 4.1). Possible explanations for this phe-nomenon include the use of irony by people in negative posts, blogs which are expressed in more
positive terms than their annotation would suggest, and failure to detect ‘negative’ contexts for pat-terns — one example of the latter is provided in table 9. This phenomena appears to be alleviated
Mood: bored (evaluation-)
Post: gah!! i neednew music, any
suggestions? by the way,
GOOD MUSIC.
Patterns: new music [JJ NN] +4.38 GOOD MUSIC [JJ NN] +53.40 Average SO: +57.78 (evaluation+)
Table 9: Missclassified post
by the use of discrete scores (see tables 7 and 8). One way of refining the scoring system is to re-duce the effect of scoring antonyms as high as syn-onyms by not counting co-occurences in the cor-pus where the word ‘not’ is in the neighbourhood (Turney, 2001). Also,
The long-term goal of this research is to be able to classify texts by locating their normal-ized scores for evaluation and activity between
-1 and +1, and we have suggested a simple method of achieving that by averaging over dis-crete scores. However, by combining individual results forevaluationandactivityfor each post13,
we can already classify text into one of the four quadrants, and we can expect the average accuracy of this classification to be approximately the prod-uct of the accuracy for each dimension. Table 10 shows the results for the classification directly into quadrants of the 727 posts already classified into halves (E±, A±) in table 8. The overall accuracy is 31.1% (expected accuracy is 59.8% * 52.8% = 31.6%). There are biases towards Q2 and Q3, but no clear cases of confusion between two or more classes.
31.1% Q1 Q2 Q3 Q4
Q1(180) 21.1% 47.8% 22.2% 8.9%
Q2(174) 15.5% 51.1% 25.3% 8.0%
Q3(192) 9.9% 42.2% 40.1% 7.8%
Q4(181) 9.4% 33.7% 44.8% 12.2%
Table 10: CM for Big Eight: Discrete scoring
Finally, our experiments show no correlation between the length of a post (in number of pat-terns) and the accuracy of the classification.
5 Conclusion and Future Work
In this paper, we have used a machine learning ap-proach to show that there is a relation between the semantic content of texts and the affective state they (wish to) convey, so that a typology of affec-tive states based on semantic association is a good description of the distribution of affect in a two-dimensional space. Using automated methods to score semantic association, we have demonstrated a method to compute semantic orientation on both dimensions, giving some insights into how to go beyond the customary ‘sentiment’ analysis. In the classification experiments, accuracies were always above a random baseline, although not always sta-tistically significant. To improve the typology and the accuracies of classifiers based on it, a better calibration of the activity axis is the most
press-ing task. Our next steps are experiments aimpress-ing at refining the translation of scores to normalized measures, so that individual affects can be distin-guished within a single quadrant. Other interest-ing avenues are studies investigatinterest-ing how well the typology can be ported to other textual data do-mains, the inclusion of a ‘neutral’ tag, and the treatment of texts with multiple affects.
Finally, the domain of weblog posts is attractive because of the easy access to annotated data, but we have found through our experiments that the content is very noisy, annotation is not always con-sistent among ‘bloggers’, and therefore classifica-tion is difficult. We should not underestimate the positive effects that cleaner data, consistent tag-ging and access to bigger corpora would have on the accuracy of the classifier.
Acknowledgement
This work was partially funded by the European Commission through the Network of Excellence EPOCH (”Excellence in Processing Open Cultural Heritage”). Thanks to Peter Turney for the provi-sion of access to the Waterloo MultiText System.
References
Eric Brill. 1994. Some advances in transformation-based part of speech tagging. Proc. of 12th National
Conference on AI. pp. 722-727. Menlo Park, CA: AAAI Press.
Kenneth Ward Church and Patrick Hanks. 1990. Word association norms, mutual information, and lexicog-raphy. Computational Linguistics. Vol. 16, No 1.
pages 22–29, MIT Press, Cambridge, MA, USA.
Roddy Cowie and Randolph R. Cornelius. 2002. De-scribing the emotional states that are expressed in speech. Speech Communication 1228. Elsevier
Sci-ence B.V.. 20 June 2002, 28 pages.
Paul Ekman. 1972. Universal and cultural differences in facial expression of emotion. J.K. Cole (Eds),
Nebraska Symposium on Motivation. pp 207-282. Lincoln, University of Nebraska Press.
Thorsten Joachims. 2001. Learning to Classify Text Using Support Vector Machines. Kluwer Academic
Publishers.
Jaap Kamps and Robert J. Mokken and Maarten Marx and Maarten de Rijke. 2004. Using WordNet to measure semantic orientation of adjectives. Proc.
of LREC 2004. Vol. IV, pages 1115-1118.
Gilad Mishne. 2005. Experiments with mood classifi-cation in blog posts. In Style2005 - the 1st
Work-shop on Stylistic Analysis Of Text For Information Access, at SIGIR 2005.
Charles E. Osgood, George J. Suci, and Percy H. Tan-nenbaum. 1957. The Measurement of Meaning.
University of Illinois.
Klaus R. Scherer. 1984. Emotion as a Multicompo-nent Process: A model and some cross-cultural data.
In P. Shaver (Ed.) Review of Personality and Social Psych. Vol. 5 (pp. 37-63). Beverley Hills, CA: Sage. H. Schmid. 1994. Probabilistic part-of-speech tagging using decision trees. In International Conf. on New
Methods in Language Processing. Manchester UK. Marc Schr¨oder and Roddy Cowie. 2005. Towards
emotion-sensitive multimodal interfaces. Invitated
talk at the Workshop on ”Adapting the interaction style to affective factors” pp. 235-253. User Mod-elling 2005, July 25, Edinburgh.
Philip J. Stone and Dexter C. Dunphy and Marshall S. Smith and Daniel M. Ogilvie. 1966. The General Inquirer: A Computer Approach to Content Anal-ysis. MIT Press. http://www.webuse.umd. edu:9090/.
Gene F. Summers. 1970. Attitude measurement.
Chicago: Rand McNally. pp. 235-253.
Peter Turney. 2001. Mining the Web for Syn-onyms: PMI-IR versus LSA on TOEFL.
Eu-ropean Conference on Machine Learning. pp 491–502. citeseer.nj.nec.com/ turney01mining.html.
Peter D. Turney. 2002. Thumbs Up or Thumbs Down? Semantic Orientation Applied to Unsuper-vised Classification of Reviews. Proc. of the ACL
2002. Philadelphia, USA. July 8-10, 2002, pp 417-424.
Peter D. Turney and Michael L. Littman. 2003. Mea-suring praise and criticism: Inference of semantic orientation from association. ACM Trans. Inf. Syst.