26
Cost Optimization Using EOQ
Mohammed Azhar Khan
1, Mohammed Irfan Qureshi
2, Abhishek N. Apte
3, I. Hassan
4, A.P. Biswas
5Abstract - In Construction Industry the problem of exceeding the estimated budget often arises and it seems quite difficult to be precise all the time. To overcome such problems the use of proper inventory control or material planning is needed which is achieved by inventory management. In any construction project the working capital comprises of 60-70% of the total cost of the project.
Thus we have developed a software on EOQ model which creates a matrix of ABC and FSN and prioritizes the materials. The software not only runs the matrix but also gives real time access by knowing the demand and lead time. Using this technique, the ongoing demand of materials can be met without any delay, at a optimum cost. Thus the cost effectiveness is achieved.
Keywords: Inventory management, EOQ, Optimum Cost, Administration.
1. INTRODUCTION
Inventory management is a science primarily about specifying the shape and percentage of stocked goods. It is required at different locations within a facility or within many locations of a supply network to precede the regular and planned course of production and stock of materials. The use of software for managing the inventory will ease the work of the storekeeper as well as give a brief overlook on management to the Administration.
2. EOQ
Economic order quantity (EOQ) is the order quantity of inventory that minimizes the total cost of inventory management.
Two most important categories of inventory costs are ordering costs and carrying costs. Ordering costs are costs that are incurred on obtaining additional inventories. They include costs incurred on communicating the order, transportation cost, etc. Carrying costs represent the costs incurred on holding inventory in hand. They include the opportunity cost of money held up in inventories, storage costs, spoilage costs, etc.
Ordering costs and carrying costs are quite opposite to each other. If we need to minimize carrying costs we have to place small order which increases the ordering costs. If we want minimize our ordering costs we have to place
few orders in a year and this requires placing large orders which in turn increases the total carrying costs for the period.
We need to minimize the total inventory costs and EOQ model helps us just do that.
Objectives- The paper has an objective to serve as a foundation for future development of software and its result will provide an optimum approach to improve the material management practices in construction industry.
•To study various models of inventory management.
•To analyze the data based on inventory techniques.
•To compare the various models and determine the most effective method
•To create a software for efficient inventory management for construction projects.
3. RESEARCH METHODOLOGY
we located an ongoing construction project in Solapur, where we collected the data to study “Inventory Management Techniques”.
We started data collection in the month of July 2015 for analyzing them using previous financial year’s (2014-2015) data available on site. We studied ‘ABC’ and ‘FSN’ models by referring various books on inventory management, journals and research papers. Based on our research and the use of materials at the site we categorized each material in both model based on their consumption rate, availability, cost, stock, etc. The software was developed using language “.NET”. The software developed, will analyze the data in both models, compare and determine the optimum result to place the future orders.
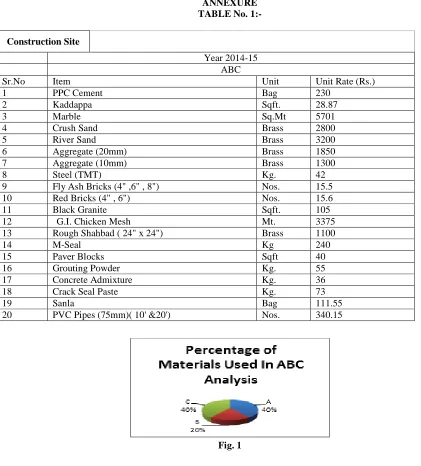
27 items in terms of cost criteria.
It is a simple approach which avoids wastage of money over use or over use of resources.
The cost of each item is multiplied by the number used in a given period and then these items are tabulated in their descending numerical value.
It is seen that the first 10% of items approximately account for the 70% the next 20% for the 20% value and the next 70% for the 10% value.
It is seen that a large number of items consume only a small percentage of resources and vice versa.
A items represent a very high cost centre, B items represent the immediate cost centers and C items represent low cost centers.
A very close control is exercised over A items while less stringent control is adequate for those in the B category and less attention for those in C category.
Refer Table1 and Figure1.
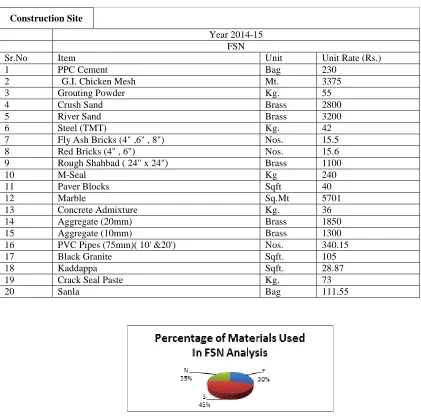
FSN Analysis - FSN classification takes into account the pattern of issues from stores. The three letters stand for fast-moving, slow moving and non-moving. This classification comes in very handy when we desire to control obsolescence. Items classified as ‘S’ and ‘N’ require attention. There may be several reasons why an item has got into ‘N’ category. There may have been a change in technology or change in the specification or a particular spare part. When a FSN classification is made, all such information stands out prominently, enabling managers to act it in the best interests of the organization. This analysis
is to help control obsolescence and is based on the consumption pattern of the items. The items are analyzed to be classified as Fast-moving (F), Slow-moving (S) and Non-moving (N) items. The Non-moving items (usually not consumed over a period of two years) are of great importance. Scrutiny of non-moving items is to be made to determine whether they could be used or be disposed off. The fast and slow-moving classifications help in arrangement of stock in stores and their distribution and handling methods.
Refer Table2 and Figure2.
5. CONCLUSION
The developed software will be useful for the following:
•Easy comparison: Various methods of to procure the materials can be compared easily, prompting the optimum result.
•Versatility in use: The software can be used in any type of construction project and the administration can easily monitor the inventory.
•Prediction: The amount of materials to be ordered will be prompted based on the consumption rate.
•Cost Saving: It will prompt the optimum method to procure materials which would reduce the cost of materials.
REFERENCES
[1] Anuprakash.N. And Nadhini.N . “Study On Stock
Management Practices In Construction Companies” , Research Journal of Management
Sciences, Vol. 2(4), 7-13, April 2013
[2] Abayomi. T. Onanuga and Adeyemi. A. Adekunle.
“Dynamics of Inventory Cost Optimization – “A Review ofTheory and Evidence” P.M.B 2002, Ago-Iwoye, Nigeria, Vol5, No.22, 2014
[3] Dr.G.Brindha, “Inventory Management”,
International Journal of InnovativeResearching Science Engineering and Technology, Vol.3. Issue 1, January 2014
[4] Mitra, Sujit Kumar Pattanayak & Papiya Bhowmik, “Inventory control using ABC and HML”, A case study on a manufacturing industry [5] Vaisakh P. S., Dileeplal J., V. Narayanan Unni,
“Inventory Management of Construction Materials by Combined FSN and VED (CFSNVED) Analysis”, International Journal of Research and Innovative Technology, Vol.2, Issue 7, January 2013
[6] R. C. WALKE and PROF. Dr. V.M. TOPKAR, “Risk Quantification Model for Construction Projects using Score Model and EV Analysis approach”, International Journal for Enginnering Research and Applications, Vol.2, Issue 3, June 2012.
[7] Prof. Deepak .P. Patil , “Study of Cost Control on Construction Project”, International Journal for Engineering Research, Vol. 2, Issue 5, May 2011 [8] S.Sindhu , Dr.K.Nirmalkumar , V.Krishnamoorthy,
“Performance Analysis of Inventory Management System in Construction Industries in India”, International Journal for Engineering Research, Vol. 1, Issue 2, July 2012
[9] Scott Grant Eckert, “Inventory Management and Its Effects on Customer Satisfaction”, JBPP, Vol 2, January 2012
28 “Improving On-site Material Tracking In
Construction Project” JBPP, Vol 2, July 2012 [11] 'Inventory Management' by L.C.JHAMB
Authors:
29 TABLE No. 2:-
Construction Site
Year 2014-15 FSN
Sr.No Item Unit Unit Rate (Rs.)
1 PPC Cement Bag 230
2 G.I. Chicken Mesh Mt. 3375
3 Grouting Powder Kg. 55
4 Crush Sand Brass 2800
5 River Sand Brass 3200
6 Steel (TMT) Kg. 42
7 Fly Ash Bricks (4" ,6" , 8") Nos. 15.5
8 Red Bricks (4" , 6") Nos. 15.6
9 Rough Shahbad ( 24" x 24") Brass 1100
10 M-Seal Kg 240
11 Paver Blocks Sqft 40
12 Marble Sq.Mt 5701
13 Concrete Admixture Kg. 36
14 Aggregate (20mm) Brass 1850
15 Aggregate (10mm) Brass 1300
16 PVC Pipes (75mm)( 10' &20') Nos. 340.15
17 Black Granite Sqft. 105
18 Kaddappa Sqft. 28.87
19 Crack Seal Paste Kg. 73
20 Sanla Bag 111.55