Network Features Based Co-hyponymy Detection
Abhik Jana, Pawan Goyal
Indian Institute of Technology Kharagpur, Indian Institute of Technology Kharagpur [email protected], [email protected]
Abstract
Distinguishing lexical relations has been a long term pursuit in natural language processing (NLP) domain. Recently, in order to detect lexical relations like hypernymy, meronymy, co-hyponymy etc., distributional semantic models are being used extensively in some form or the other. Even though a lot of efforts have been made for detecting hypernymy relation, the problem of co-hyponymy detection has been rarely investigated. In this paper, we are proposing a novel supervised model where various network measures have been utilized to identify co-hyponymy relation with high accuracy performing better or at par with the state-of-the-art models.
Keywords:Co-hyponymy detection, Distributional thesaurus network, Complex network measures.
1.
Introduction
Automatic detection of lexical relations is a fundamental task for natural language processing (NLP). Numerous ap-plications including paraphrasing, query expansion, recog-nizing textual entailment, ontology building, metaphor de-tection etc. are benefited by precise relation classification and relation discovery tasks. For example, it may be diffi-cult to interpret a sentence containing a metaphor, like “He drowned in a sea of grief” if we go by the literal mean-ing. But if we replace ‘drowned’ by its co-hyponym ‘over-whelmed’ and ‘sea’ by its co-hyponym ‘lot’, it immediately provides an inference. Note that, ‘drown’ and ‘overwhelm’ are (co-)hyponyms for the concept ‘cover’ whereas ‘sea’ and ‘lot’ are (co-)hyponyms for the concept ‘large indefi-nite amount’ as per WordNet (Miller, 1995).
Lexical relations are of variety of types like hyponyms, hypernyms, co-hyponyms, meronyms etc. Among these, some relations are symmetric (co-hyponymy) and some are asymmetric (hypernymy, meronymy). With the advance-ment of distributional semantics representation of words, researchers have attempted to identify lexical relations in both supervised and unsupervised ways.
One of the oldest attempt for detection of hypernymy ex-traction dealt with finding out ‘lexico-syntactic patterns’ proposed by Hearst (1992). A lot of attempts have been made for hypernymy extraction using knowledge bases like Wordnet, Wikipedia and hand crafted patterns or patterns learnt from the corpus (Cederberg and Widdows, 2003; Ya-mada et al., 2009). With the emergence of the trend of applying distributional hypothesis (Firth, 1957) to solve this relation classification task, researchers have started us-ing Distributional Semantic Models (DSM) and have come up with several directional measures (Roller et al., 2014; Weeds et al., 2014; Santus et al., 2016; Shwartz et al., 2017; Roller and Erk, 2016). Specifically for hypernymy detection, researchers also used a variant of distributional hypothesis, i.e., distributional inclusion hypothesis (Gef-fet and Dagan, 2005) according to which the contexts of a narrow term are also shared by the broad term. Recently, entropy-based distributional measure (Santus et al., 2014) has also been tried out for the same purpose. In some of the recent attempts (Fu et al., 2014; Yu et al., 2015; Nguyen et al., 2017), people have tried several
embed-ding schemes for hypernymy detection. One interesting attempt was made by Kiela et al. (2015), where they ex-ploited image generality for lexical entailment detection. Most of the attempts made for meronymy detection are mainly pattern based (Berland and Charniak, 1999; Girju et al., 2006; Pantel and Pennacchiotti, 2006). Later, in-vestigations have been made for the possibility of using distributional semantic models for part-of relations detec-tion (Morlane-Hond`ere, 2015). As far as co-hyponymy detection is concerned, researchers have tried with several DSMs and measures for distinguishing hypernyms from co-hyponyms but the number of attempts is very small. One such attempt is made by Weeds et al. (2014), where they proposed a supervised framework and used several vector operations as features for the classification of hypernymy and co-hyponymy. In one of the recent work (Santus et al., 2016), a supervised method based on a Random Forest algorithm has been proposed to learn taxonomical seman-tic relations and they have shown that the model performs good for co-hyponymy detection.
distributional thesauri (DT) network (Riedl and Biemann, 2013) built using Google books syntactic n-grams. We hy-pothesize that, if two words are having ‘co-hyponymy’ re-lationship, then those words are distributionally more simi-lar compared to the words having hypernymy, meronymy relationship or any random pair of words. In order to capture the distributional similarity between two words in the DT network, we are proposing the following five net-work measures for each word pair: (i) structural similar-ity (SS), (ii) shortest path (SP), (iii) weighted shortest path (SP W), (iv) edge density among the intersection of neighborhoods(EDin), (v) edge density among the union of neighborhoods (EDun). A remarkable observation is that although this is a small set of only five features, they are able to successfully discriminate co-hyponymy from hyper-nymy, meronymy and random pairs with high accuracy. Classification model:We use these five network measures as features to train classifiers like SVM, Random Forest to distinguish the word pairs having co-hyponymy relation from the word pairs having hypernymy or meronymy rela-tion, or from any random pair of words.
Evaluation results:We evaluate our approach by three ex-periments. In the first two experiments, taking two dif-ferent baselines (Weeds et al., 2014; Santus et al., 2016), we follow their experimental setup as well as their publicly available dataset and show that using our proposed network features, we are able to improve the accuracy of the co-hyponymy detection task. In the third experiment, we pre-pare three datasets extracted from BLESS dataset (Baroni and Lenci, 2011) for three binary classification tasks: hyponymy vs Random, hyponymy vs Meronymy, Co-hyponymy vs Hypernymy and show that we get consistent performance as the previous two experiments, achieving ac-curacy in the range of 0.73-0.97. We have made these three datasets publicly available1.
2.
Methodology
As a graph representation of words, we use distributional thesauri (DT) network (Riedl and Biemann, 2013) from the Google books syntactic n-grams data (Goldberg and Or-want, 2013) spanning from 1520 to 2008. In a graph struc-ture, the DT contains for each word a list of words that are similar with respect to their bi-gram distribution (Riedl and Biemann, 2013).
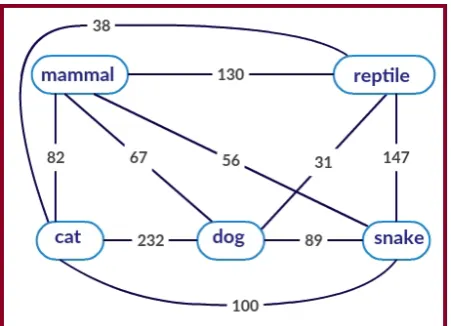
In the network, each word is a node and there is a weighted edge between a pair of words where the weight of the edge is defined as the number of features that these two words share in common. A snapshot of the DT is shown in Figure 1. Our hypothesis is that the word pairs hav-ing co-hyponymy relation are distributionally more sim-ilar than the words having hypernymy or meronymy re-lation or any random pair of words. Now, if two words are distributionally similar, it will be reflected in the DT network in that they will exist in close proximity, their neighborhood will contain similar nodes and the connec-tions among their neighborhood will be dense. In order to capture the notion of distributional similarity among the word pairs, we choose five cohesion indicating network
[image:2.595.310.536.67.230.2]1http://tinyurl.com/y99wfhzb
Figure 1: A sample snapshot of Distributional Thesaurus Network where each node represents a word and the weight of edge between two words is defined as the number of context features that these two words share in common. Here the word ‘cat’ shares more context features with its co-hyponym ‘dog’ compared to their common hypernym ‘mammal’.
properties: (i) structural similarity (SS), (ii) shortest path (SP), (iii) weighted shortest path (SP W), (iv) edge den-sity among the intersection of neighborhoods (EDin), (v) edge density among the union of neighborhoods (EDun). Let(wi, wj)be the pair of words for which we compute the following network measures
-Structural Similarity (SS): The structural similarity SS(wi, wj)is computed as:
SS(wi, wj) =
Nc
p
deg(wi)∗deg(wj) (1)
whereNcdenotes the number of common neighbors ofwi andwj anddeg(wk)denotes the degree ofwk in the DT graph, fork=i, j.
Shortest Path (SP):This is a measure of distance of the shortest path betweenwiandwjin DT network.
Weighted Shortest Path (SPW): The weighted shortest pathSP W(wi, wj)is computed as:
SP W(wi, wj) =SP(wi, wj)−EWaverage
EWmax (2)
where SP(wi, wj) gives the length of the shortest path between wi and wj; EWaverage gives the average edge weight along the shortest path; EWmax gives the maxi-mum edge weight in the DT network, which is 1000 in our case.
Edge density among the intersection of neighborhoods (EDin):
EDin(wi, wj) = #(Ain)/#(Pin) (3)
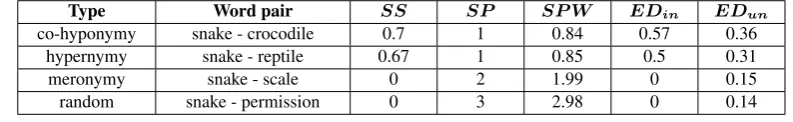
Type Word pair SS SP SP W EDin EDun co-hyponymy snake - crocodile 0.7 1 0.84 0.57 0.36
[image:3.595.95.492.69.130.2]hypernymy snake - reptile 0.67 1 0.85 0.5 0.31 meronymy snake - scale 0 2 1.99 0 0.15 random snake - permission 0 3 2.98 0 0.14
Table 1: The network properties of sample cases taken from BLESS dataset.
i.e., n(n−2 1).
Edge density among the union of neighborhoods (EDun):
EDun(wi, wj) = #(Aun)/#(Pun) (4)
whereAundenotes actual edges present between the union of neighbors ofwiandwjandPundenotes the maximum possible between the union of neighbors.
The feature SS captures mainly the degree of overlap of the neighborhoods of the word pairs, whereas SP W and SP indicate the distance between them in the DT network by considering and not considering the weight of the edges along the shortest path, respectively. The intuition behind taking these features is that if two words are distributionally very similar, there should be a short path between the two words via common neighbors. We observe in the DT net-work that, sometimes only the length of the shortest path is not enough to indicate the distributional similarity be-tween two words; the average edge weight along the short-est path provides the hints of similarity between two words as well. This is the intuition behind proposing the mea-sureSP Walong withSP. The last two proposed features, EDinandEDun, capture the degree of closeness between the neighborhood of the word pair. Table 1 notes the val-ues obtained for these network properties for sample pair of words for each relation type extracted from BLESS dataset. It is clearly seen that theSP,EDinandEDunvalues are higher for co-hyponymy pairs compared to other relations and the other two featuresSPandSP Ware comparatively lower, justifying the fact that co-hyponymy pairs are distri-butionally more similar and the words exist in close prox-imity in the DT network.
We now use these five features in different classifiers like SVM, Random Forest (as used in the baseline systems) to discriminate the co-hyponym word pairs from the word pairs having hypernymy or meronymy relation or any ran-dom pairs of word.
3.
Experimental Results and Analysis
As our main focus is classification of co-hyponymy rela-tion, one of the key challenges has been to construct a dataset. Most of the gold standard datasets used for eval-uation of the systems discriminating lexical relations, do not contain word pairs having co-hyponymy relation. We find two baseline systems (Weeds et al., 2014; Santus et al., 2016) where the authors use gold standard datasets which contain co-hyponymy pairs and they have done classifica-tion of co-hyponym pairs as well. We plan to evaluate our approach, by executing three experiments. In the first two experiments, we use the same experimental setup as well as the gold standard dataset of two baseline papers as used bythe authors above. In the third experiment, we prepare our dataset from BLESS and do binary classification between co-hyponymy and other relations separately.
Experiment 1: In the first experiment, we directly use
cohyponymBLESS, the gold standard dataset prepared
by (Weeds et al., 2014) from BLESS dataset (Baroni and Lenci, 2011). It contains 5,835 labelled pair of nouns, where for each BLESS concept, the co-hyponyms are con-sidered as positive examples and the same total number of (and split evenly) hypernyms, meronyms and random words is taken as the negative examples. In addition to that, the order of 50% of the pairs is reversed and duplicate pairs are disallowed. We use the same experimental setup of us-ing SVM classifier with ten-fold cross validation as used by Weeds et al. (2014) for this co-hyponymy classification task. Weeds et al. (2014) represent each word as positive point wise mutual information (PPMI) based feature vec-tor and then try to classify the relation between the given pair of words by feeding the word vectors to the classifier models using different vector operations. The details of the baselines as defined by Weeds et al. (2014) are presented in Table 2.
Baseline Model
Description
svmDIFF A linear SVM trained on the vector difference
svmMULT A linear SVM trained on the pointwise product vector
svmADD A linear SVM trained on the vector sum svmCAT A linear SVM trained on the vector
concatenation
svmSING A linear SVM trained on the vector of the second word in the given word pair knnDIFF knearest neighbours (knn) trained on the
vector difference
cosineP The relation between word pair holds if the cosine similarity of the word vectors is
greater than some thresholdp
linP The relation between word pair holds if the lin similarity (Lin, 1998) of the word
vectors is greater than some thresholdp
most freq The most frequent label in the training data is assigned to every test point.
Table 2: Descriptions of the baseline models as described in (Weeds et al., 2014)
using all five features together in a SVM classifier but it gives the same performance as using SS only. We see that, instead of representing words as vectors and using several vector operations as features to SVM, simple net-work measures computed from Distributional Thesaurus Network lead to better or comparable performance. The network features are so strong that using any single fea-ture, we achieve better performance compared to the su-pervised baselines (first 6 entries in Table 3) and the na¨ıve baseline of taking the most frequent label in the training data. On the other hand, we achieve comparable perfor-mance to the weakly supervised threshold based models (cosineP and linP) whereas for some features we beat those baselines gaining accuracy gain of 5% with respect to the most competitive one.
Model Accuracy
Baselines
svmDIFF 0.62
svmMULT 0.39
svmADD 0.41
svmCAT 0.40
svmSING 0.40
knnDIFF 0.58
cosineP 0.79
linP 0.78
most freq 0.61
Our models
svmSS 0.84
svmSP 0.83
svmSPW 0.83
svmEDin 0.78
[image:4.595.306.541.163.278.2]svmEDun 0.76
Table 3: Accuracy scores for cohyponymBLESS
dataset of our model along with the models described in (Weeds et al., 2014)
Experiment 2: In the second experiment, we use ROOT9 dataset, prepared by Santus et al. (2016). It contains 9600 labelled pairs randomly extracted from three datasets: EVALution (Santus et al., 2015), Lenci/Benotto (Benotto, 2015) and BLESS (Baroni and Lenci, 2011). The dataset is evenly distributed among the three classes (hypernyms, co-hyponyms and random) and involves three types of parts of speech (noun, verb, adjective). The full dataset contains a total of 4,263 distinct terms consisting of 2,380 nouns, 958 verbs and 972 adjectives. Here also, we use the same experimental setup of using Random Forest classifier with ten-fold cross validation as done by (Santus et al., 2015). We have put all the five network measures as features to the classifier. We try with all the combinations of the five features and get the best performance when all of those features are used together. The performance of our model along with the baselines are presented in Table 4. We see that in the binary classification task of Co-hyponym vs Ran-dom, we outperform all the state-of-the-art models in terms of F1 score whereas for Co-hyponym vs Hypernym classifi-cation task, our model beats the performance of most of the baseline models and produces comparable performance to the best models. Note that, using only five simple network measures as features we are able to get good performance,
which leads to the fact that coming up with some useful fea-tures intelligently can help in improving the performance of the otherwise difficult task of co-hyponymy detection. Investigating the DT network more deeply and coming up with some more sophisticated measures for co-hyponymy discrimination specially from hypernymy would definitely be the immediate future work.
Method Co-Hyp vs
Random
Co-Hyp vs Hyper
ROOT13 97.4 94.3
ROOT9 97.8 95.7
-using SMO 93.0 77.3
-using Logistic 95.3 78.7
COSINE 79.4 69.8
RANDOM13 51.4 50.1
[image:4.595.64.276.262.445.2]Our Model 99.0 87.0
Table 4: Percentage F1 scores of our model along with the models described in (Santus et al., 2016) on a 10-fold cross validation for binary classification.
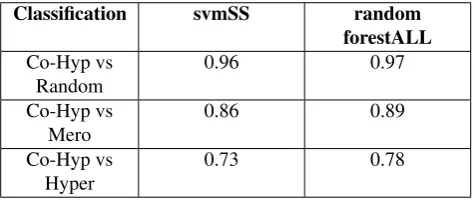
Experiment 3:The two experiments discussed so far show that using the proposed five network measures in classifiers gives better performance than the state-of-the-art models in the baseline datasets. Further, in order investigate the robustness of our approach, we create our own dataset ex-tracted from BLESS (Baroni and Lenci, 2011) for three bi-nary classification tasks: Co-Hypo vs Hyper, Co-Hypo vs Mero, Co-Hypo Vs Random. For each of these tasks we have taken 1,000 randomly extracted pairs for positive in-stance (co-hyponymy pair) and 1,000 randomly extracted pairs for negative instance (hypernymy, meronymy and ran-dom pair, respectively). We have tried with both SVM and Random Forest classifiers with different combination of the proposed five features. Table 5 presents the result of the best feature combination for both the classifiers for each of the binary classification task separately. We see that the performance of SVM classifier with only one fea-ture structural similarity (SS) and Random Forest classifier with all the five features together provide good performance for all three binary classification tasks, consistent with the first two experiments. Note that, even though we get ac-curacy in the range of0.86-0.97 while discriminating co-hyponym pairs from meronym or random pairs, we do not achieve highly accurate results when it comes to classifica-tion against hypernym pairs, indicating the fact that words having hypernymy relation and words having co-hyponymy relation may be having similar kind of neighborhood in the DT network, and further research is needed to discriminate between these using network measures only.
4.
Conclusion
Classification svmSS random forestALL Co-Hyp vs
Random
0.96 0.97
Co-Hyp vs Mero
0.86 0.89
Co-Hyp vs Hyper
[image:5.595.52.290.68.168.2]0.73 0.78
Table 5: Accuracy scores of on a 10-fold cross valida-tion for binary classificavalida-tion using SVM and Random forest classifier.
beat the performance of most of the state-of-the-art models. Note that, applying distributional hypothesis to a corpus to build a Distributional Thesaurus (DT) network and comput-ing small number of simple network measures is less com-putationally intensive compared to preparing vector repre-sentation of words. So in that sense this work contributes to an interesting finding that by applying complex network theory, we can devise an efficient supervised framework for co-hyponymy detection which performs better or at par in some cases, compared to the heavy-weight state-of-the-art models.
The next immediate step is to use the proposed supervised features to guide in building unsupervised measures for co-hyponymy detection. In future, we plan to come up with some more sophisticated complex network measures like degree centrality, betweenness centrality etc. to be used for more accurate co-hyponymy detection. We also would like to investigate the possibilities of detecting hypernymy, meronymy relations with some asymmetric network mea-sures. Finally, our broad objective is to build a general supervised and unsupervised framework based on complex network theory to detect different lexical relations from a given a corpus with high accuracy.
5.
Bibliographical References
Antiqueira, L., Nunes, M. d. G. V., Oliveira Jr, O., and Costa, L. d. F. (2007). Strong correlations between text quality and complex networks features. Physica A: Sta-tistical Mechanics and its Applications, 373:811–820. Baroni, M. and Lenci, A. (2011). How we blessed
distribu-tional semantic evaluation. InProceedings of the GEMS 2011 Workshop on GEometrical Models of Natural Lan-guage Semantics, pages 1–10. Association for Computa-tional Linguistics.
Berland, M. and Charniak, E. (1999). Finding parts in very large corpora. InProceedings of the 37th annual meet-ing of the Association for Computational Lmeet-inguistics on Computational Linguistics, pages 57–64. Association for Computational Linguistics.
Cederberg, S. and Widdows, D. (2003). Using lsa and noun coordination information to improve the precision and recall of automatic hyponymy extraction. In Pro-ceedings of the seventh conference on Natural language learning at HLT-NAACL 2003-Volume 4, pages 111–118. Association for Computational Linguistics.
Ferrer i Cancho, R. and Sol´e, R. V. (2001). The small world of human language. Proceedings of
the Royal Society of London B: Biological Sciences, 268(1482):2261–2265.
Ferrer i Cancho, R., Capocci, A., and Caldarelli, G. (2007). Spectral methods cluster words of the same class in a syntactic dependency network. International Journal of Bifurcation and Chaos, 17(07):2453–2463.
Ferrer i Cancho, R. (2004). R.; koehler, r.; sol´e, rv pat-terns in syntactic dependency networks. Phys. Rev. E, 69:32767.
Firth, J. R. (1957). A synopsis of linguistic theory, 1930-1955.Studies in linguistic analysis.
Fu, R., Guo, J., Qin, B., Che, W., Wang, H., and Liu, T. (2014). Learning semantic hierarchies via word embed-dings. InACL (1), pages 1199–1209.
Geffet, M. and Dagan, I. (2005). The distributional inclu-sion hypotheses and lexical entailment. In Proceedings of the 43rd Annual Meeting on Association for Computa-tional Linguistics, pages 107–114. Association for Com-putational Linguistics.
Girju, R., Badulescu, A., and Moldovan, D. (2006). Auto-matic discovery of part-whole relations. Computational Linguistics, 32(1):83–135.
Hearst, M. A. (1992). Automatic acquisition of hyponyms from large text corpora. InProceedings of the 14th con-ference on Computational linguistics-Volume 2, pages 539–545. Association for Computational Linguistics. Kiela, D., Rimell, L., Vulic, I., and Clark, S. (2015).
Ex-ploiting image generality for lexical entailment detec-tion. InProceedings of the 53rd Annual Meeting of the Association for Computational Linguistics (ACL 2015), pages 119–124. ACL.
Lin, D. (1998). Automatic retrieval and clustering of simi-lar words. InProceedings of the 17th international con-ference on Computational linguistics-Volume 2, pages 768–774. Association for Computational Linguistics. Miller, G. A. (1995). Wordnet: a lexical database for
en-glish.Communications of the ACM, 38(11):39–41. Morlane-Hond`ere, F. (2015). What can distributional
se-mantic models tell us about part-of relations? In Net-WordS, pages 46–50.
Nguyen, K. A., K¨oper, M., Schulte im Walde, S., and Vu, N. T. (2017). Hierarchical embeddings for hyper-nymy detection and directionality. InProceedings of the 2017 Conference on Empirical Methods in Natural Lan-guage Processing, pages 233–243, Copenhagen, Den-mark, September. Association for Computational Lin-guistics.
Pantel, P. and Pennacchiotti, M. (2006). Espresso: Lever-aging generic patterns for automatically harvesting se-mantic relations. In Proceedings of the 21st Interna-tional Conference on ComputaInterna-tional Linguistics and the 44th annual meeting of the Association for Computa-tional Linguistics, pages 113–120. Association for Com-putational Linguistics.
Riedl, M. and Biemann, C. (2013). Scaling to large3 data: An efficient and effective method to compute distribu-tional thesauri. InEMNLP, pages 884–890.
dis-tributional vectors for lexical entailment. InProceedings of the 2016 Conference on Empirical Methods in Natural Language Processing, pages 2163–2172, Austin, Texas, November. Association for Computational Linguistics. Roller, S., Erk, K., and Boleda, G. (2014). Inclusive yet
se-lective: Supervised distributional hypernymy detection. InCOLING, pages 1025–1036.
Santus, E., Lenci, A., Lu, Q., and Im Walde, S. S. (2014). Chasing hypernyms in vector spaces with entropy. In EACL, pages 38–42.
Santus, E., Lenci, A., Chiu, T.-S., Lu, Q., and Huang, C.-R. (2016). Nine features in a random forest to learn taxonomical semantic relations. In Proceedings of the Tenth International Conference on Language Resources and Evaluation (LREC 2016), Paris, France, may. Euro-pean Language Resources Association (ELRA).
Shwartz, V., Santus, E., and Schlechtweg, D. (2017). Hy-pernyms under siege: Linguistically-motivated artillery for hypernymy detection. In Proceedings of the 15th Conference of the European Chapter of the Associa-tion for ComputaAssocia-tional Linguistics: Volume 1, Long Pa-pers, pages 65–75, Valencia, Spain, April. Association for Computational Linguistics.
Weeds, J., Clarke, D., Reffin, J., Weir, D., and Keller, B. (2014). Learning to distinguish hypernyms and co-hyponyms. In Proceedings of COLING 2014, the 25th International Conference on Computational Linguistics: Technical Papers, pages 2249–2259. Dublin City Uni-versity and Association for Computational Linguistics. Yamada, I., Torisawa, K., Kazama, J., Kuroda, K., Murata,
M., De Saeger, S., Bond, F., and Sumida, A. (2009). Hypernym discovery based on distributional similarity and hierarchical structures. InProceedings of the 2009 Conference on Empirical Methods in Natural Language Processing: Volume 2-Volume 2, pages 929–937. Asso-ciation for Computational Linguistics.
Yu, Z., Wang, H., Lin, X., and Wang, M. (2015). Learn-ing term embeddLearn-ings for hypernymy identification. In IJCAI, pages 1390–1397.
6.
Language Resource References
Baroni, M. and Lenci, A. (2011). How we blesseddistribu-tional semantic evaluation. InProceedings of the GEMS 2011 Workshop on GEometrical Models of Natural Lan-guage Semantics, pages 1–10. Association for Computa-tional Linguistics.
Benotto, G. (2015). Distributional Models for Semantic Relations: A Study on Hyponymy and Antonymy. Goldberg, Y. and Orwant, J. (2013). A dataset of
syntactic-ngrams over time from a very large corpus of english books. InSecond Joint Conference on Lexical and Com-putational Semantics (* SEM), volume 1, pages 241– 247.
Santus, E., Yung, F., Lenci, A., and Huang, C.-R. (2015). Evalution 1.0: an evolving semantic dataset for training and evaluation of distributional semantic models. In Pro-ceedings of the 4th Workshop on Linked Data in Linguis-tics (LDL-2015), pages 64–69.
Weeds, J., Clarke, D., Reffin, J., Weir, D., and Keller, B. (2014). Learning to distinguish hypernyms and