65
Analyzing Environmental Performance of Green
Manufacturing (GM) Initiative using Principal
Component Analysis and Multiple Regression Method
in Indian Context
Sunil Satao
1, Dr.Vivek Yakkundi
2Department of Mechanical Engineering
1, Department of Mechanical Engineering
2Lokmanya Tilak College of Engineering, Navi Mumbai
1, India, Lokmanya Tilak College of
Engineering, Navi Mumbai
2,India
Abstract- Green manufacturing (GM) initiative to improve environmental performance is one of the important issues in Indian industries in recent decade. This research work emphasizes on statistical analysis of key factors playing significant role in the success of Green manufacturing initiatives in Indian industries. A questionnaire consists of independent and dependent variable was prepared as a data collection instrument and data is collected from Mumbai region (India) based industries. Principal component analysis of both independent and dependent variables is carried out separately by using SPSS 21 package as a statistical tool. Multiple Regression analysis is used to test empirical model and hypothetical relationship is verified. The results show that GM initiative has significant impact on environmental performance.
Index Terms- Green Manufacturing (GM), Green Design (GD), Factor analysis, Multiple Regression
1. INTRODUCTION
Green manufacturing (GM) is a term used to describe manufacturing practices that do not harm the environment during any part of the manufacturing process. It emphasis the manufacturing processes that do not pollute the environment or harm consumers, employees, or other members of community (Minhaj Ahemad A.Rehman et al.2013). Melnyk and Smith (1996) defined Green manufacturing as “a system that integrates product and process design issues with issues of manufacturing planning and control in such a manner as to identify, quantify, assess, and manage the flow of environmental waste with the goal of reducing and ultimately minimizing environmental impact while also trying to maximize resource efficiency”. Environmental performance is defined as “the result of an organization’s management of its environmental aspect (ISO, 1999).It indicates the organization’s influence on living and non-living natural systems, including ecosystems, land, air, and water” (Bulent Sezen et al.2013).
In recent decade, there has been increased pressure on manufacturers to think beyond the economic benefits of their manufacturing methods and products and consider the environmental and social affects. Toxic wastes and pollution created by industries are causing crisis for thousands of communities around the world. Even more threatening, global crises such as ozone depletion, greenhouse warming, deforestation and the loss of biodiversity are in one way or another rooted in corporate products and production methods. Such environmental problems are sounding a fear for the public. People are very much concerned about
environmental degradation and about the continued functioning of the Earth's natural systems. The environmental liabilities that we are leaving behind for the new generation may be beyond their capacity of handling (Paul Shrivastava et al.1995).
Execution of Green manufacturing practices is one of the important issues in Indian enterprises due to public pressure, government regulations and need of market. This paper emphasizes on Statistical analysis of key factors playing significant role in the success of Green manufacturing initiative to improve environmental performance in Indian industries with Mumbai region industries as a case study. The data collected through questionnaire from 310 Mumbai region industries is analyzed by Principal component analysis and Multiple regression method.
2. REVIEW OF LITERATURE
66 Many researchers have defined GM by different ways.
According to Devi s. Kalla et al. (2008), “GM is an emerging field in recent years and is also helpful in sustainable development for modern manufacturing industries. Sustainable green manufacturing emerges the thought of combining technical issues of design and manufacturing, energy preservation, prevention, health and safety of communities and customers”. According to Arindam Bhattacharya et al. (2011), “Green manufacturing involves transformation of industrial operations in three ways: (1) designing and developing Green products, (2) using green manufacturing processes, and (3) using Green energy”. According to Deif et al.(2011), “ Green manufacturing is a sustainable approach to the design and engineering activities involved in product improvement and/or system operation to minimize environmental impact”. As per Dornfeld (2013), “Green manufacturing is about implementing any kind of replacement in the manufacturing procedure which leads to a fall in energy consumption, resource utilization, waste by-products, and water utilization. Means the step that makes the manufacture of a product, component or part of a system additional sustainable can be termed as Green manufacturing”. As per Cortellini (2001), “Green manufacturing is a method of manufacturing that reduces waste and pollution, slows the depletion of natural resources as well as reduces the extensive amounts of trash that enter the landfills”. According to Atlas and Florida (1998), “Green manufacturing involves manufacturing processes with relatively less environmental impacts, capable, and generates no waste”. As per Mihelcic J. R. et al.(2011), “Green manufacturing is the creation of manufactured products that utilize processes which reduces harmful environmental impacts, preserve energy and natural resources and are safe for staff, communities, and consumers and are economically beneficial”.
Many researchers have attempted quantitative statistical analysis of performance measures of GM using different statistical methods for different products, sample size, geographical survey areas using appropriate questionnaire. Bulent Sezen et al. (2013) have investigated the pressure of green manufacturing and eco-innovation on corporate sustainability performance like economic, environmental, and social by collecting data through a questionnaire-based survey across 53companies from automotive, chemical and electronic sectors in Turkey. Regression analysis was used to test empirical model and to verify the hypothetical relationships of the study. The results of this testing indicate that the green manufacturing applications have a major positive impact on environmental performance and social performance. The research of Denis Boret Cordoba and Alireza Veshagh (2013) studied the principles of eco-design
multi-67 criteria judgment making. The data was collected from
195 Indian MSMEs through questionnaires comprising of 15 items revealed a six factor structure. This research has come to conclusion that GM relates to greening of product design, design of untreated materials, process, technology, packaging matter and packaging plan. Minhaj Ahemad Abdul Rehman and Rakesh L. Shrivastava (2013) have undertaken survey to find the extent of awareness and execution of GM practices within various medium and small industries (MSE) in the Vidharbha region of Maharashtra, India. In this study, an approach was made to develop an instrument to find the status of awareness and execution of GM in this section. It also aimed at developing and validating performance measures for GM in Indian context that could be utilized by manufacturers in improving their environmental performance. The data was collected from 65 medium and small industries from said region through an appropriate questionnaire consist of 27 questions. The author found that the execution of GM by industries is still at very early stage and a lot of efforts to be put to lift levels of awareness and to convince them the need and probable benefits of GM. The study of Kuldip Singh Sangwan (2011) was intended to identify the application as well as quantitative and qualitative benefits of GM for the managers who are considering GM introduction in the organization .Data is collected by survey of 198 Indian SMEs in India, using a questionnaire developed for this study. The collected data is analyzed by using SPSS statistical tool to validate the quantitative and qualitative benefits of GM. The results of reliability and validity analyses, give sure confirmation that the identified benefits are greatly reliable and applicable for the Indian SMEs. The research of R.P. Mohanty & Anand Prakash (2014) illustrates the application of Structural Equation Modeling (SEM) to recognize the green supply chain management (GSCM) practices relating to Micro, Small, and Medium Enterprises (MSME) in India by collecting data from 114 industries through a properly designed questionnaire. This study intends to learn whether the greening scores measure a common construct called GSCM and whether external and internal stress due to stakeholders have any control on GSCM practices when differences are controlled for different types of MSME and different environment of industries of MSME in Indian context. This study confirms and validates that the lower level of GSCM involvement of Indian MSME can be attributed to be short of the necessary external and internal stresses.
With the help of literature review in the context of GM implementation, research gaps are identified and viewed from the perspective of these gaps, it is decided to investigate effect of GM initiative on environmental performance with Mumbai region(India) as a case study. The major aspects of
need of this research are considerable development of Indian industrial sectors, rising population and their demands, rising pollution, degradation of natural resources etc. The geographical survey area of industries in this research is metropolitan city, Mumbai and adjustment towns/sectors viz. Thane, Navi Mumbai, Dombivali, Kalyan, Ambernath, Taloja, Rasayani, and Bhivandi of Maharashtra state, India. This region pays special attention for this research due to more number of industries, highly densed population due to non availability of land, and rising pollution due to industries etc. Mumbai city is one of the metropolitan cities of India and considered as financial capital of India.
3. METHODOLOGY OF INVESTIGATION After viewing different methodology of quantitative analysis, an appropriate quantitative approach was chosen as the tool of research to identify and validate a set of performance measure for Green Design (GD) and Green Manufacturing (GM) Practices being used in Mumbai region. A set of questionnaires, which is adapted based on past research, was used to measure the variables.
3.1 Design of data gathering tool
[image:3.595.306.531.558.758.2]The questionnaires used in this research was gleaned and compiled from various validated instruments from the literature reviewed but some modifications were made to wording to suit the context of this research. A questionnaire consists of 24 variables was developed and distributed among the industries .The respondents were asked to rate the variables under a five point Likert scale (1-Not at all, 2- Limited extent, 3- To some extent, 4- Reasonable extent and 5-High extent).The following table 1 shows the different factors and related variables.
Table 1: Factors and related variables
No. Factor Related variables 1 Efforts of
organization(EO)
EO1,EO2,EO3
2 Material selection criteria(MSC)
MSC1,MSC2,MSC3
3 Green design execution(GDE)
GDE1,GDE2,GDE3 4 Green manufacturing
execution(GME)
GME1,GME2,GME3
5 Implementation of environmental acts (IEA)
IEA1,IEA2,IEA3
6 Environmental impact (EI)
EI1,EI2,EI3
7 Resources impact (RI)
68 8 Cost benefit impact
(CBI)
CBI1,CBI2,CBI3
The details of related variables are as follows.
EO1- Organization has taken efforts to create awareness of need of GM among the employees, EO2- Organization has taken adequate efforts to bring green processes in organization,EO3- Organization has adopted Indian government norms of clean environment and also monitors the progress of GM, MSC1- Effects on human health involved in development and end use of product are considered while selecting materials, MSC2- End- of- life use and recyclability of material is considered, MSC3- Toxic and hazardous material uses are eliminated and environmentally friendly materials are used in product development, GDE1- Environmental regulations, safety standards are followed in product design, GDE2- Green design practises like Design for disassembly, remanufacturing and recycling are incorporated in design process, GDE3- Design approach is preventive and integrates environmental concerns in product life cycle, GME1- Environmental issues are considered in planning manufacturing processes and other related activities, GME2- Conventional Manufacturing processes are replaced by recent Green Manufacturing processes, GME3- Pollution control and emission control devices are modified, IEA1- Organization follows Resource Conservation and Recovery Act, IEA2- Organization follows Clean Air Act ,Waste Minimization& Management Act, IEA3- Organization follows Emission Norms, EI1- Pollution through air and water in the surrounding residential area is reduced, EI2- There is reduction in solid waste and other waste, EI3- There is control over industrial emissions, RI1- Consumption of energy is optimized, RI2- Healthy working conditions are created for human resources and human resources are optimized, RI3- Waste water and waste materials are reused, CBI1- Manufacturing cost is recovered through recycling, CBI2- Cost of energy consumption is reduced, CBI3- There is reduction in waste handling, waste disposal, and waste storage cost.
3.2 Sample size design
The target population in this research is all firms which implemented GM. Sampling size is determined keeping the aspects of generalization and desired power in mind. According to Hair, J.F.et al. (2007), minimum 5 respondents per variable are required. But Hair preferred more than 10 respondents per variable for better results i.e. (Number of respondents) >(10 x Number of variables). In this research379 industries based in Mumbai and nearby industrial areas
commonly known as Mumbai region are selected and questionnaire is sent to the concern persons handling the practices of Green Manufacturing through proper sources. Total 310 industries have responded to the questionnaire properly and these responses are considered as data for research which suits the requirement of sample size (i.e. 310 > 10 x 24)
3.3 Respondent characteristics
[image:4.595.316.519.608.755.2]The characteristics of total 310 responding industries is as shown in table 2
Table 2: Respondent characteristics
Sr. No Type Frequency Percent
1 Small 70 22.6
2 Medium 114 36.8
3 Large 126 40.6
4 Total 310 100
4. Preliminary analysis of data
The data collected through questionnaire is entered in properly designed data sheet and it is analyzed by using SPSS 21(IBM) step by step as shown below.
4.1 Reliability test
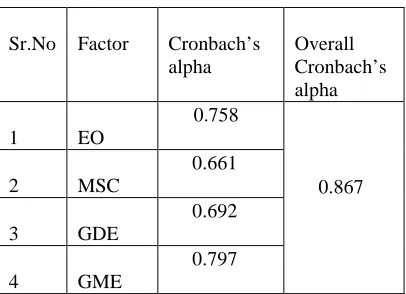
According to Carmines and Zeller (1979), Reliability concerns the extent to which an experiment, test or any measuring procedure yields the same results on repeated trials. The internal consistency method works quite well in field studies because it requires only one administration. Also, it is the most general form of reliability estimation .Prior to further analysis, internal consistency of variable set was performed by SPSS21 software and reliability coefficient Cronbach’s alpha is calculated for all sets of variables and the results are tabulated as shown in table 3.
Table 3: Cronbach’s alpha
Sr.No Factor Cronbach’s alpha
Overall Cronbach’s alpha
1 EO
0.758
0.867
2 MSC
0.661
3 GDE
0.692
4 GME
69
5 IEA
0.617
6 EI
0.832
0.816
7 RI
0.759
8 CBI
0.652
According to Hair,J.F. et al.(2007) ,it is essential to perform reliability test to ensure Cronbach’s alpha for all factor and it should be should be greater than 0.6.The Cronbach’s value for all factors shown above are above 0.6, hence the reliability is ensured.
4.2 KMO test of sampling adequacy and Bartlett's test sphericity
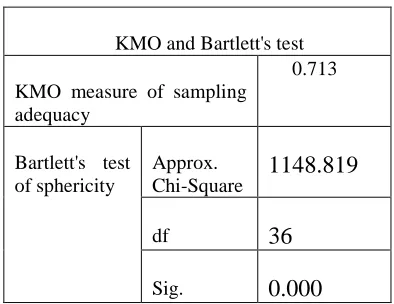
Very first two important tests were carried out i.e. Kaiser-Meyer-Olkin sampling adequacy test and Bartlett's test of sphericity. According to Hair J.F.(2007),these both the tests evaluate the appropriateness of applying factor analysis. KMO measure checks inter-correlations among variables. Bartlett's test of sphericity provides statistical significance that correlations matrix has significant correlations among at least some of the variables.
Table 4: KMO and Bartlett's test for independent variables
Table 5: KMO and Bartlett's test for dependent variables
As per the guidelines by Hair J.F. et al. (2007), Malhotra and Dash (2011) minimum acceptable value of KMO is 0.5. Here as KMO value is more than 0.5 indicating the appropriateness of applying factor analysis. Bartlett's Test of Sphericity indicates that correlations matrix has significant correlations among at least some of the variables. Both the tests indicate that suitability of data for further analysis.
5. Factor analysis by Principal Component Method
Factor analysis is performed to reveal the factor structure. It is necessary to check whether items designed are loading on the designed factors. According to Hair J.F. et al. (2007), mixing dependent and independent variables in single factor analysis is highly inaccurate and if it is carried out it can result into inappropriate relationship. So for dependent and independent variables, separate factor analysis was carried out.
The method used here is Principal component analysis. As per Raj Kishore Sharma et al.(2015) ,the main difference between factor analysis and principal component analysis lies in the way the communalities are used. In principal component analysis, it is assumed that the communalities are initially 1. This is reflected in the fact that in factor analysis the communalities have to estimated, which makes factor analysis more complicated than principal component analysis, but also more conservative.
5.1: Descriptive statistics of variables-
Table 6 and Table 7 show descriptive statistics of independent and dependent variables obtained separately by SPSS 21 software.
KMO and Bartlett's test
KMO measure of sampling adequacy
0.812
Bartlett's test of sphericity
Approx. Chi-Square
1842.816
df 105
Sig. 0.000
KMO and Bartlett's test
KMO measure of sampling adequacy
0.713
Bartlett's test of sphericity
Approx.
Chi-Square
1148.819
df
36
[image:5.595.318.515.97.249.2] [image:5.595.82.284.452.597.2]70 Table 6: Descriptive statistics of independent
variables
Variable N
Mean Std. Deviation EOAVG 310 3.5957 0.63686
MSCAVG 310 3.6022 0.58766 GDEAVG 310 3.6774 0.54752 GMEAVG 310 3.7118 0.62037 IEAAVG 310 3.6581 0.55538
Table 7: Descriptive statistics of dependent variables
Variable N
Mean Std. Deviation EIAVG 310 3.7667 0.57987
RIAVG 310 3.7269 0.55799
CBIAVG 310 3.6624 0.57390
5.2 Factor analysis
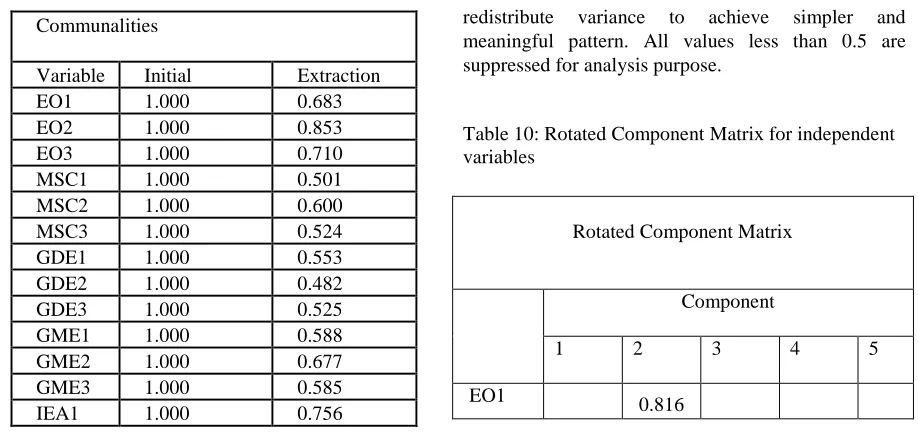
Method used here for factor analysis is Principal Component Analysis. Basic assumptions underlying Principal Component Analysis are that all variance is common. Hence all are one initially. Following Table 8 and Table 9 shows communalities.
Table 8: Communalities (Independent Variables)
Communalities
Variable Initial Extraction
EO1 1.000 0.683
EO2 1.000 0.853
EO3 1.000 0.710
MSC1 1.000 0.501
MSC2 1.000 0.600
MSC3 1.000 0.524
GDE1 1.000 0.553
GDE2 1.000 0.482
GDE3 1.000 0.525
GME1 1.000 0.588
GME2 1.000 0.677
GME3 1.000 0.585
IEA1 1.000 0.756
IEA2 1.000 0.473
IEA3 1.000 0.642
[image:6.595.314.519.212.380.2]Extraction Method: Principal Component Analysis.
Table 9: Communalities (Dependent Variables)
Communalities
Variable Initial Extraction
EI1 1.000 0.711
EI2 1.000 0.650
EI3 1.000 0.934
RI1 1.000 0.666
RI2 1.000 0.701
RI3 1.000 0.645
CBI1 1.000 0.689
CBI2 1.000 0.662
CBI3 1.000 0.533
Extraction Method: Principal Component Analysis.
Extraction refers to common variance in data structure. Table 8 and 9 clearly indicates that for maximum variables minimum shared variance always exceeds 50% and in majority of cases it exceeds 60%.
[image:6.595.75.534.546.762.2]Principal component analysis with Varimax rotation has resulted into rotated component matrix as shown in table 10 and 11.This rotation is carried out to redistribute variance to achieve simpler and meaningful pattern. All values less than 0.5 are suppressed for analysis purpose.
Table 10: Rotated Component Matrix for independent variables
Rotated Component Matrix
Component
1 2 3 4 5
71
EO2 0.757
EO3 0.698
MSC1 0.545
MSC2 0.701
MSC3 0.656
GDE1 0.669 GDE2 0.672 GDE3 0.626 GME1 0.634 GME2 0.703 GME3 0.722
IEA1 0.634
IEA2 0.553
IEA3 0.744
Extraction Method: Principal Component Analysis. Rotation Method: Varimax with Kaiser Normalization a. Rotation converged in 8 iterations
Table11: Rotated Component Matrix for dependent Variables
Rotated Component Matrix Component
1 2 3
EI1 0.833 EI2 0.716 EI3 0.926
RI1 0.757
RI2 0.813
RI3 0.772
CBI1 0.806
CBI2 0.767
CBI3 0.635
Extraction Method: Principal Component Analysis
Rotation Method: Varimax with Kaiser Normalization
a. Rotation converged in 5 iterations
Above rotated solution clearly gives idea about how items are loading on the factors. This clearly indicates unidimensionality of measures indicating that all items under one factor are strongly associated .This unidimensionality is highly essential for calculation of summated scale.
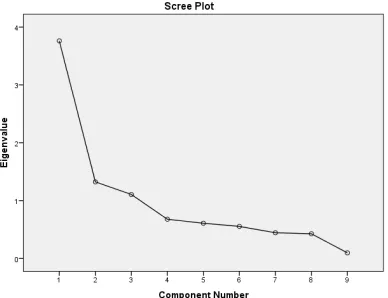
Number of factors extracted here is based on Scree plot which plots Eigen values against Component number. Latent root (Eigen value criteria) is adopted to determine whether factor selection is proper or not.
Figure 1: Eigen value plot for Scree test criteria for independent Variables
[image:7.595.313.507.593.742.2]72 Figure 2: Eigen value plot for Scree test criteria for
dependent Variables
Above Eigen value plot for Scree test criteria for dependent variables clearly confirms presence of 3 components with Eigen value greater than one. All the above analysis clearly indicates the unidimensionality of measures indicating that all items under each factor are strongly associated ensuring construct validity.
6. Muliple Regression analysis
As per Hair J.F.(2007), Multiple Regression analysis is a statistical technique which is used to analyze the relationship between a single dependent variable and several independent variables. The objective of multiple regression analysis is to use the independent variables whose values are known to predict the single dependent value selected by researcher.
6.1 Design of hypothesis
The purpose of Multiple Regression analysis in this study is to find effect of independent variables EO,MSC,GDE,GME and IEA on dependent variable EI ( Environmental impact). So various null and alternate hypothesis are designed as follows.
Table12: Various Null and Alternate hypothesis
Sr.No Null hypothesis Alternate hypothesis
1 H10: There is no
positive effect of EO on EI
H1a: There is
positive effect of EO on EI
2 H20: There is no
positive effect of MSC on EI
H2a: There is
positive effect of MSC on I
3 H30: There is no
positive effect of GDE on EI
H3a: There is
positive effect of GDE on EI
4 H40: There is no
positive effect of GME on EI
H4a: There is
positive effect of GME on EI
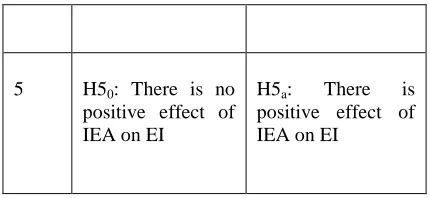
5 H50: There is no
positive effect of IEA on EI
H5a: There is
positive effect of IEA on EI
6.2 Model Summery
The table 13 shows Model summary with EI as dependent variable and EO, MSC, GDE, GME as independent variables
Table 13: Model Summary (Linear Regression Analysis for EI)
Model Summaryb
Model R R Square Adjusted R Square
Std. Error of the Estimate
1 0.681a 0.464 0.455 0.42805
a. Predictors: EOAVG, MSCAVG GDEAVG,
GMEAVG and IEAAVG
b. Dependent Variable: EIAVG
Adjusted R square value is 0.455; means 45.5% variation in the dependent variable is explained by independent variables. Here 0.455 is sufficiently high value of variance hence model is acceptable. (Hair J.F et al.; 2007)
6.3 ANOVA test for overall model fit
Table 14 provides ANOVA summary statistical positive test for overall model fit.
Table 14: ANOVA Statistical Test for overall model fit
ANOVAa Model Sum of
Squares df
Mean
Square F Sig. Regression 48.199 5 9.640 52.610 .000b
Residual 55.701 304 0.183 Total 103.900 309
a. Dependent variable: EIAVG
[image:8.595.309.526.316.459.2]73 Here total sum of squares are 103.900.This much error
would have occurred if only mean of dependent variable i.e. EI is used to predict dependent variable. Reduction in error by use of this model= (48.199/103.900)x100= 46.38%
This reduction is found to be statistically significant with F-ratio of 52.610 and significance level of 0.000.
6.4 Linear Regression Coefficients Beta for EI
Table 15: Regression Coefficienta
Model (AVG)
Unstandardized Coefficients
Standardized Coefficients
t Sig. B Std.
Error Beta
Constant .670 .206 3.254 .001
EOAVG .089 .045 0.098 1.992 .047
MSCAV
G
.049 .051 0.049 .953 .342
GDEAV
G
.124 .056 0.089 2.210 .028
GMEAV
G
.084 .051 0.117 1.631 .104
IEAAVG .501 .056 0.480 8.870 .000
a. Dependent Variable: EIAVG
Standardized Regression Coefficients are calculated from standardized data. Mathematically the model can be written as-
EIAVG=0.098[EOAVG]+0.049[MSCAVG] + 0.089[GDEAVG] + 0.117[GMEAVG] +
0.480[IEAAVG]
Here IEA is having maximum positive impact on EI. The impact of GME is also significant.
6.5 Checking for the assumption normality of error
terms (for Regression model for factors affecting EI)
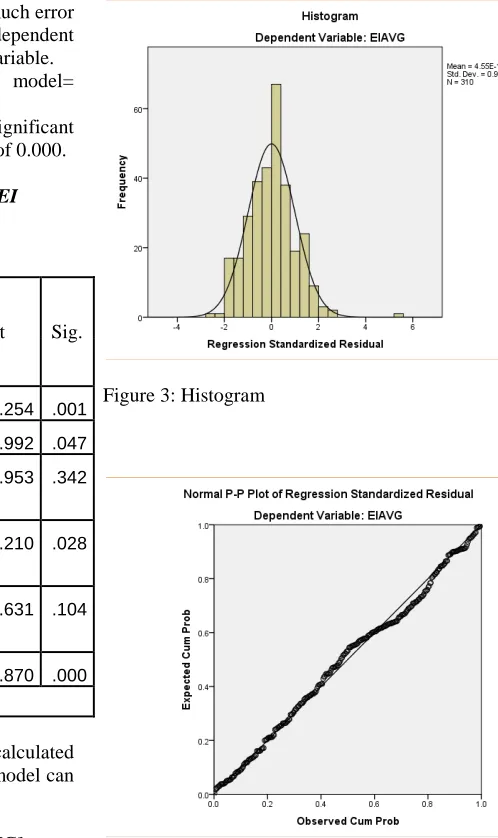
[image:9.595.255.504.99.518.2]This assumption checks the normality of error term. This assumption can be checked by visual inspection of normal probability plot and histogram. Figures 3 and 4 shows histogram and normal probability plot respectively.
Figure 3: Histogram
Figure 4: Normal P-P plot of regression standardized residual
6.6 RESULTS AND DISCUSSION
According to Hair J.F et al.(2007), Cronbach’s alpha for all factor should be should be> 0.6.The Cronbach’s value for all factors are above 0.6, hence the reliability of data is ensured. As per the guidelines by Hair J. F et al. (2007), Malhotra and Dash (2011) minimum acceptable value of KMO is 0.5. Here as KMO value is more than 0.5 for both types of variables indicating the appropriateness of applying factor analysis. As well as significant Bartlett's Test of Sphericity indicate that correlations matrix has significant correlations among at least some of the variables. Both the tests indicate that suitability of data for further analysis.
[image:9.595.71.310.235.457.2]74 in table 10 and 11. This rotated solution clearly gives
idea about how items are loading on the factors. This clearly indicates unidimensionality of measures indicating that all items under one factor are strongly associated
[image:10.595.79.303.282.470.2]The effect of various independent variables EO, MSC, GDE, GME and IEA on dependent variable EI has been assessed by testing several hypotheses with the various multivariate techniques in previous section. The result of these analyses is tabulated in following table 16.
Table 16: Hypothesis testing results
Sr. No Designed Hypothesis Accepted Hypothesis Null
Hypothesis
Alternate Hypothesis
1
H10 H1a H1a
2
H20 H2a H2a
3
H30 H3a H3a
4
H40 H4a H4a
5
H50 H5a H5a
7 CONCLUSIONS
The main objective of this study was to investigate the present status of Environmental impact of GM implementation and critical success factors affecting it in industries of Mumbai region industrial areas, India. The results of primary testing showed that the questions of questionnaire are appropriately designed with the aid of literature reviewed. It also indicates that the sample size is considerably adequate to do the analysis and data is internally consistent and adequate. The Principal factor analysis has resulted into proper factors loading which was suitable for further analysis. Multiple regressions were carried out with mean values of EO,MSC,GDE,GME and IEA as independent variables and EI as a dependent variable. The hypothesis testing reveals that, EO,MSC,GDE,GME and IEA have positive impact on EI of organizations. Multiple regressions were conducted with all checks on fundamental assumptions and validities clearly confirmed the positive influence of EO,MSC,GDE,GME and IEA on EI of organization. The standardized β (table15) values confirmed the highest effect of IEA on EI and secondly GME.
This comes to a conclusion that of Environmental acts
framed by concerned regulatory authorities is the critical success factor to improve the Environmental performance of organization in Mumbai region. It also indicates that implementation of Green processes by the organizations has also considerable effect on Environmental performance. The other factors like Efforts of organization, Material selection criteria, and Green design execution also have positive effect on Environmental performance of Mumbai region based Industries. Finally it can be concluded that GM plays an important role in improving Environmental Performance of industries based in Mumbai region, India.
8 Acknowledgments
We are very much thankful to IBM Corporation for making SPSS 21 software available for academic research work. We are also very much thankful to Dr.B.T Patil and Dr.S.D.Dalvi for valuable support and guidance.
REFERENCES
[1] Abhishek Kumar Singh, Sanjay Kumar Jha and Anand Prakash, 2014,”Green Manufacturing (GM) Performance Measures: An Empirical Investigation from Indian MSMEs”, International Journal of Research in Advent Technology, Vol.2, No.4, pp.51-65.
[2] Ananth P. Chikkatur, Ambuj D. Sagar and T.L. Sankar, 2009, “Sustainable development of the Indian coal sector”, Elsevier, Energy 34, pp.942– 953.
[3] Arindam Bhattacharya et al., 2011, “Green Manufacturing, Energy, Products and Processes’’BCG, pp.3-11.
[4] Atlas, M. and Florida, R., 1998, Green manufacturing, Handbook of Technology Management, Springer, pp.378-407.
[5] Basappaji K Ma and N Nagesha, 2014, “Assessment of cleaner production level in agro based industries – a fuzzy logic approach”, Elsevier Energy Procedia 54, pp. 127 – 134. [6] Bulent Sezan, and Siben Cancaya, 2013, “Effects
of green manufacturing and eco-innovation on sustainability performance”, Elsevier, Social and Behavioral Science, 99, pp.154 – 163.
[7] Carmines, E. and Zeller, R. (1979) ‘Reliability and validity assessment, series: quantitative applications in social sciences’, No. 7–17, Sage Publications, Newbury Park, CA.
[8] Cattell R.B., 1978, The scientific use of factor analysis, Plenum, New York.
75 [10] Deif A.M., 2011, A system model for green
manufacturing, Advances in Production Engineering & Management, 6 (1), 27-36. [11] Denis Boret Cordoba and Alireza Veshagh,
2013, “Managing Eco Design and Sustainable Manufacturing”, 20th CIRP International Conference on Life Cycle Engineering, Singapore, pp.59-67.
[12] Digalwar A.K. and Sangwan K.S., 2007, “Development and validation of performance measures for world class manufactures”, 35,Journal of Advanced Manufacturing Systems, Vol. 6, No. 1, pp.21–38.
[13] Dornfeld D.et al., 2013, Introduction to Green Manufacturing, Springer 978-1-4419-6015-3, pp.1-24.
[14] Dr. Devi K. Kalla and Prof. Aaron Brown,2012, “Infusing A Sustainable Green manufacturing into manufacturing /mechanical Engineering Program”,2012 ASEE Annual Conference,pp.1-10.
[15] Dr.R.L.Srivastava and Dr.S.K Ganguly, 2014, “Critical Success Factors for Cement Industry in India: A Case Study Analysis”, IJCEM, Volume 1, Issue 7, pp.79-99.
[16] Ehrenfeld, J. and Lenox, M.,1997, "The development and implementation of DfE programmes", Journal of Sustainable Product Design, No.1, pp.17-27.
[17] Ejim-eze, and Emmanuel Emeka, 2013, “Organizational learning and eco-innovation in automobile firms in a developing country: a focus on Nigeria” 9th international PhD School on national systems of innovation and economic development, May 20 to 31.
[18] Guilford J.P., 1954, Psychometric Methods, McGraw-Hills, New York.
[19] Hair, J.F., Black, W.C., Babin, B.J., Anderson, R.E. and Tatham, R.L., 2007, Multivariate Data Analysis, Sixth edition, Pearson Education, New Delhi.
[20] Keldmann, T. and Olesen, J., 1994, “Managing the environmental issue in product development: the environmentally oriented milestone questions and techniques”, ASME Design for Manufacturability Conference, Chicago, IL, pp. 99-106.
[21] Klimis Ioannou and Alireza Veshagh, 2011, “Managing Sustainability in Product Design and Manufacturing”, Springer, Proceedings of the 18th CIRP International 213 ,Conference on Life Cycle Engineering, Germany, pp.213-218. [22] Kuldip Singh Sangwan, 2011, “Quantitative and
Qualitative Benefits of Green Manufacturing: an Empirical Study of Indian Small and Medium Enterprises”, Glocalized Solutions for Sustainability in Manufacturing: Proceedings of the 18th CIRP International 371
[23] Malhotra N. and Dash S., 2011, Marketing research, Pearson publications, New Delhi. [24] Melnyk S. A and Smith R. T., 1996, Green
Manufacturing, ME Publication, pp.2
[25] Minhaj Ahemad. A.Rehman, R. R Shrivastava, and Rakesh. L Shrivastava, 2013, “Validating Green Manufacturing (GM) Framework for Sustainable Development in an Indian Steel Industry,” Universal Journal of Mechanical Engineering 1(2), pp. 49-61.
[26] Minhaj Ahemad Abdul Rehman and Rakesh L. Shrivastava,2013, “Development and validation of performance measures for green manufacturing (GM) practices in medium and small scale industries in Vidharbha region, India’,Inderscience, Int. J. Society Systems Science, Vol. 5, No. 1,pp.62-81.
[27] Mihelcic, J. R., Crittenden, J. C., Small, M. J., Shonnard, D. R., Hokanson, D. R., Zhang, Q., Chen, H., Sorby, S. A., James,V. U., Sutherland, J. W., and Schnoor, J. L., 2011, “Sustainability Science and Engineering: The Emergence of a New Metadiscipline” ,Environ. Sci. Technol., 37, pp. 5314–5324.
[28] Motwani, J., 2001, “Critical factors and performance measures of TQM”, The TQM Magazine, Vol. 13, No. 4, pp.292–300.
[29] Mukherjee, S. and Kathuria, V., 2006, “Is economic growth sustainable? Environmental quality of Indian States after 1991”, Int. J. Sustainable Development, Vol. 9, No. 1, pp.38– 60.
[30]Paul Shrivastava, and Stuart Hart, 1995, “Creating sustainable corporations” Business strategy and the environment, vol.4, pp.154-165.
[31]Perminder Jit Singh and KS Sangwan, 2011, “Management Commitment and Employee Empowerment in Environmentally Conscious Manufacturing Implementation”, Proceedings of the World Congress on Engineering, Vol. 1, WCE 2011, London, U.K.
[32] Raj Kishore Sharma and C.D. Patil ,2015, “Identification and Modeling of Green Supplier Selection Criteria using Principal Component Analysis and Interpretive Structural Modeling in Indian Context”, IJRETM,Vol.3, Issue 3,pp.1-14. [33]Ramakrishnan, L., 2006, “FIEMA”, Regional
Environmental Coordinator, Philips Lighting, Asia.
[34] Ritzen, S., 2000, “Integrating environmental aspects into product development- proactive measure”, PhD thesis, Department of Machine Design, Royal Institute of Technology Stockholm [35] R.P. Mohanty & Anand Prakash, 2014, “Green
76 [36] Ru-Jen Lin, Rong-Huei Chen and Thi-Hang
Nguyen, 2011, “Green supply chain management performance in automobile manufacturing industry under uncertainty”, Elsevier Procedia - Social and Behavioral Sciences 25, pp. 233 – 245. [37]Sumit Gupta, G. S. Dangayach and Amit Kumar Singh, 2015, “Analytic Hierarchy Process (AHP) Model for Evaluating Sustainable Manufacturing Practices in Indian Electrical Panel Industries”, Elsevier Procedia, Social and Behavioral Sciences 189, pp. 208 – 216