The Effects of Human Variation in DUC Summarization Evaluation
Donna Harman and Paul OverRetrieval Group, Information Access Division National Institute of Standards and Technology
Gaithersburg, MD 20899, USA [email protected],[email protected]
Abstract
There is a long history of research in automatic text summarization systems by both the text retrieval and the natural language processing communities, but evaluation of such systems’ output has always presented problems. One critical problem remains how to handle the unavoidable variability in hu-man judgments at the core of all the evaluations. Sponsored by the DARPA TIDES project, NIST launched a new text summarization evaluation ef-fort, called DUC, in 2001 with follow-on workshops in 2002 and 2003. Human judgments provided the foundation for all three evaluations and this paper examines how the variation in those judgments does and does not affect the results and their interpreta-tion.
1 Introduction
Research in summarization was one of the first ef-forts to use computers to “understand” language. Work was done back in the 1950s by many groups, including commercial services, to automatically produce abstracts or lists of pertinent keywords for documents. The interest in automatic summariza-tion of text has continued, and currently is enjoy-ing increased emphasis as demonstrated by the nu-merous summarization workshops held during the
last five years. The DUC summarization
evalu-ations (2001 – 2004)(http://duc.nist.gov)
sponsored by the DARPA TIDES project (Translin-gual Information Detection, Extraction, and Sum-marization) are prominent examples. DUC has been guided by a roadmap developed by members of the summarization research community.
Along with the research has come efforts to eval-uate automatic summarization performance. Two major types of evaluation have been used: extrinsic evaluation, where one measures indirectly how well the summary performs by measuring performance in a task putatively dependent on the quality of the summary, and intrinsic evaluation, where one mea-sures the quality of the created summary directly.
Extrinsic evaluation requires the selection of a task that could use summarization and measurement of the effect of using automatic summaries instead of the original text. Critical issues here are the se-lection of a real task and the metrics that will be sen-sitive to differences in the quality of the summaries. This paper concerns itself with intrinsic evalua-tions. Intrinsic evaluation requires some standard or model against which to judge summarization qual-ity and usually this standard is operationalized by finding an existing abstract/text data set or by hav-ing humans create model summaries (Jhav-ing et al., 1998).
Intrinsic evaluations have taken two main forms: manual, in which one or more people evaluate the system-produced summary and automatic, in which the summary is evaluated without the human in the loop. But both types involve human judgments of some sort and with them their inherent variability. Humans vary in what material they choose to in-clude in a summary and in how they express the con-tent. Humans judgments of summary quality vary from one person to another and across time for one person.
In DUC 2001 - 2003 human judgments have formed the foundation of the evaluations and infor-mation has been collected each year on one or more sorts of variation in those judgments. The following sections examine this information and how the vari-ation in human input affected or did not affect the results of those evaluations.
2 Initial Design – DUC-2001
Since the roadmap specified testing in DUC-2001 of both single and multi-document summarization, the data sets and tasks were designed as follows.
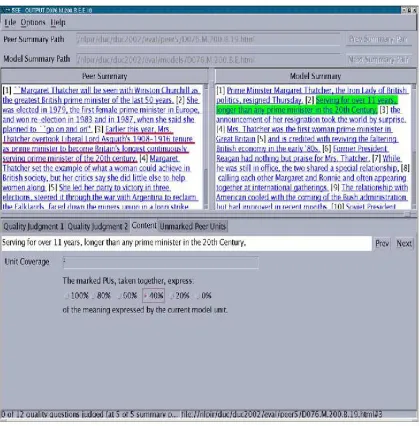
Figure 1: SEE interface for judging per unit cover-age
100, and 50 words).
The sets of documents were assembled at NIST by 10 retired information analysts. Each person se-lected six document sets, and then created a 100-word manual abstract for each document, and for the entire document set at the 400, 200, 100 and 50 word lengths. Thirty of the sets (documents and manual abstracts) were distributed as training data and the remaining thirty sets of documents (without abstracts) were distributed as test data.
Fifteen groups participated in DUC-2001, with 11 of them doing single document summarization and 12 of them doing the multi-document task.
The evaluation plan as specified in the roadmap was for NIST to concentrate on manual comparison of the system results with the manually-constructed abstracts. To this end a new tool was developed by Chin-Yew Lin at the Information Sciences
In-stitute, University of Southern California (http:
//www.isi.edu/˜cyl/SEE/). This tool
al-lows a summary to be rated in isolation as well as compared to another summary for content overlap. Figure 1 shows one example of this interface. Hu-man evaluation was done at NIST using the same personnel who created the manual abstracts (called model summaries).
One type of evaluation supported by SEE was coverage, i.e., how well did the peer summaries (i.e., those being evaluated) cover the content of the documents (as expressed by the model summary). A pairwise summary comparison was used in this part of the evaluation and judges were asked to do detailed coverage comparisons. SEE allowed the
judges to step through predefined units of the model summary (elementary discourse units/EDUs) (Sori-cut and Marcu, 2003) and for each unit of that sum-mary, mark the sentences in the peer summary that expressed [all(4), most(3), some(2), hardly any(1) or none(0)] of the content in the current model sum-mary unit. The resulting ordered category scale[0-4] is treated as an interval scale in the coverage score based on feedback from the judges on how it was used. The coverage score for a given peer summary is the mean of its scores against the EDUs of the
associated model (∼4 EDUs per summary for the
50-word model summaries). This process is much more complex than doing a simple overall compari-son using the entire summary but past evaluation ex-periences indicated that judges had more difficulty making an overall decision than they did making de-cisions at each EDU.
2.1 DUC-2001 Results - Effect of Variability in Models
Recall that there are two very different sources of human variation in DUC-2001, as in all the DUC evaluations. The first is the disagreement among judges as to how well a system summary covers the model summary. This is similar to what is seen in relevance assessment for IR evaluations. To the ex-tent that different judges are consisex-tently more le-nient or strict, this problem has been handled in DUC by having the same judge look at all maries for a given document set so that all peer sum-maries are affected equally and by having enough document sets to allow averaging over judges to mitigate the effect of very strict or very lenient judges. If a judge’s leniency varies inconsistently in a way dependent on which system is being judged (i.e., if there is an interaction between the judge and the system), then other strategies are needed. (Data was collected and analyzed in DUC-2002 to assess the size of these interactions.)
Summarization has a second source of disagree-ment and that is the model summaries themselves. People write models that vary not only in writing style, but also in focus, i.e., what is important to summarize in a document or document set.
This special study worked with a random subset of 20 document sets (out of 30). Each peer was judged twice more by a single person who had not done the original judgment. This person used the two extra models, neither of which had been created by the person doing the judgments. There was only time to do this for the multi-document summaries at lengths 50 and 200.
2.2 Model Differences
A first question is how much did the two
mod-els differ. One way of measuring this is by a
simple n-gram overlap of the terms. This was
done based on software in the MEAD toolkit
(http://www.summarization.com),
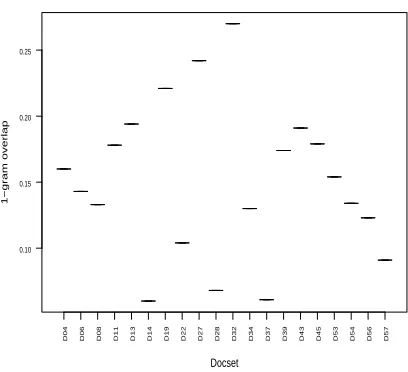
with-out omitting the commonwords, nor doing any stemming, and the n-grams were allowed to span sentence boundaries. The average unigram overlap (the number of unique unigrams in the intersec-tion/the number of unique unigrams in the union) for the two extra 50-word model summaries was 0.151 and there were only 6 out of the 20 sets that had any tri-gram overlap at all. For the 200-word summaries, the average unigram overlap was 0.197, with 16 out of the 20 sets having tri-gram overlaps. These numbers seem surprisingly low, but an examination of the summaries illustrates some of the reasons. What follows are the two model pairs with the greatest and least unigram overlap in the two extra 50-word document set group.
Document set 32, Judge G “In March 1989, an Exxon oil tanker crashed on a reef near Valdez, Alaska, spilling 8.4 million gallons of oil into Prince William Sound seriously damaging the environment. The cleanup was slow and Exxon was subject to severe compensation costs and indictment by a federal jury on five criminal charges.”
Document set 32, Judge I “On March 24, 1989, the Exxon Valdez spilled 11.3 million gallons of crude oil in Prince William Sound, Alaska. Cleanup of the disaster continued until September and cost almost $2 billion, but 117 miles of beach remained oily. Exxon announced an earnings- drop in January 1990 and was ordered to resume cleaning on May 1.”
Document set 14, Judge B “U.S. military air-craft crashes occur throughout the world more often than one might suspect. They are normally reported in the press; however, only those involving major damage or loss of life attract extensive media
coverage. Investigations are always conducted.
D04 D06 D08 D11 D13 D14 D19 D22 D27 D28 D32 D34 D37 D39 D43 D45 D53 D54 D56 D57
0.10 0.15 0.20 0.25
Docset
1−gram overlap
Figure 2: DUC-2001 unigram overlap by document set for the two extra 50-word models
Flight safety records and statistics are kept for all aircraft models.”
Document set 14, Judge H “1988 crashes in-cluded four F-16s, two F-14s, three A-10s, two B-52s, two B-1Bs, and one tanker. In 1989 one T-2 trainer crashed. 1990 crashes included one F-16, one F-111, one F-4, one C-5A, and 17 helicopters. Other plane crashes occurred in 1975 (C-5B), 1984 (B-52), 1987 (F-16), and 1994 (F-15).”
For document set 32, the two model creators are covering basically the same content, but are including slightly different details (and therefore words). But for document set 14, the two models are written at very different levels of granularity, with one person writing a very high-level analysis whereas the other one gives only details. Note that these are only examples of the variation seen across the models; many other types of variations exist.
Additionally there is a wide variation in overlap across the 20 document sets (see Figure 2). This document set variation is confounded with the hu-man variation in creating the models since there were 6 different humans involved for the 20 doc-ument sets.
2.3 Effects of Model Differences on Document Set Coverage Scores
D04 D06 D08 D11 D13 D14 D19 D22 D27 D28 D32 D34 D37 D39 D43 D45 D53 D54 D56 D57
0.0 0.5 1.0 1.5 2.0 2.5 3.0
Docset
Absolute difference in coverage scores
Figure 3: DUC-2001 absolute coverage differences by document set for the two extra 50-word models
dot the average, and the box comprises the middle 2 quartiles. The open circles are outliers.
There is a large variation across document sets, with some sets having much wider ranges in cov-erage score differences based on the two differ-ent models. Looking across all 20 documdiffer-ent sets, the average absolute coverage difference is 0.437 or 47.8% of the highest scoring model for the 50-word summaries and 0.318 (42.5%) for the 200-word summaries. This large difference in scores is coming solely from the model difference since judg-ment is being made by the same person (although some self-inconsistency is involved (Lin and Hovy, 2002)).
2.4 Relationship between Model Differences and Coverage Scores
Does a small unigram overlap in terms for the mod-els in a given document set predict a wide differ-ence in coverage scores for peers judged against the models in that document set? Comparing Figures 2 and 3, or indeed graphing overlap against coverage (Figure 4) shows that there is little correlation be-tween these two. One suspects that the humans are able to compensate for different word choice and that the coverage differences shown in Figure 3 rep-resent differences in content in the models.
2.5 Effects of Model Differences on per System Coverage Scores
How does the choice of model for each document set affect the absolute and relative coverage score for each system averaged across all document sets? Figure 5 shows the median coverage scores
(50-0.0 0.2 0.4 0.6 0.8 1.0
0.0
0.2
0.4
0.6
0.8
1.0
1.2
Docset mean(|difference in coverage score| / max score)
Model overlap * 4
Figure 4: DUC-2001 absolute coverage differences vs overlap for two extra 50-word models
0.0
0.2
0.4
0.6
0.8
1.0
1.2
Peer
Coverage
L M N O P R S T U W Y Z
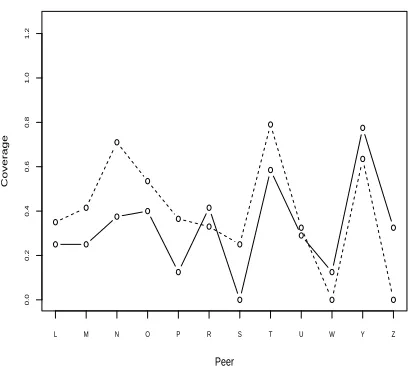
Figure 5: DUC-2001 median coverage by systems using extra model sets (50-word summaries)
word summaries) for the 12 systems using each of the two extra model sets. The points for the cov-erage scores are connected within a given model to make changes in rank with neighbors more obvious. It can be seen that the scores are close to each other in absolute value and that the two lines track each other in general. (The same type of graph could be shown for the 200-word summaries, but here there were even smaller differences between system rank-ings.)
overlap are not reflected in the absolute or rela-tive system results for the DUC-2001 data exam-ined. Most of the systems judged better against one set of models are still better using different models. The correlation (Pearson’s) between median cover-age scores for the systems using the two extra model
sets is 0.641 (p<0.05). This surprising stability of
system rankings clearly needs further analysis be-yond this paper, but implies that the use of enough instances (document sets in this case) allows an av-eraging effect to stablize rankings.
There are many system judgments going into these averages, basically 20 document sets times the average number of model units judged per
doc-ument set (∼ 4). These 80 measurements should
make the means of the extra scorings better es-timates of the “true” coverage and hence more
alike. More importantly, Figure 5 suggests that
there is minimal model/system interaction.
Al-though no analysis of variance (ANOVA) was run in DUC-2001, the ANOVAs for DUCs 2002 and 2003 verify this lack of interaction.
3 DUC-2002
DUC-2002 was designed and evaluated in much the same manner as DUC-2001 to allow continu-ity of research and evaluation. There were 60 more document sets with manual abstracts created in the same way as the first 60 sets. The target lengths of the summaries were shortened to eliminate the 400-word summary and to include a headline length summary. The SEE GUI was modified to replace the five-point intervals [All, most, some, hardly any, or none] with percentages [0, 20, 40, 60, 80, 100] to reflect their perception by judges and treatment by researchers as a ratio scale. Seventeen groups that took part in DUC-2002, with 13 of them tackling the single document summary task (at 100 words) and 8 of them working on the multi-document task.
3.1 DUC-2002 Results - Effect of Variability in Judges
Beyond the main evaluation, it was decided to mea-sure the variability of the coverage judgments, this time holding the models constant. For six of the document sets, each peer was judged three addi-tional times, each time by a different judge but us-ing the same model (not a model created by any of the judges). Whereas the judgment effect does not change the relative ranking of systems in the TREC information retrieval task (Voorhees, 1998), the task in coverage evaluation is much more cogni-tively difficult and needed further exploration. In DUC the question being asked involves finding a
D070 D071 D081 D094 D099 D102
0.00
0.05
0.10
0.15
0.20
0.25
0.30
Docset
Maximum absolute coverage difference
Figure 6: DUC-2002 maximum absolute coverage differences by document set for 50-word models
0.00
0.05
0.10
0.15
0.20
0.25
0.30
Peer
Coverage
16 19 20 24 25 26 28 29
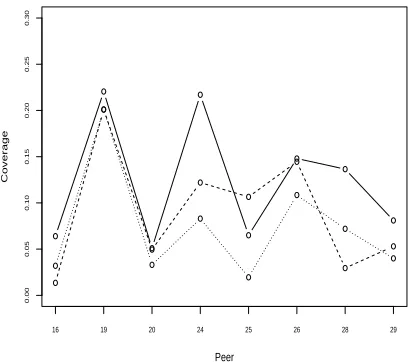
Figure 7: DUC-2002 median coverage by systems using extra judgment sets (50-word summaries)
shared meaning between the content in each model summary unit and in the peer summary sentence, and determining how much meaning is shared – a very subjective judgment.
3.2 Differences in the Coverage Judgments Using the Same Model
the same percentage differences seen for the cover-age differences based on using different models in DUC-2001.
Once again, there is a wide variation across the six document sets (see Figure 6). Even though the median is similar across these sets, the variation is much larger for two of the document sets, and much smaller for two others. The variation in cover-age score for the 200-word summaries is much less, similar to what was found in DUC-2001.
3.3 Effects of Judgment Differences on per System Coverage Scores
Figure 7 shows how the extra judgment variations affected the average system coverage scores. The lines plotted are similar to those shown for the DUC-2001 model variations, one line for each set of extra judgments. The scores again are very close together in absolute value and in general the systems are ranked similarly. In this case, the pairwise cor-relations (Pearson’s) were 0.840, 0.723, and 0.801
(p<0.05). With only six document sets involved in
the averaging, versus the 20 used in DUC-2001, it is surprising that there is still so little effect.
3.4 ANOVA Results
The extra three judgments per peer allowed for anal-ysis of variance (ANOVA) and estimates of the sizes of the various main effects and interactions. While the main effects (the judge, system, and document set) can be large, they are by definition equally dis-tributed across all systems. Although still signifi-cant, the three interactions modeled – judge/system, judge/docset, and system/docset, are much smaller (on the order of the noise, i.e., residuals) and so are not likely to introduce a bias into the evaluation. Due to lack of space, only the ANOVA for DUC-2003 is included (see Table 1).
4 DUC-2003
For DUC-2003 it was decided to change the tasks
somewhat. In an effort to get the human
sum-maries closer to a common focus, each of the multi-document summary tasks had some constraining
factor. There were four different tasks for
sum-marization, one very short ”headline” task for sin-gle documents (300 sinsin-gle documents in the test set), and three different multi-document summary tasks (each task had 30 document sets used in
test-ing). There were 21 groups that participated in
DUC-2003, with 13 of them doing task 1, 16 do-ing task 2, 11 dodo-ing task 3 and only 9 trydo-ing task 4.
D305 D312 D315 D322 D323 D326 D330 D339 D355 D358 D362 D363 D364 D365 D368 D369 D377 D382 D384 D388 D397 D405 D410 D414 D419 D427 D432 D433 D440 D448
0.1
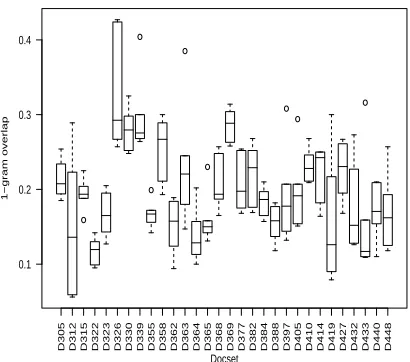
Figure 8: DUC-2003 unigram overlap by document set for 100-word models
4.1 DUC-2003 Results - Effect of Variability in Judges and Models
Beyond the main evaluation it was decided to do further investigation into the effects of model and judgment variation, in particular to focus on task 4 (create short summaries of 10 documents that were relevant to a given question). Each of the 30 doc-ument sets in task 4 had four different model sum-maries built by four different people, and four judg-ments made where the judge in each case was the model creator. The two types of variations were de-liberately confounded for several reasons. The first was that the variations had already been investigated separately and it was important to investigate the combined effect. The second related issue is that this confounding mimics the way the evaluation is being run, i.e. the judges are normally using their own model, not someone else’s model. The third reason was to provide input to the proposed auto-matic evaluation (ROUGE) to be used in DUC-2004 in which multiple models would be used but with no human judgments.
4.2 Differences in Model/Judgment Sets
The n-gram overlap for the 30 document sets is shown in Figure 8 with six possible pairwise com-parisons for each set of four model summaries. The average unigram overlap is 0.200, but again a wide variation in overlap across the different document sets.
4.3 Effects of Model/Judgment Differences
D305 D312 D315 D322 D323 D326 D330 D339 D355 D358 D362 D363 D364 D365 D368 D369 D377 D382 D384 D388 D397 D405 D410 D414 D419 D427 D432 D433 D440 D448
0.00 0.05 0.10 0.15 0.20 0.25 0.30
Docset
Maximum absolute coverage difference
Figure 9: DUC-2003 maximum absolute coverage differences by document set for 100-word models
0.00
0.05
0.10
0.15
0.20
0.25
0.30
Peer
Coverage
10 13 14 16 17 19 20 22 23
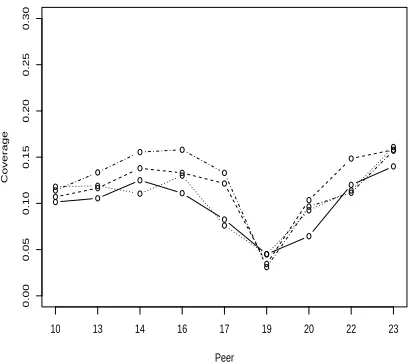
Figure 10: DUC-2003 median coverage by systems using extra judgment sets (100-word summaries)
are still high, with an average absolute coverage dif-ference of 0.139 or 69.1% difdif-ference. Again there is a wide variation across document set/judge pair (see Figure 9).
Figure 10 shows the absolute coverage scores for each system for each of the four model/judgment pairs. The difference in absolute scores is small, and the relative ranking of the systems is mostly un-changed. For DUC-2003, the pairwise correlations (Pearson’s) are 0.899, 0.894, 0.837, 0.827, 0.794,
and 0.889 (p< 0.05). Additionally the scores are
lower and closer than in earlier DUCs; this is
proba-coverage = grand mean + judge + system + docset + judge/system + judge/docset + system/docset
Source Df SS MS F Pr(F)
judge 9 1.243 0.138 47.66 <.0001
system 10 0.941 0.094 32.49 <.0001
docset 29 1.313 0.045 15.62 <.0001
jud/sys 90 0.282 0.003 1.08 0.2939
jud/ds 79 1.010 0.012 4.41 <.0001
sys/ds 289 3.087 0.010 3.68 <.0001
resid 787 2.281 0.002
Table 1: Analysis of Variance for DUC-2003
bly because task 4 was a new task and systems were in a learning curve.
4.4 ANOVA Results
An analysis of variance was also run on the DUC-2003 task 4 multiple models and judgments study, and results are presented in Table 1. The abbre-viations for the column headings are as follows: Df (degrees of freedom), SS (sum of squares), MS (mean square), F (F value), Pr(F) (probability of F under the null hypothesis). The judge, system, and document set effects predominate as expected. Al-though still significant, the three interactions mod-eled - judge/system (jud/sys), judge/docset (jud/ds) and system/docset (sys/ds) are smaller than any of the main effects.
5 Conclusions
The secondary experiments described in this paper were by necessity small in scope and so are not conclusive. Still they consistently suggest stability of the SEE-based coverage results reported in the first three DUCs, i.e., despite large variations in the human-generated model summaries and large vari-ations in human judgments of single-model cover-age, the ranking of the systems remained compara-tively constant when averaged over dozens of docu-ment sets, dozens of peer summaries, and 10 or so judges.
Note that this is only on average, i.e. there will be variations reflected in the individual document sets and the scoring cannot be used reliably at that level. However, variation in human summaries re-flects the real application and one can only aim at improved performance on average for better sum-mary methodology.
e.g., by use of “factoids” (van Halteren and Teufel, 2003) or “summarization content units” (Passon-neau and Nenkova, 2004) as smaller units for gen-erating model summaries. The use of constraining factors such as in DUC-2003 is helpful, but only in some cases since there are many types of summaries that do not have natural constraints. Variability is-sues will likely have to be dealt with for some time and from a number of points of view.
In manual evaluations the results of this study need to be confirmed using other data. In ROUGE-like automatic evaluations that avoid variability in judgments and exploit variation in models, the ques-tion of how the number of models and their variabil-ity affect the qualvariabil-ity of the ROUGE scoring needs study.
Beyond laboratory-style evaluations, system
builders need to attend to variability. The averages hide variations that need to be analysed; systems that do well on average still need failure and suc-cess analysis on individual test cases in order to im-prove. The variations in human performance still need to be studied to understand better why these variations are occurring and what this implies about the acceptability of automatic text summarization for real end-users. The effect of variability in train-ing data on the machine learntrain-ing algorithms used in constructing many summarization systems must be understood.
References
Hongyan Jing, Regina Barzilay, Kathleen McKe-own, and Michael Elhadad. 1998. Summariza-tion evaluaSummariza-tion methods: Experiments and anal-ysis. In Intelligent Text Summarization: Papers from the 1998 AAAI Spring Symposium, pages 51–60.
Chin-Yew Lin and Eduard Hovy. 2002. Manual and automatic evaluation of summaries. In Proceed-ings of the ACL 2002 Workshop on Text Summa-rization, pages 45–51.
Rebecca Passonneau and Ani Nenkova. 2004.
Evaluating content selection in summarization: The pyramid method lexical information. In Pro-ceedings of the Human Language Technology Research Conference/North American Chapter of the Association of Computational Linguistics, pages 145–152.
Radu Soricut and Daniel Marcu. 2003. Sentence level discourse parsing using syntactic and lexical information. In Proceedings of the Human Lan-guage Technology Research Conference of the North American Chapter of the Association of Computational Linguistics, pages 228–235.
Hans van Halteren and Simone Teufel. 2003. Ex-amining the consensus between human sum-maries: Initial experiments with factoid analysis. In Proceedings of the HLT-NAACL2003 Work-shop on Text Summarization, pages 57–64. Ellen M. Voorhees. 1998. Variations in relevance
judgments and the measurement of retrieval
ef-fectiveness. In Proceedings of the 21th