CHARACTERIZING DNA BINDING MOLECULES
Thesis by James William Puckett
In Partial Fulfi llment of the Requirements for the Degree of
Doctor of Philosophy
California Institute of Technology Pasadena, California
2009
© 2009
Acknowledgements
I would like to thank my graduate research advisor, Professor Peter Dervan, for providing laboratory space, research funding, and helpful advice when asked. Thank you for providing me with a wonderful environment in which to learn as a researcher. I would like to thank the members of my thesis committee, Professor Robert Grubbs, Professor Stephen Mayo, and Professor Linda Hsieh-Wilson for their support.
I have had the opportunity to meet and work alongside many wonderful people during my tenure in the Dervan laboratories. I would like to acknowledge my collaborators in lab: Katy Muzikar, Carey Hsu, Nicholas Nickols, and Fei Yang, whose strong work ethics, scientifi c insight, and perseverance have made much of this work possible. Working in Church 316 has afforded the opportunity to interact daily with Carey Hsu, Sherry Tsai, Fei Yang, and Dan Gubler, all wonderful coworkers. I would like to thank all of the members of the Dervan lab for their friendship, especially my classmates Carey Hsu and Justin Cohen, and a more senior student, Nicholas Nickols, with whom the graduate student journey has been a true pleasure. I would like to thank John Phillips for carpooling with me from West Los Angeles to Pasadena during my fi nal year of graduate study.
I would like to acknowledge the graduate students of the Dervan group during my tenure: Timothy Best, Michael Brochu, David Chenoweth, Raymond Doss, Benjamin Edelson, Michelle Farkas, Eric Fechter, Claire Jacobs, Benjamin Li, David Montgomery, Katy Muzikar, Julie Poposki, Adam Poulin-Kerstien, and Jim Sanchez; and postdoctoral scholars Hans-Dieter Arndt, Christian Dose, Mareike Goeritz, Bogdan Olenyuk, and Anne Viger.
(TSRI), Myriam Raï (Brussels), Leslie Son (Texas), Josh Tietjen (Wisconsin), and Christopher Warren (Wisconsin). Their collaborative efforts have greatly expanded the scope of research that could be studied with polyamides.
I would like to thank members of the Wold laboratory at Caltech for helpful discussions on ChIP-Seq studies: Ali Mortazavi, Anthony Kirilusha, Ken McCue, Brian Williams, and Diane Trout. Dr. Ryan Baugh and Oren Schaedel of the Sternberg lab were kind to show me how to use their fl uorometer and allow me use of it. Thanks to Lorian Schaefer of the Millard and Muriel Jacobs Genetics and Genomics Laboratory for processing the ChIP-Seq experiments.
Abstract
Hairpin and linear beta-alanine linked pyrrole-imidazole (Py-Im) polyamides are programmable oligomers that bind the DNA minor groove sequence-specifi cally with affi nities comparable to those of DNA-binding proteins found in nature. These small molecules have been observed to localize within the nucleus of living cells and modulate endogenous gene expression. Herein, we demonstrate the utility of a linear beta-alanine linked pyrrole-imidazole polyamide to upregulate frataxin mRNA and protein expression in a cell line derived from a Friedreich’s Ataxia patient. We examine the binding affi nities and specifi cities of additional linear beta-alanine linked polyamides. We examine binding specifi cities of a Cy3-fl uorescently labeled version of the frataxin expression modulating-polyamide and a Cy3-labeled modulating-polyamide known to downregulate expression of the Vascular Endothelial Growth Factor using DNA microarrays composed of hairpins harboring all 524,800 unique 10 bp DNA sequences. We experimentally verify the correlation of Cy3
fl uorescence intensity with quantitative DNase I footprint derived binding affi nities. We
Table of Contents
Page
Acknowledgements………iii
Dedication………... v
Abstract……….. vi
List of Figures and Tables………... viii
Chapter 1 Introduction……… 1
Chapter 2A Linear β-linked Polyamides Target GAA Repeats and Alleviate Transcription Repression in Friedreich’s Ataxia Cell Culture………….. 24
Chapter 2B Footprinting Studies of Polyamides Targeting the [AAG]3 Triplet Repeat and Related Sequences………. 47
Chapter 3 Quantitative Microarray Profi ling of DNA Binding Molecules………... 69
Chapter 4 Genome-Wide Binding Profi le of Androgen Receptor in Dihydrotestosterone-Induced LNCaP Cells………... 100
Appendix A X-ray Crystal Structure of methyl 3-chlorothiophene-2-carboxylate... 120
Appendix B DNase I Footprinting and Alkylation Assays of Linear β-linked Compounds and Hairpin Polyamides Targeted to GAA Repeats……... 129
Appendix C CSI Microarray and Quantitative DNase I Footprinting Data for an Internally Cy3-labeled Linear β-linked Polyamide Targeting GAA Repeats……… 138
Appendix D ChIP-Seq Enriched Regions………... 158
List of Figures and Tables
Page
Chapter 1
Figure 1.1 X-ray crystal structure of double-stranded DNA and examination of individual DNA base pairs………... 3 Figure 1.2 X-ray crystal and NMR structures of fi ve protein–DNA complexes……... 4 Figure 1.3 The interferon beta enhanceosome……….. 5 Figure 1.4 Known X-ray Crystal Structures Demonstrating Higher-order DNA
Pack-ing………... 7 Figure 1.5 Natural products that recognize DNA……….. 8 Figure 1.6 X-ray crystal structures showing the molecular recognition of DNA by
netropsin and distamycin………... 9 Figure 1.7 Recognition of all four base pairs of DNA by designed ligands based on
the natural product distamycin………... 11 Figure 1.8 Molecular recognition of narrow, groove DNA tracts by linear beta-alanine
linked polyamides………... 12 Figure 1.9 DNA minor groove hydrogen bond recognition elements………. 13 Table 1.1 Imidazole-capped eight-ring polyamides recognize a diverse library of
DNA sequences……….. 16 Figure 1.10 Examples of polyamides used for modulation of gene expression in living
Chapter 2A
Figure 2.1 Polyamide structures, binding models and nuclear localization in cell cul-ture………... 28 Figure 2.2 DNA binding properties of the polyamides………... 29 Table 2.1 Polyamides designed to target GAA·TTC repeats in the frataxin gene…. 29 Figure 2.3 DNase I footprint analysis for polyamide 1 binding to a radiolabeled
(GAA·TTC)33 PCR product derived from plasmid pMP142 DNA,
5’- labeled on the purine strand; quantitative DNase I footprint analysis for polyamides 1 and 3 binding to a radiolabeled DNA containing a mismatch DNA sequence………... 30 Figure 2.4 Quantitative DNase I footprint analysis for polyamide 1-B……….. 31 Figure 2.5 Polyamide 1 increases the levels of frataxin mRNA and protein in an
FRDA lymphoid cell line………... 32 Table 2.2 Collected data showing the average ΔCt for normal cells (GM15851) and
FRDA cells (GM15850) before and after treatment with 1 at 2 μM…….. 33 Table 2.3 Potential match and degenerate binding sites for polyamide 1 in signifi cant
genes listed for class comparisons where P ≤ 0.005………... 36 Figure 2.6 Microarray analysis of polyamide effects on global gene expression…... 37 Figure 2.7 Effect of polyamide binding to plasmid DNA on sticky DNA stability… 39
Chapter 2B
Figure 2.8 Frataxin gene structure and model of polyamide-DNA binding………… 48 Figure 2.9 A list of polyamide structures utilized in footprinting studies on [AAG]3
repeats……… 51 Figure 2.10 Plasmid insert sequences utilized for footprinting [AAG]3-targeting
poly-amide and a 4-(2-aminoethyl) morpholine tail variant………... 53 Table 2.4 Binding affi nities (Ka, M-1) of polyamide 1 to sites I and II………. 54
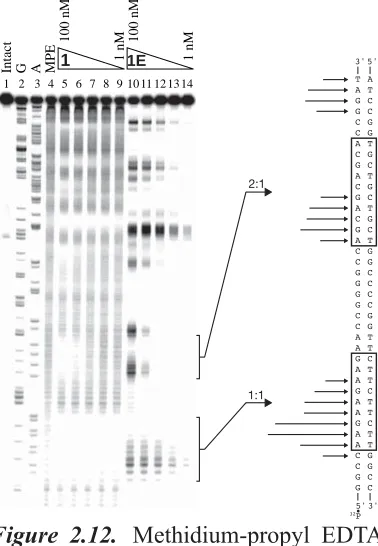
Figure 2.12 Methidium-propyl EDTA (MPE) footprinting of polyamide 1 and affi nity cleavage of polyamide 1E on pJWP10……….. 54 Table 2.5 Polyamide length titration series……… 55 Figure 2.13 Quantitative DNase I footprint titrations showing effects of polyamide
length on binding preferences and affi nities……….. 56 Figure 2.14 Quantitative DNase I footprint titrations examining binding affi nities and
preferences of double amino acid mismatch versus single amino acid mis-match polyamides on pJWP2………... 58 Table 2.6 Polyamide alternative mismatch control series………. 59 Figure 2.15 Quantitative DNase I footprint titrations showing the effects of BODIPY
Chapter 3
Figure 3.1 Methods for analyzing DNA binding specifi city………... 72
Figure 3.2 Polyamides for CSI Studies………... 74
Figure 3.3 Histogram of microarray intensities……….. 76
Figure 3.4 Histogram of microarray fractional standard deviations………... 77
Figure 3.5 Insert sequences utilized in plasmids………. 78
Figure 3.6 DNase I footprinting gels and corresponding isotherms of polyamides 1 and 2 on pKAM3 and pKAM4……….. 79
Table 3.1 Quantitative DNase I Footprinting Derived Ka values (M–1) for Polyamides 1 and 2………...79
Figure 3.7 DNase I footprinting gels and corresponding isotherms of polyamides 3 and 4 on pJWP17………... 80
Table 3.2 Quantitative DNase I Footprinting Derived Ka values (M–1) for Polyamides 3 and 4………...80
Figure 3.8 CSI array intensities correlate well with DNase I footprinting-determined Ka values………..………... 82
Figure 3.9 Correlation of footprinting data for polyamide 2 and CSI data and foot-printing data for polyamide 4 and CSI data………... 83
Figure 3.10 Cy3-labeled polyamides and unlabeled polyamides correlate well……... 84
Figure 3.11 Sequence Logo for polyamide 2……… 85
Figure 3.12 Sequence Logo for polyamide 4……… 85
Figure 3.13 Ka-weighting components of individual sequence logos does not alter the sequence logo………. 85
Table 3.3 Microarray-Derived Binding Affi nities and Specifi cities of All Single Base Pair Mismatch Sites for Polyamide 2………... 86
Chapter 4
Figure 4.1 Overview of Androgen Receptor Biology………....103 Figure 4.2 Polyamides can target and regulate Androgen Receptor (AR)-driven Gene
Transcription……… 104 Figure 4.3 Overview of Chromatin Immunoprecipitation followed by
High-through-put DNA Sequencing (ChIP-Seq) ………... 105 Figure 4.4 Verifi cation of Initial ChIP data for Sequencing Submission…………...107 Table 4.1 Summary statistics of ChIP-Seq data………... 107 Figure 4.5 Method for fi nding multiple sequencing motifs using motif-fi nding
algo-rithms………... 109 Figure 4.6 The Canonical ARE sequence was found using the 593 most strongly
en-riched binding regions………... 109 Table 4.2 Prevalence of other ARE Elements in the genome and an upper estimate
on the number of ARE binding sites……… 110 Figure 4.7 Sequence logo of a conserved motif that contains an ARE half-site and a
forkhead protein binding site………... 111 Figure 4.8 Sequence logos of known transcription factor motifs overrepresented
within the Androgen Receptor Immunoprecipitated Regions………….. 113 Figure 4.9 An overview of the number of androgen receptor immunoprecipitated
regions that fail to map with nearby genes as a function of search radius….
……….. 114
Figure 4.10 The distribution of regions of gene occupancy for androgen receptor bind-ing regions within proximity to genes………... 114 Figure 4.11 Venn diagram correlating AR binding events in proximity to genes with
Appendix A
Figure A.1 Chemical structure of methyl 3-chlorothiophene-2-carboxylate (1) …...121 Table A.1 Crystal data and structure refi nement for 1……….. 122 Table A.2 Atomic coordinates and equivalent isotropic displacement parameters for
1……… 124
Table A.3 Bond lengths [Å] and angles [°] for 1……….. 124 Table A.4 Anisotropic displacement parameters for 1………. 125 Table A.5 Hydrogen coordinates and isotopic displacement parameters for 1……125 Figure A.2 ORTEP representation of methyl 3-chlorothiophene-2-carboxylate…... 126 Figure A.3 Crystal packing and van der Waal’s contacts for methyl
Appendix B
Figure B.1 Overview of Polyamides Studied on pJWP12 and pJWP11 and plasmid sequences of pJWP12 and pJWP11………. 131 Figure B.2 Quantitative DNase I footprint of a linear β-linked polyamide targeting
GAA repeats………. 132 Figure B.3 Quantitative DNase I footprints for two linear β-linked polyamides, one
containing a β→ Gly point mutation and the other containing a β→ Py point mutation……….. 133 Figure B.4 Quantitative DNase I footprint of a hairpin polyamide targeting GAA
repeats……….. 134 Figure B.5 Quantitative DNase I footprint of two Cy3-labeled, linear β-linked
poly-amides targeting GAA repeats………... 135 Figure B.6 A Chlorambucil-labeled GAA-targeting β-linked polyamide alkylates
Appendix C
Figure C.1 Polyamides utilized to study the effects of dye placement on CSI microar-ray determined binding preferences………... 141 Figure C.2 CSI Intensity Histogram for polyamide 3……… 143 Figure C.3 CSI Fractional Standard Deviation Histogram for polyamide 3……….. 143 Figure C.4 Plasmids utilized to footprint polyamides 1 and 3………... 144 Figure C.5 Quantitative DNase I footprint titrations of polyamides 1 and 3 on
plas-mids pJWP16 and pJWP18………... 145 Table C.1 Quantitative DNase I Footprinting Derived Ka values (M–1) for Polyamides
1 and 2………... 146 Figure C.6 CSI array intensities correlate well with DNase I footprinting-determined
Ka values.……….. 146
Figure C.7 Cy3-labeled polyamide 3 and unlabeled polyamide 1 correlate well….. 147 Figure C.8 Scatter Plot Correlation of End-labeled Cy3-polyamide 2 with
Internally-labeled Cy3-polyamide 3………. 147 Figure C.9 Sequence logo for polyamide 3……… 148 Table C.2 Microarray-Derived Binding Affi nities and Specifi cities of All Single Base
Pair Mismatch Sites for Polyamide 3………... 149 Table C.3 Microarray-Derived Binding Affi nities and Specifi cities of All Single Base
Appendix D
Chapter 1
Deoxyribonucleic Acid (DNA)
Deoxyribunocleic acid is the double-stranded, double-helical biopolymer that encodes all heritable information necessary to maintain life and the complex networks of gene expression and protein expression that ultimately result from its sequence. All combinations of DNA sequence polymers can be made from four monomers called nucleotides: deoxyadenosine (A), deoxycytidine (C), deoxyguanosine (G), and deoxythymidine (T), each connected to one another on a phosphodiester-linked deoxyribose sugar backbone. For each double-stranded duplex, there are rules that govern pairing of each of the four nucleotides: A pairs with T, and T with A; C pairs with G, and G with C. Several sequence and context dependent forms of DNA exist, such as A-form, B-form, and Z-form.1,2 Of
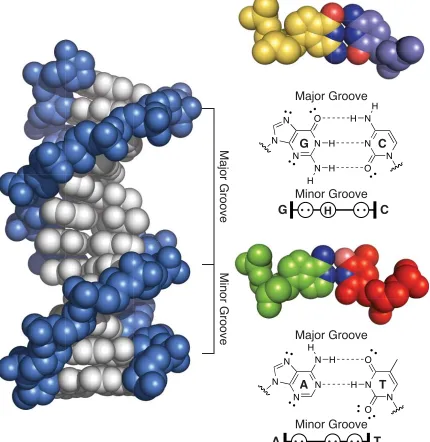
these, I will focus the discussion on B-form DNA as it will be most relevant to this thesis. An X-ray crystal structure of B-form DNA is shown in Figure 1.1.1 The
three-dimensional structure of the clefts within DNA can be subdivided into a “major” groove and a “minor” groove. The phosphodiester-linked deoxyribose sugar backbone of DNA is highlighted in blue, and the individual bases are shown in a silver color. Each base pair is oriented perpinduclarly to the helical axis of DNA. Ten base pairs of DNA represent a full turn of the DNA helix. Space-fi lling representations of A·T and G·C base pairs are shown in Figure 1.1. Two hydrogen bonds form between A·T base pairs and three between G·C base pairs. Beneath each base pair is shown the minor groove hydrogen bonding pattern.
Protein-DNA Recognition
The three billion base pairs of DNA within a human cell nucleus contains the information which encodes 20,000 to 25,000 protein-coding genes.3 DNA is transcribed
Major Groove
M
inor Groove
N N
N N N
N
N H H
H
O H N
H
O
G C
Major Groove
Minor Groove
A T
Major Groove
Minor Groove
:
:
:
A T
:
:
H
G C
N N
N N O
H
O N
H H N
N
NF-κB (p50 / p65 heterodimer) Zif268 (Zinc Finger Protein)
LEF-1 (HMG Box)
ETS-1 (winged
helix-turn-helix) TBP (minor
groove-binding protein)
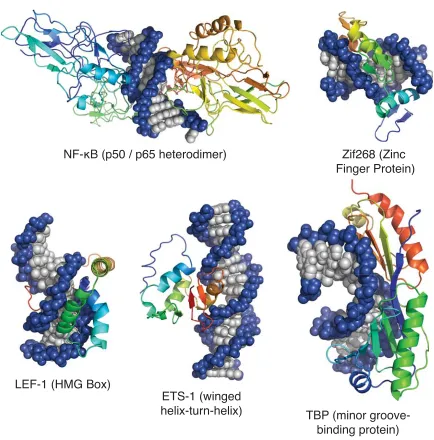
Figure 1.2. X-ray crystal and NMR structures of fi ve protein–DNA complexes:
NF-κB–DNA (PDB 1VKX), Zif268–DNA (PDB 1ZAA), LEF-1–DNA (PDB 2LEF), ETS-1–DNA (PDB 2STW), and TBP–DNA (PDB 1TGH)
Transcription factors can be segmented into three recognition groups: a group that targets the minor groove of DNA, a group that binds the major groove, and a group that binds a hybrid of the two grooves. Of the proteins shown in Figure 1.2, NF-κB (p50/p65 heterodimer), Zif268, and Ets-1 recognize the major groove of DNA.4–6 TATA-Binding
Protein (TBP) and LEF-1 each recognize the minor groove of DNA.7,8 Of these proteins,
RelA
RelA
p50
p50
IRF-7D
IRF-7D IRF-3C
IRF-3C IRF-3A
IRF-3A
IRF-7B
IRF-7B
ATF-2
ATF-2
c-Jun
c-Jun
160 Å
110 Å
5'-TAAATGACATAGGAAAACTGAAAGGGAGAAGTGAAAGTGGGAAATTCCTCTG -3' 3'- TTTACTGTATCCTTTTGACTTTCCCTCTTCACTTTCACCCTTTAAGGAGACA-5'
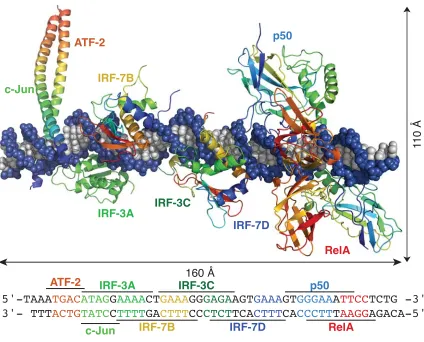
Figure 1.3. The interferon beta enhanceosome: a composite model of allosterically-driven protein–DNA recognition created from overlayed X-ray crystal structures (PDB 2O6G, 2O61)
Specifi cities of in vitro binding preferences for transcription factors have been studied by selective mutation studies to known binding sites and by SELEX (Systematic Evolution of Ligands by Exponential Enrichment), which gives rise to a preferred match site for the protein.10–13 These in vitro binding data have been cataloged in both the TRANSFAC
database and the JASPAR database.14,15 More recent work has examined protein-DNA
Allosteric Recognition of DNA
The fi rst example of allosterically modulated protein-DNA specifi city on an enhancer was recently observed by Harrison, Maniatis, and co-workers, who used two crystal structures of proteins complexed with DNA (ATF-2/c-Jun, IRF-3A, IRF-7B, IRF-3C, IRF-7D, p50, and RelA) to create a model structure of the interferon-beta enhanceosome (Figure 1.3).20
There are no protein-protein contacts between any of the proteins on this DNA sequence. Thus, it has been proposed that structural alterations to the DNA, such as widening or narrowing of the major or minor groove by individual protein-DNA interactions creates optimum binding shape and structure for other proteins, in a cooperative interaction.20
Higher Order DNA Structures
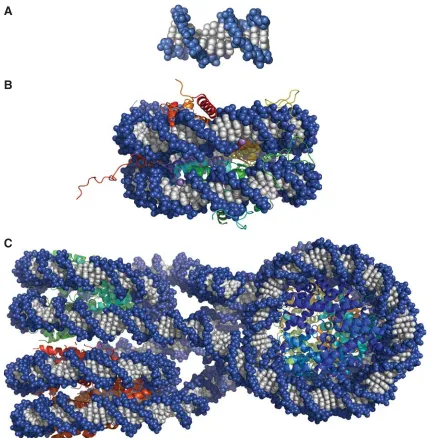
While discussion of DNA to this point has examined its structure in the absence and presence of proteins, the structure found inside cellular environments is far more complex. To demonstrate the layers of folding that occur as DNA is compacted inside of a cell nucleus, Figure 1.4 shows the progression from naked DNA (Figure 1.4A)1 to
the nucleosome (Figure 1.4B)21 to the tetranucleosome (Figure 1.4C).22 These are the
known high-resolution structures. Packing continues to chromatin fi bre, which has been modeled,22 and with more structural proteins, eventually to a single chromosome. The
transition of DNA to the nucleosome is facilitated by an histone octamer, consisting of two copies each of histones H2A, H2B, H3, and H4. Duplex DNA wraps twice about the histone octamer, forming a 146–147 bp nucleosome.21 Until recently, this was the only
Figure 1.4. Known X-ray Crystal Structures Demonstrating Higher-order DNA Pack-ing. a) X-ray crystal structure of double-stranded DNA (PDB 1BNA). b) X-ray crystal structure of 147 bp nucleosome core particle (PDB 1KX5). c) X-ray crystal structure of tetranucleosome, showing how nucleosomes pack (PDB 1ZBB)
A
B
Chromomycin A3 • 5’-GGCC-3’ N NH H O O NH N H N O N O HN NH2 NH2
Distamycin A • 5’-(A,T)5-3’
Actinomycin D • 5’-GC-3’ Calicheamicin oligosaccharide • 5’-TCCT-3’
O N NH O NH N N N O O O O O O HN O HN N N N O O O O O O NH2 O
OH OH O
O O O O O OCOMe M eO HO H O OMe OH OH O OH O O OH O O OHOCOMe I O OMe OH M eO HO S O O OH O N H O OM e HO O O MeO H N
Figure 1.5. Natural products that recognize DNA: chromomycin, distamycin, actinomy-cin D, and calicheamiactinomy-cin oligosaccharide
Natural Products that Recognize DNA
In addition to the nuclear proteins that recognize and bind DNA, there are numerous natural products that bind DNA in a sequence-specifi c fashion. Four are shown in Figure 1.5: chromomycin, distamycin, actinomycin D, and calicheamicin oligosaccharide. Chromomycin recognizes the minor groove of DNA, targets the sequence 5’-GGCC-3,’ and binds in a 2:1 ligand:DNA stoichiometry. Chromomycin is believed to be biologically active by interfering with replication and transcription.23 Actinomycin D intercalates DNA
preferentially at 5’-GC-3’ sequences in a 1:1 ligand:DNA stoichiometry. It has been used as a chemotherapeutic and is known to inhibit transcription and potentially DNA replication as well.24,25 Calicheamicin oligosaccharide binds the DNA minor groove as a monomer and
N H O
N HN O
N O HN
H2N
NH2 H
N H2N
H2N
1:1
Small Molecule:DNA Stoichiometry
2:1
Small Molecule:DNA Stoichiometry
N NH
O N
HN O
N O
HN
H2N
NH2
NH O
Distamycin A Netropsin
Figure 1.6. X-ray crystal structures showing the molecular recognition of DNA by netropsin (PDB 6BNA) and distamycin (PDB 2DND in a 1:1 complex with DNA and PDB 378D in a 2:1 complex with DNA), both oligopyrrole natural products
Molecular Recognition of DNA by Distamycin and Netropsin
Distamycin and netropsin are both low molecular weight oligomers of N-methylpyrrole carboxamides, with distamycin containing three monomer units and netropsin containing two.27,28 X-ray crystal structures of netropsin and distamycin are
shown in Figure 1.6.27,29–31 Netropsin and distamycin each recognize A,T tracts of DNA.
Netropsin is known to bind in a 1:1 ligand:DNA complex,29 whereas distamycin can bind
both in a 1:1 and 2:1 ligand:DNA stoichiometry.30,31 The positively charged tails at the N-
Binding in 1:1 and 2:1 ligand:DNA stoichiometries alters the width and depth of the minor groove of DNA. In the 1:1 ligand:DNA binding cases, the minor groove of DNA narrows and deepens upon ligand binding.27,29,30 In the 2:1 ligand:DNA binding case,
distamycin binds as an antiparallel dimer and widens the minor groove. The hydrogen bonding patterns present in the minor groove are presented more closely to the distamycin, making a shallower groove.31 Through the X-ray crystal structures of these ligands, it
was originally suggested that the minor groove-protruding exocyclic amine of guanine in G·C base pairs may be accommodated by utilizing N-methylimidazole in place of N-methylpyrrole.27,29 This substitution32–34 lead to the beginnings of a pairing code for
binding of synthetically modifi ed distamycin-like molecules, which have been called polyamides.35,36
Polyamide Recognition of the DNA Minor Groove
The incorporation of N-methylimidazole (Im) into a distamycin-like polymer: Im-Py-Py-Dp yielded not a 5’-SWW-3’ (S = G,C; W = A,T) recognition sequence but rather 5’-WGWCW-3,’ from which it was proposed that a 2:1 ligand:DNA binding stoichiometry could account for the observation.32,33,35 These side-by-side minor groove ring pairings
would form the basis for recognition of all four DNA base pairs. G·C, C·G, and A·T/T·A could be targeted using N-methylimidazole (Im) and N-methylpyrrole ligands (Py) bound side-by-side. When Im was adjacent to Py (Im / Py), G·C was read. Py / Im reads C·G, and Py / Py reads A·T or T·A. The specifi city problem between A·T and T·A minor groove recognition was soon resolved with the introduction of the N-methyl-3-hydroxypyrrole monomer (Hp). In this case, Hp / Py reads T·A, while Py / Hp reads A·T.37 When
Pair G·C C·G T·A A·T Im/Py
Py/Im Hp/Py Py/Hp Py/Py
+ +
+ + + +
– – –
– – – –
– –
– –
– –
– C
B A
5'-C C A G T A C T G G-3'
3'-G G T C A T G A C C-5'
+H
+ H
3.5 Å 2.8 Å
3.0 Å
Hp Py
Im Py
G C
T A
Figure 1.7. Recognition of all four base pairs of DNA by designed ligands based on the natural product distamycin. a) X-ray crystal structure of a 2:1 ligand:DNA decamer complex bound by the polyamide ligand Im-Hp-Py-Py-β-Dp (PDB 407D). Filled circles represent Im; orange circles with white H, Hp; hollow circles, Py; greyed diamonds, β; and half-circle with plus sign, Dp. b) Putative hydrogen-bond contacts made between polyamide monomers and individual base pairs. c) Polyamide pairing code for minor groove recognition of duplex DNA. A “+” denotes a favored interaction, and a “–” denotes a disfavored interaction.
Py.38,39 Each of these monomers is shown in Figure 1.9B.
X-ray crystallography enabled the full structural understanding of DNA minor-groove recognition by polyamides, fi rst for the basis for the G·C specifi c recognition40 and
then for A·T specifi c recognition (Figure 1.7).41 The 2:1 binding polyamides generally
orient themselves from N-terminus to C-terminus relative to DNA read 5’ to 3.’42
beta-Figure 1.8. Molecular recognition of narrow, minor groove DNA tracts by linear beta-alanine linked polyamides. a) Average NMR structure of Im-Py-β-Im-β-Im-Py-β-Dp (PDB 1LEJ). In the ball-and-stick polyamide structure, fi lled circles represent Im, hollow circles Py, greyed dia-monds β, and half-circle with a plus sign, Dp. b) Observed specifi city of polyamide monomers in a 1:1 polyamide:DNA complex. A “+” indicates a favored interaction, and a “–” indicates a disfavored interac-tion.
A A
+
5'-C C A A A G A G A A G C G-3'
3'-G G T T T C T C T T C G C-5'
B
Ring G·C C·G T·A A·T
Im Py β Hp
+ –
+ +
+ + +
+ + + –
–
– – –
–
Figure 1.9. DNA minor groove hydrogen bond recognition elements. a) Minor groove hydrogen bond donors and acceptors for all four base pairs. b) Monomers found in polyamides. The ball-and-stick symbols as well as abbreviations are listed below the chemical structures. c) Potential hydrogen
bonds formed between 5’-WTACGW-3’ and a hairpin polyamide, Ct-Py-Py-Im-(R)H2Nγ-Py-Im-Py-Py-β-Dp.
d) Potential hydrogen bonds formed between 5’-AAGAAGAAG-3’ and a linear β-linked polyamide,
A B C D N N N N O N N N N O H H R R H H H N N N N N N N O O H H R R H N N N N O N N N N O H H R R H H H N N N N N N N O O H H R R H : : : A T
: H :
G C C : H : G
:
: : A
T O N O N O Cl Im/Py targets G·C Py/Im targets C·G β-alanine targets A·T,T·A Dp tail targets A·T,T·A γ-DABA-turn targets A·T,T·A Py/Py targets A·T,T·A Ct/Py targets T·A T G C A T A 5’ 3’ A C G T A T S N H N H N H N N N O H N N O H N N N O H N N O H N N H O N O H O N N H H NH3 : : : : : : : : : : : H
: H :
:
: :
5'-T A T A C G T-3'
3'-A T A T G C A-5'
+ + 3’ 5’ N H N H +
5'-A A G A A G A A G-3' 3'-T T C T T C T T C-5'
β N H O Im N N O N H Dp + Ct S O Cl
+ γ-DABA
polyamide class—Im is degenerate for all four base pairs, Py and β prefer W (A,T) over S (G,C), and Hp prefers A·T in the homo-purine strand, although at lower binding affi nity.44
The linear β-linked polyamides orient themselves from N-terminus to C-terminus relative to DNA read from 3’ to 5’ on the purine-rich strand of DNA.43–45 The NMR structure of a
linear β-linked polyamide in complex with DNA has been solved.45 Figure 1.9D shows an
example of the hydrogen bond recognition between a polypurine tract of DNA and a linear
β-linked polyamide that targets 5’-AAGAAGAAG-3.’
Polyamides that are currently used are generally derived from 2:1 binding class and less frequently from the 1:1 binding class. To prepay the entropic costs of polyamide dimerization, a hairpin “turn-unit,” γ-aminobutyric acid, was used to covalently attach the two polyamide oligomers in an antiparallel fashion (Figure 1.9C).46 This covalent
modifi cation allowed subnanomolar concentrations of ligands to target 5’-WGTACW-3.’47
Other covalent linkages have been utilized: the H-pin polyamide motif,48 the U-pin
polyamide motif,49 and the cyclic polyamide motif,50 although the hairpin motif has
been most widely studied. Because hairpin polyamides occasionally align N-terminus to C-terminus against DNA read 3’ to 5,’ the γ-aminobutyric acid linker was modifi ed to an (R)-2,4-diaminobutyric acid, which increased binding affi nity and enforced an N to C terminus alignment with DNA read 5’ to 3.’42,51 Hairpin polyamides typically are
constructed from eight aromatic heterocycles, or “rings,” and target six base pairs.
Recent work has completed a library of all possible eight-ring hairpin polyamides that have an N-terminal N-methylimidazole monomer.52 Much of the scope of known
General (5’→3’) Polyamide Ka(M 1) Sequence context
1WWGWWWW + 3 l09 5’-TAGTATT-3’
2WWGGWWW + 5 l08 5’-CTGGTTA-3’
3WWGWGWW + + 4 l09 5’-TAGTGAA-3’
4WWGWWGW + + 9 l0
9 5’-TAGTAGT-3’
5WWGWWCW + 3 l010 5’-TAGTACT-3’
6WWGWCWW + + 2 l09 5’-GAGTCTA-3’
7WWGCWWW + + 5 l09 5’-ATGCAAA-3’
8WWGGGWW + 3 l08 5’-AAGGGAA-3’
9WWGGWGW + + 1 l010 5’-TAGGTGT-3’
10WWGGWCW + 1 l010 5’-ATGGTCA-3’
11WWGGCWW + 4 108 5’-AAGGCAT-3’
12WWGWGGW + + 4 1010 5’-TAGTGGT-3’
13WWGWGCW + + 2 l09 5’-ATGAGCT-3’
14WWGCGWW + + 2 l09 5’-ATGCGTA-3’
15WWGCWGW + + 2 l09 5’-TAGCAGT-3’
16WWGCWCW + + 9 l09 5’-ATGCTCA-3’
17WWGWCGW + + 1 l010 5’-ATGACGT-3’
18WWGWCCW + 2 l09 5’-TAGACCA-3’
19WWGCCWW + + 7 l08 5’-ATGCCTA-3’
20WWGGGGW + + 2 l08 5’-GAGGGGT-3’
21WWGCGGW + + 9 l08 5’-ATGCGGT-3’
22WWGGCGW + + 2 l08 5’-CAGGCGT-3’
23WWGGGCW + + 1 l08 5’-CTGGGCA-3’
24WWGCCGW + + 2 l09 5’-ATGCCGT-3’
25WWGGCCW + 9 l09 5’-ATGGCCA-3’
26WWGCGCW + 3 l09 5’-ATGCGCA-3’
27WWGCCCW + + 1 l09 5’-ATGCCCA-3’
Polyamides for Control of Gene Expression
The selective modulation of gene networks by programmable oligomers that specify short DNA sequences holds promise for new approaches to molecular medicine. The DNA minor groove-binding-polyamides have been utilized in several instances to modulate gene expression in cell culture (Figure 1.10). This ability did not come without three key studies on nuclear localization of polyamides in live cell culture.53,54 Hypoxia inducible factor 1α
(HIF-1α) is a transcription factor that drives the expression of vascular endothelial growth factor (VEGF), a gene responsible for the vascularization of tumors. HIF-1α targets the Hypoxic Response Element (HRE) consensus sequence, 5’-TACGTG-3,’ a subset of which is recognized by Ct-Py-Py-Im-(R)-H2Nγ-Py-Im-Py-Py-Dp-IPA (1). HeLa and U251 cells
have been dosed with 1 and induced with deferoxamine (DFO). HIF-1α-modulated genes have much lower inductions in the presence of polyamide 1. In the presence of a polyamide that does not bind the HRE (2), a statistically insignifi cant change in VEGF expression occurs. Microarray experiments have shown that polyamide 1 downregulates a subset of genes upregulated by DFO induction. Furthermore, chromatin immunoprecipitation (ChIP) experiments demonstrated a reduced occupancy of HIF-1α at the VEGF HRE in the presence of polyamide 1, suggesting that the polyamide acts in a sequence programmed, specifi c manner.55–57
Gene expression regulated by androgen receptor (AR) is critical in the development and progression of prostate cancer. Prostate specifi c antigen (PSA) is a well-studied marker gene that correlates with the presence of prostate cancer. Androgen receptor binds as a homodimer to the androgen response element (ARE), 5’-GGTACAnnnTGTTCT-3,’ a sequence which can readily be targeted by an eight-ring Py/Im hairpin polyamide, Im-Py-Py-Py-(R)-H2Nγ-Im-Py-Py-Py-Dp-IPA (3). In the presence of dihydrotestosterone (DHT)
induction, LNCaP cells dosed with polyamide 3 exhibit suppressed PSA induction. A mismatch control polyamide targeting 5’-WGWCGW-3’ (Im-Py-Py-Im-(R)-H2Nγ
experiments on 3 and 4 showed 3 to disrupt induction by DHT for a subset of the DHT-induced genes. ChIP experiments on 3 and 4 again suggest the disruption of a protein-DNA interface as a potential mechanism for polyamide activity.58
Scope of this Thesis
In Chapter 2, we explore the use of a linear β-linked polyamide for upregulation of frataxin expression in cell culture. We also explore binding properties of other linear
β-linked polyamides by DNase I footprint titrations (also in Appendix B).59 In Chapter
3, we utilize DNA microarrays to examine the binding preferences of the linear β-linked
Figure 1.10. Examples of polyamides used for modulation of gene expression in living cell culture. a) Structure of VEGF promoter showing inhibition of HRE binding by the HIF-1α/HIF-1β
dimer inhibits gene transcription. b) HRE enhancer binding sequence shown with match polyamide 1. c) Match (1) and mismatch (2) polyamides utilized to target the HRE. d) Model of the androgen receptor transcription complex. e) Consensus ARE targeted by match polyamide 3. f) Match (3) and mismatch (4) polyamides utilized to target the ARE.
AR
A R AR
Pol II p160 p300 Transcription
5’-GGTACANNNTGTTCT-3’
3’-CCATGTNNNACAAGA-5’
Consensus ARE 3 3 D A E B F C AR TBP Pol II Med p160 p300 3 + + IPA 4 + IPA + + IPA + + IPA N H N O N H N O N N H O N HN N N H N O N H N O N N N H O NH O NH3 N N H O N N H N O O O -O H N H N O N H N O N N H O N HN N N H N O N N H N O N N H O NH O NH3 N N H O N H N O O O -O H M ed M ed p160 O H N N H N O N H N O N N H N O N H N ONH3+
NH O N N N H O N N H O N NH+ HN O O −O N H O S Cl 1 2 O H N N H N O N H N O N H N O N N H N O NH O N N H O N N H O N N HN O O N H O N N
NH3+
NH+ −O + + IPA + + IPA + + IPA HRE vegf
5‘- C A G T G C A T A C G T G G G C T C - 3‘
3‘- G T C A C G T A T G C A C C C G A G - 5‘ 1
HIF-1
X
α β
References
(1) Drew, H. R.; Wing, R. M.; Takano, T.; Broka, C.; Tanaka, S.; Itakura, K.; Dickerson, R. E. Proc. Natl. Acad. Sci. U. S. A. 1981, 78, 2179–83.
(2) Dickerson, R. E.; Drew, H. R.; Conner, B. N.; Wing, R. M.; Fratini, A. V.; Kopka, M. L. Science 1982, 216, 475–85.
(3) Consortium, I. H. G. S. Nature 2004, 431, 931–45. (4) Pavletich, N. P.; Pabo, C. O. Science 1991, 252, 809–17.
(5) Werner, M. H.; Clore, G. M.; Fisher, C. L.; Fisher, R. J.; Trinh, L.; Shiloach, J.; Gronenborn, A. M. J. Biomol. NMR 1997, 10, 317–28.
(6) Chen, F. E.; Huang, D. B.; Chen, Y. Q.; Ghosh, G. Nature 1998, 391, 410–3. (7) Love, J. J.; Li, X.; Case, D. A.; Giese, K.; Grosschedl, R.; Wright, P. E. Nature
1995, 376, 791–5.
(8) Juo, Z. S.; Chiu, T. K.; Leiberman, P. M.; Baikalov, I.; Berk, A. J.; Dickerson, R. E. J. Mol. Biol. 1996, 261, 239–54.
(9) Jamieson, A. C.; Miller, J. C.; Pabo, C. O. Nat. Rev. Drug Discov. 2003, 2, 361–8. (10) Roulet, E.; Busso, S.; Camargo, A. A.; Simpson, A. J.; Mermod, N.; Bucher, P. Nat.
Biotechnol. 2002, 20, 831–5.
(11) Klug, S. J.; Famulok, M. Mol. Biol. Rep. 1994, 20, 97–107.
(12) Roulet, E.; Bucher, P.; Schneider, R.; Wingender, E.; Dusserre, Y.; Werner, T.; Mermod, N. J. Mol. Biol. 2000, 297, 833–48.
(13) Fields, D. S.; He, Y.; Al-Uzri, A. Y.; Stormo, G. D. J. Mol. Biol. 1997, 271, 178– 94.
(14) Wingender, E.; Dietze, P.; Karas, H.; Knuppel, R. Nucleic Acids Res. 1996, 24, 238–41.
(15) Sandelin, A.; Alkema, W.; Engstrom, P.; Wasserman, W. W.; Lenhard, B. Nucleic Acids Res. 2004, 32, D91–4.
M. L. Nat. Biotechnol. 2006, 24, 1429–35.
(17) Bulyk, M. L.; Gentalen, E.; Lockhart, D. J.; Church, G. M. Nat. Biotechnol. 1999, 17, 573–7.
(18) Bulyk, M. L.; Huang, X.; Choo, Y.; Church, G. M. Proc. Natl. Acad. Sci. U. S. A.
2001, 98, 7158–63.
(19) Badis, G.; Chan, E. T.; van Bakel, H.; Pena-Castillo, L.; Tillo, D.; Tsui, K.; Carlson, C. D.; Gossett, A. J.; Hasinoff, M. J.; Warren, C. L.; Gebbia, M.; Talukder, S.; Yang, A.; Mnaimneh, S.; Terterov, D.; Coburn, D.; Li Yeo, A.; Yeo, Z. X.; Clarke, N. D.; Lieb, J. D.; Ansari, A. Z.; Nislow, C.; Hughes, T. R. Mol. Cell 2008, 32, 878–87. (20) Panne, D.; Maniatis, T.; Harrison, S. C. Cell 2007, 129, 1111–23.
(21) Davey, C. A.; Sargent, D. F.; Luger, K.; Maeder, A. W.; Richmond, T. J. J. Mol. Biol. 2002, 319, 1097–113.
(22) Schalch, T.; Duda, S.; Sargent, D. F.; Richmond, T. J. Nature 2005, 436, 138–41. (23) Hou, M. H.; Robinson, H.; Gao, Y. G.; Wang, A. H. Nucleic Acids Res. 2004, 32,
2214–22.
(24) Kamitori, S.; Takusagawa, F. J. Am. Chem. Soc. 1994, 116, 4154–4165.
(25) Hou, M. H.; Robinson, H.; Gao, Y. G.; Wang, A. H. Nucleic Acids Res. 2002, 30, 4910–7.
(26) Bifulco, G.; Galeone, A.; Nicolaou, K. C.; Chazin, W. J.; Gomez-Paloma, L. J. Am. Chem. Soc. 1998, 120, 7183–7191.
(27) Kopka, M. L.; Yoon, C.; Goodsell, D.; Pjura, P.; Dickerson, R. E. Proc. Natl. Acad. Sci. U. S. A. 1985, 82, 1376–80.
(28) Arcamone, F.; Penco, S.; Orezzi, P.; Nicolella, V.; Pirelli, A. Nature 1964, 203, 1064–5.
(29) Kopka, M. L.; Yoon, C.; Goodsell, D.; Pjura, P.; Dickerson, R. E. J. Mol. Biol.
1985, 183, 553–63.
1987, 84, 8385–9.
(31) Mitra, S. N.; Wahl, M. C.; Sundaralingam, M. Acta Crystallogr. 1999, D55, 602– 9.
(32) Mrksich, M.; Wade, W. S.; Dwyer, T. J.; Geierstanger, B. H.; Wemmer, D. E.; Dervan, P. B. Proc. Natl. Acad. Sci. U. S. A. 1992, 89, 7586–90.
(33) Wade, W. S.; Mrksich, M.; Dervan, P. B. J. Am. Chem. Soc. 1992, 114, 8783– 8794.
(34) Geierstanger, B. H.; Mrksich, M.; Dervan, P. B.; Wemmer, D. E. Science 1994, 266, 646–50.
(35) Dervan, P. B. Bioorg. Med. Chem. 2001, 9, 2215–35.
(36) Dervan, P. B.; Edelson, B. S. Curr. Opin. Struct. Biol. 2003, 13, 284–99.
(37) White, S.; Szewczyk, J. W.; Turner, J. M.; Baird, E. E.; Dervan, P. B. Nature 1998, 391, 468–71.
(38) Trauger, J. W.; Baird, E. E.; Mrksich, M.; Dervan, P. B. J. Am. Chem. Soc. 1996, 118, 6160–6166.
(39) Turner, J. M.; Swalley, S. E.; Baird, E. E.; Dervan, P. B. J. Am. Chem. Soc. 1998, 120, 6219–6226.
(40) Kielkopf, C. L.; Baird, E. E.; Dervan, P. B.; Rees, D. C. Nat. Struct. Biol. 1998, 5, 104–9.
(41) Kielkopf, C. L.; White, S.; Szewczyk, J. W.; Turner, J. M.; Baird, E. E.; Dervan, P. B.; Rees, D. C. Science 1998, 282, 111–5.
(42) White, S.; Baird, E. E.; Dervan, P. B. J. Am. Chem. Soc. 1997, 1997, 8756–8765. (43) Dervan, P. B.; Urbach, A. R. In Essays in Contemporary Chemistry; Quinkert, G.,
Kisakürek, M. V., Eds.; Verlag Helvetica Chimica Acta: Zurich, 2000, p 327–339. (44) Urbach, A. R.; Dervan, P. B. Proc. Natl. Acad. Sci. U. S. A. 2001, 98, 4343–8. (45) Urbach, A. R.; Love, J. J.; Ross, S. A.; Dervan, P. B. J. Mol. Biol. 2002, 320, 55–
(46) Mrksich, M.; Parks, M. E.; Dervan, P. B. J. Am. Chem. Soc. 1994, 116, 7983– 7988.
(47) Trauger, J. W.; Baird, E. E.; Dervan, P. B. Nature 1996, 382, 559–61.
(48) Greenberg, W. A.; Baird, E. E.; Dervan, P. B. Chem.-Eur. J. 1998, 4, 796–805. (49) Heckel, A.; Dervan, P. B. Chem.-Eur. J. 2003, 9, 3353–66.
(50) Cho, J.; Parks, M. E.; Dervan, P. B. Proc. Natl. Acad. Sci. U. S. A. 1995, 92, 10389– 92.
(51) Herman, D. M.; Baird, E. E.; Dervan, P. B. J. Am. Chem. Soc. 1998, 120, 1382– 1391.
(52) Hsu, C. F.; Phillips, J. W.; Trauger, J. W.; Farkas, M. E.; Belitsky, J. M.; Heckel, A.; Olenyuk, B. Z.; Puckett, J. W.; Wang, C. C.; Dervan, P. B. Tetrahedron 2007, 63, 6146–6151.
(53) (a) Belitsky, J. M.; Leslie, S. J.; Arora, P. S.; Beerman, T. A.; Dervan, P. B. Bioorg. Med. Chem. 2002, 10, 3313–8. (b) Best, T. P.; Edelson, B. S.; Nickols, N. G.; Dervan, P. B. Proc. Natl. Acad. Sci. U. S. A. 2003, 100, 12063–8.
(54) Edelson, B. S.; Best, T. P.; Olenyuk, B.; Nickols, N. G.; Doss, R. M.; Foister, S.; Heckel, A.; Dervan, P. B. Nucleic Acids Res. 2004, 32, 2802–18.
(55) Olenyuk, B. Z.; Zhang, G. J.; Klco, J. M.; Nickols, N. G.; Kaelin, W. G., Jr.; Dervan, P. B. Proc. Natl. Acad. Sci. U. S. A. 2004, 101, 16768–73.
(56) Nickols, N. G.; Jacobs, C. S.; Farkas, M. E.; Dervan, P. B. ACS Chem. Biol. 2007, 2, 561–71.
(57) Nickols, N. G.; Jacobs, C. S.; Farkas, M. E.; Dervan, P. B. Nucleic Acids Res. 2007, 35, 363–70.
(Burnett, R.; Melander, C.; Puckett, J. W.; Son, L. S.; Wells, R. D.; Dervan, P. B.; Gottes-feld, J. M. “DNA sequence-specifi c polyamides alleviate transcription inhibition associ-ated with long GAA·TTC repeats in Friedreich’s ataxia.” Proc. Natl. Acad. Sci. U. S. A.
2006, 103, 11497–11502.)
The text of this chapter was taken in part from a manuscript co-authored with Ryan Bur-nett, Christian Melander, Leslie S. Son, Professor Robert D. Wells (Texas A & M Health Science Center), Professor Joel M. Gottesfeld (The Scripps Research Institute), and Pro-fessor Peter B. Dervan (California Institute of Technology).
Chapter 2
Chapter 2A
DNA sequence-speci
fi
c polyamides alleviate transcription
inhibition associated with long GAA·TTC repeats in Friedreich’s
Ataxia
Abstract
Introduction
The neurodegenerative disease Friedreich’s ataxia (FRDA) is caused by hyperexpansion of GAA·TTC repeats in the fi rst intron of a nuclear gene that encodes the essential mitochondrial protein frataxin.1–4 Normal frataxin alleles have 6–34 repeats,
whereas FRDA patient alleles have 66–1,700 repeats. Intronic GAA·TTC repeats interfere with gene transcription.5–7 Longer repeats cause a more profound frataxin defi ciency and
are associated with earlier onset and increased severity of the disease.4 Biochemical studies
have documented that expanded GAA·TTC repeats adopt unusual non-B DNA structures, such as triplexes, containing two purine GAA strands along with one pyrimidine TTC strand,
fl anking a single-stranded pyrimidine region5,8 as well as intramolecular “sticky” DNA.6,9–12
Long (GAA·TTC)n repeat sequences form sticky DNA with two separate long (GAA·TTC)n repeating tracts associated within a single closed plasmid DNA. The interaction of the two tracts requires the repeats oriented in the direct repeat orientation, negative supercoiling and the presence of divalent metal ions to stabilize the DNA·DNA-associated region.8–10
We have demonstrated the capacity of sticky DNA to form both in vitro10,13 and in vivo.11–13
Triplexes and/or sticky DNA block elongation by RNA polymerase II.5 Another study
using artifi cial transgenes has shown that expanded GAA·TTC repeats induce repressive heterochromatin in vivo in a manner reminiscent of position-effect variegation.14 This
effect was augmented by coexpression of heterochromatin protein 1. Here, we address whether minor-groove DNA-binding small molecules can alleviate transcription repression of the frataxin gene.
Molecules that reverse triplex/sticky DNA and/or heterochromatin formation in the frataxin gene may increase successful elongation through expanded GAA·TTC repeats, thereby relieving the defi ciency in frataxin mRNA and protein in FRDA cells.11,14,15
Pyrrole–imidazole polyamides are cell-permeable small molecules that can be programmed to recognize a broad repertoire of DNA sequences.16 Two classes of polyamides are
specifi city,16,17 and linear β-alanine-linked polyamides are available for targeting purine
tracts of DNA, such as GAGAA·TTCTC repeats.18,19 β-Alanine-linked polyamides have
been shown to bind GAGAA repeats in Drosophila satellite DNA both in vitro and in cytological chromosome spreads.19 These molecules induce chromatin opening and reverse
heterochromatin-mediated position-effect gene silencing when administered to Drosophila embryos.19,20
Structural studies indicate that β-alanine-linked polyamides bind the minor groove of canonical B DNA.21 Given the high affi nity of β-alanine-linked polyamides for
purine tracts,18 these molecules might act as a thermodynamic “sink” and lock GAA·TTC
repeats into double-stranded B DNA. Such an event would disfavor duplex unpairing, which is necessary for formation of FRDA triplexes and sticky DNA. Although single polyamides bound within coding regions of genes do not appear to block transcription elongation,22–24 we cannot be certain that multiple polyamides have the potential to relieve
transcription repression at expanded GAA·TTC repeats. Alternatively, polyamides may relieve heterochromatin-mediated repression by opening the chromatin domain containing the frataxin gene.20
Results and Discussion
Targeting GAA·TTC Repeat DNA with High-Affi nity Ligands.
We synthesized two β-alanine-linked polyamides of different length, 1 (Im-Py-β-Im-Py-β-Im-β-Dp, where Py is pyrrole, Im is imidazole, β is β-alanine, and Dp is dimethylaminopropylamine) to target the 9-bp site 5’-AAGAAGAAG-3’ and 3
(Im-Py-β-Im-Py-β-Im-Py-β-Im-β-Dp) to target the 12-bp site 5’-AAGAAGAAGAAG-3’ (Figure 2.1A). Quantitative DNase I footprinting25 demonstrates that 1 binds to a radiolabeled
Figure 2.1. Polyamide structures, binding models and nuclear localization in cell culture.
a) Structures of polyamides 1, 2, 3,and 4 (R = methyl) and their BODIPY conjugates 1-B, 2-B, and 3-B
(R = N-propylbutanamide linked BODIPY FL C5). Polyamide structures are represented schematically as
binding models. Filled and open circles are Im and Py rings, respectively; diamonds are β-alanine; and, the semicircle with a plus sign is dimethylaminopropylamine. Linear polyamides bind in a carboxyl- to amino-terminal orientation with respect to the 5’ to 3’ sequence of their DNA target site.18 Mismatches formed with
polyamides 2 and 4 are indicated with shaded boxes. b)-c) Deconvolution microscopy of unfi xed lymphoid cells (GM15850, derived from an FRDA patient, shown in b), and GM15851 derived from a healthy sibling, shown in c)), incubated with BODIPY conjugates of each of the indicated polyamides, at 2 μM concentration
in cell culture medium for 16 h prior to visualization, as described.35 The bars represent 10 microns.
1-B 2-B 1-B 2-B
N N N H O N N H O N H O N N N H O N N N H O N H O N N H O N H O N H 2 +
5'-A A G A A G A A G A A G-3'
3'-T T C T T C T T C T T C-5'
4 N N N H O N N H O N H O N N N H O N N H O N H O N N N H O N H O N RH +
5'-A A G A A G A A G-3'
3'-T T C T T C T T C-5'
1 1-B
R = CH3
R = BODIPY FL C5
N N N H O N N H O N H O N N N H O N N N H O N H O N N H O N H O N R H +
5'-A A G A A G A A G-3'
3'-T T C T T C T T C-5'
2-B
2 R = CH3
R = BODIPY FL C5
N N N H O N N H O N H O N N N H O N N H O N H O N N N H O N H O N RH 2 +
5'-A A G A A G A A G A A G-3'
3'-T T C T T C T T C T T C-5'
3 3-B
R = CH3
R = BODIPY FL C5
BODIPY FL C5 =
N H O N N B F F A B C GM15850 GM15851
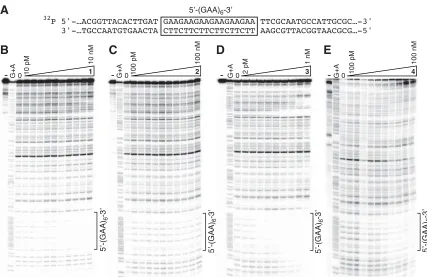
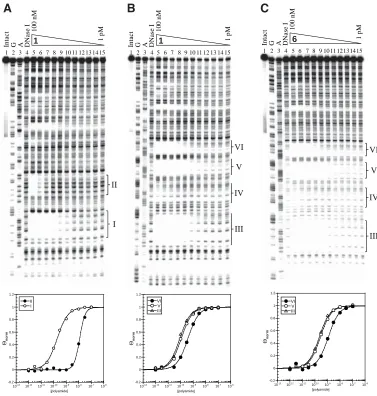
Figure 2.2. DNA binding properties of the polyamides. Quantitative DNase I footprint analysis for polyamide binding to a radiolabeled PCR product containing a (GAA·TTC)6 repeat sequence, labeled on the purine strand. DNA (at ≈20 pM for b), c) and e) and ≈2 pM for d)) and polyamide were allowed to equilibrate for 16 h, with the indicated ranges of polyamide concentrations, prior to DNase digestion and gel analysis.25 The phosphorimage of each gel is shown, with undigested DNA
in the lane marked “-”; a G+A sequencing reaction of the same DNA is shown along with DNase-treated DNA in the absence of polyamide (in the lane marked “0”). a) An excerpt of the DNA sequence cloned in pCR2.1 DNA, used to generate the PCR product for footprinting reactions is referenced for b) – e). b) Poly-amide 1 targeting 5’-AAGAAGAAG-3’; c) Polyamide 2, mismatch control for 1; d) Polyamide 3 targeting
5’-AAGAAGAAGAAG-3’; e) Polyamide 4, mismatch control for 3
1
10 nM
10 pM
0
G+A 2
100 nM
100 pM
0
G+A 3
1 nM
2 pM
0
G+A 4
100 nM
100 pM
0
G+A
5’-(GAA)
6
-3’
5’-(GAA)
6
-3’
5’-(GAA)
6
-3’
5’-(GAA)
6
-3’
32P 5'-…ACGGTTACACTTGAT GAAGAAGAAGAAGAAGAA TTCGCAATGCCATTGCGC…-3'
3'-…TGCCAATGTGAACTA CTTCTTCTTCTTCTTCTT AAGCGTTACGGTAACGCG…-5'
5’-(GAA)6-3’
A
B C D E
Polyamide sequence
(GAA·TTC)n
repeat no. in
target site, n
Binding affinity
(Kd, nM)*
1: Im-Py-β-Im-Py-β-Im-β-Dp 3 0.11 ± 0.02
2: Im-Py-β-Im-Im-β-Py-β-Dp 3 >100
3: Im-Py-β-Im-Py-β-Im-Py-β-Im-β-Dp 4 0.003 ± 0.001
4: Im-Py-β-Im-Py-β-Im-Im-β-Py-β-Dp 4 2.0 ± 0.4
Table 2.1. Polyamides designed to target GAA·TTC repeats in the frataxin gene
Mismatch amino acids are underlined. Im, imidazole; Py, pyrrole, β, β-alanine; Dp,
dimethylaminopro-pylamine
also able to bind extended regions of GAA·TTC repeats [(GAA·TTC)33] with no loss in affi nity, with several molecules of 1 bound per DNA molecule (Figure 2.3). As another test for sequence specifi city, footprinting experiments with 1 and 3 and a radiolabeled DNA fragment containing a mismatch DNA sequence (5’- . . . AGGAGGAGGTGGAGGAGGA . . . -3’) were performed. Neither polyamide 1 nor polyamide 3 bound this DNA sequence at polyamide concentrations up to 100 nM (Figure 2.4). Polyamide 1 binds other polypurine DNA tracts with single G-to-A transitions, maintaining similar or slightly reduced binding affi nities compared with the 5’-AAGAAGAAG-3’ site. A sequence harboring two transitions (A-to-G and G-to-A), giving rise to 5’-AAAAGGAAG-3’, increases the Kd of 1
by more than three orders of magnitude. Truncation of 1 to Im-Py-β-Im-β-Dp increases its
1
10 nM
100 pM
0
G+A
32P 5'-…
AAAA AATACA AAAAAA AAAAAA A A (GAA) 33 AATAAAGAAAAGTTAGCCGGGCG…-3' 3'-… TTTTTTATG TTTTTTTTTTTTTTT (CTT) 33 TTATTTCTTTTCAATCGGCCCGC…-5' 1 100 nM 5 pM 0 G+A 3 100 nM 5 pM 0 G+A 32P 5 ' -… TGC T CC CA AT C A CA GGA G G A A G GAG G AG GT GG A G GA GGA G G G C T G CT TGA G G A … -3 ' 3 ' -… ACG A GG GT TA G T GT CCT C C T T C C TC CTC C A C C T CCT C CT CC CG A C GA ACT C C T … -5 '
A B C
Figure 2.3. DNase I footprint analysis for polyamide 1 binding to a radiolabeled (GAA·TTC)33 PCR product derived from plasmid pMP142 DNA,5 labeled on the purine
strand; quantitative DNase I footprint analysis for polyamides 1 and 3 binding to a radio-labeled DNA containing a mismatch DNA sequence (5’-AGGAGGAGGTGGAGGAG-GA-3’, derived by PCR amplifi cation of the promoter region of the erbB2 gene). DNA (at ≈20 pM concentration) and polyamide were allowed to equilibrate for 16 h, with the indicated range of polyamide concentrations, before DNase digestion and gel analysis. The PhosphorImages are shown, with undigested DNA in the lane marked “–”; a G+A sequencing reaction of the same DNA is shown, along with DNase-treated DNA in the absence of polyamide (in the lane marked “0”). The sequence of the surrounding region is shown adjacent to each gel. a) Polyamide 1 targeting 5’-(GAA·TTC)33. b) Polyamide 1 targeting
5’-AGGAGGAGG-3’. c) Polyamide 3 targeting 5’-AGGAGGAGGTGG-3’. The sequence of the region
Kd on 5’-AAGAAGAAG-3’ by more than four orders of magnitude (see Chapter 2B for data and discussion).
Nuclear Localization of Fluorescent
Polyamides.
Fluorescent versions of the match polyamides 1 and 3 (1-B and 3-B, respectively) and mismatch polyamide
2 (2-B) were synthesized, where the dye BODIPY FL (C5) was attached at the carboxyl terminus of the polyamide (Figure 2.1A). Quantitative DNase I footprinting demonstrated that polyamides 1- and 3-B
exhibit 13- to 20-fold losses in binding
Figure 2.4. Quantitative DNase I footprint analysis for polyamide 1-B, the BODIPY conjugate of 1, binding to a radiolabeled (GAA·TTC)6 PCR product. Lanes are labeled as per Figures 2.2 and 2.3. Quantitation of this ex-periment by PhosphorImage analysis reveals a Kd of 1.3 nM. The amplicon sequence is depicted in Figure 2.2A.
5’-(GAA)
6
-3’
1-B
100 nM
100 pM
0
G+A
affi nity for (GAA·TTC)6 DNA, compared with the parent polyamides (for 1-B, Kd = 1.3 nM) (Figure 2.5; for 3-B, Kd = 0.04 nM). Epstein–Barr virus-transformed lymphoblast cell lines from an FRDA patient (line GM15850) and from an unaffected sibling (line GM15851) were obtained from the NIGMS Human Genetic Cell Repository (Coriell Institute, Camden, NJ). Both the match 1-B and mismatch 2-B conjugates localize in the nucleus of live, unfi xed normal and FRDA lymphoid cells after 16 h incubation in culture medium, as determined by deconvolution microscopy (Figure 2.1B). The BODIPY-conjugate of the longer polyamide 3, 3-B, also localizes in the nucleus of the FRDA cells.
GAA·TTC-Specifi c Polyamides Increase Frataxin mRNA and Protein.
frataxin mRNA levels in the lymphoid cell lines described above, with the levels of GAPDH mRNA as an internal control for each RNA sample. No differences in GAPDH mRNA levels were found between the two cell lines. As expected, the FRDA cell line had a markedly lower level of frataxin mRNA compared with the cell line from the normal individual (Figure 2.6A; 13 ± 6%, for 20 determinations, Table 2.2). We incubated the FRDA and control cells with various concentrations of each of the polyamides for various lengths of time and found that only polyamide 1 increased frataxin mRNA levels after 7 days incubation in culture medium. No changes in frataxin
GM15851 contro l 1 μ M F A 1 2 μ M F A 1 2 μ M F A 2
Rel
a
tiv
e
Frat
axi
n
mRNA (%)
Frataxin A B contro l 1 μ M F A 1 2 μ M F A 1 2 μ M F A 2 GM15850 Actin 100 80 60 40 20 0Figure 2.5. Polyamide 1 increases the levels of frataxin mRNA and protein in an FRDA lymphoid cell line. a) Measurement of frataxin mRNA levels, relative to that of GAPDH, in cell lines derived from an unaffected individual (GM15851), and an
FRDA patient (GM15850) by qRT-PCR.35 Polyamides 1 and 2 were
included in the cell culture medium at the indicated concentrations, and frataxin and GAPDH mRNA were determined after 7 days, with media and polyamide replenished on days 3 and 5. Error bars are de-rived from the percent error of the average and standard deviation of the change in cycle threshold between frataxin and GAPDH for trip-licate experiments, with triptrip-licate qRT-PCR determinations for each experiment. b) Effects of polyamides on frataxin protein in cultured lymphoid cells. FRDA or control cells were incubated as in panel a) prior to western blot analysis with antibody to human frataxin or actin. Equivalent amounts of total cell extract protein were loaded in each lane.
mRNA levels were observed on shorter incubation times. Over the concentrations of 1–8
μM, we fi nd that polyamides are not cytotoxic to the lymphoid cell lines (as determined by
2.5-fold by incubation with polyamide 1 (at 2 μM, Figure 2.6A). The average fold increase
observed with 2 μM 1 in the FRDA cell line is 2.2 ± 0.6 (in 20 experiments), resulting in
an average of ≈27% of the level of frataxin mRNA found in the normal cell line (Table 2.2). We note that polyamide concentrations greater than the Kd for in vitro binding are required for increasing frataxin transcription, presumably because of the large number of potential polyamide-binding sites in the human genome and availability of these sites in the cell nucleus. Despite the fact that 1 binds the 9-bp 5’-AAGAAGAAG-3’ repeat with high affi nity, the sequence landscape of all possible high-affi nity sites for this class of β-linked oligomers has not yet been fully characterized.26 Neither higher concentrations of 1 nor
longer incubation times increased frataxin transcription above the levels observed at 2 μM
on 7 day incubations. Polyamide 1 did not increase frataxin mRNA levels in the cell line derived from the normal individual. Similar incubations with the mismatch polyamide 2
were without signifi cant effect in either cell line. The levels of GAPDH mRNA were not changed by polyamide treatment in either cell line.
Table 2.2. Collected data showing the average ΔCt for normal cells (GM15851) and FRDA
cells (GM15850) before and after treatment with 1 at 2 μM
Exp., experiment; Ave, average; Rel. exp., relative expression; 850, GM15850 cell line; 851, GM15851 cell line
GM15851 GM15850 Ave Rel. exp. Rel. exp. Fold change
Exp. AveΔCt AveΔCt AveΔCt ΔΔCt 850:851
1 8.088 11.234 10.628 3.146 11.30 17.19 1.52
2 7.584 11.088 9.923 3.505 8.81 19.76 2.24
3 7.484 10.850 10.057 3.366 9.70 16.81 1.73
4 7.363 11.230 10.785 3.868 6.85 9.33 1.36
5 8.566 10.765 10.083 2.200 21.77 34.94 1.61
6 7.683 10.649 9.206 2.966 12.80 34.80 2.72
7 8.523 12.130 10.748 3.607 8.21 21.39 2.61
8 7.973 11.468 10.959 3.496 8.87 12.62 1.42
9 9.176 12.885 11.241 3.710 7.64 23.89 3.13
10 7.823 11.244 9.837 3.421 9.34 24.75 2.65
11 8.387 11.976 10.607 3.589 8.31 21.46 2.58
12 8.636 11.636 10.551 3.000 12.50 26.52 2.12
13 7.855 11.638 9.812 3.783 7.26 25.74 3.54
14 8.608 12.082 10.804 3.474 9.00 21.82 2.42
15 8.150 10.601 9.653 2.451 18.29 35.29 1.93
16 8.607 11.589 10.402 2.982 12.66 28.83 2.28
17 8.540 11.165 10.316 2.625 16.21 29.19 1.80
18 8.271 9.959 9.425 1.688 31.04 44.93 1.45
19 7.739 10.136 8.515 2.397 18.99 58.43 3.08
20 8.586 10.763 10.024 2.177 22.12 36.92 1.67
Averages 8.182 11.254 10.179 3.072 13.08 27.23 2.19
SD (±) 0.482 0.707 0.662 0.623 6.42 11.44 0.64
GM15850+1
We next examined the effect of removal of polyamide 1 from the culture medium on frataxin transcription. After induction of frataxin mRNA synthesis by 1 (7 days at 2
μM), transfer of the cells to fresh medium lacking polyamide caused frataxin mRNA levels
to decrease to their original levels after 96 h (data not shown). Thus, polyamides must be continuously present to maintain active transcription of FRDA frataxin alleles. The fi nding that incubation periods of 7 days or more are necessary to observe increases in frataxin mRNA suggests that multiple rounds of DNA replication are necessary for the compound to alter either the DNA or chromatin structure of expanded frataxin alleles, leading to active transcription, and removal of the polyamide causes the frataxin gene to readopt its inactive DNA or chromatin conformation. To test whether cellular proliferation is required for frataxin gene activation, we serum-starved FRDA and control cells, leading to cell cycle arrest (confi rmed by fl uorescence activated cell sorting, data not shown), and then incubated the arrested cells with polyamide 1 for 7 days before qRT-PCR analysis. We fi nd no increase in frataxin mRNA with polyamide 1 under these conditions, suggesting that cell division is a requirement for upregulation of transcription by the polyamide.
It was curious that the highest-affi nity compound, 3, did not increase frataxin mRNA levels, because the fl uorescent version of this molecule, 3-B, localized in the nucleus of FRDA lymphoid cells. Previous studies have established that nuclear localization is sensitive to polyamide composition and structure and, especially, the nature of the carboxyl terminus;27,28 therefore, the nonfl uorescent version of 3 may not enter the nucleus. To
test this hypothesis, we monitored the levels of frataxin mRNA after incubation with 3-B, and found an approximately two to threefold increase in relative levels of frataxin mRNA (compared with GAPDH) after 2- to 4-day incubations (data not shown). Thus, polyamide
3 may not have the optimum chemical properties for nuclear localization or DNA binding in the context of cellular chromatin. In contrast, polyamide 1-B did not increase frataxin mRNA levels in experiments where positive effects were found with polyamide 1.
GAA repeat RNA sequence, it is conceivable that this RNA will not be correctly processed into mature frataxin mRNA, and frataxin protein will not be produced. To test whether polyamide 1 leads to increased levels of frataxin protein in treated lymphoid cells, total-cell extracts from polyamide-treated (1–2 μM for 7 days), and untreated GM15851 control
and GM15850 FRDA cells were subjected to SDS/PAGE and the corresponding blots probed with anti-frataxin or anti-actin antibodies (Figure 2.6B). An approximately two to threefold increase in frataxin protein is observed with 1 in the FRDA cells, which correlates well with the observed increase in frataxin mRNA (Figure 2.6A).
Effects of Polyamides on Global Gene Expression.
DNA microarray analyses were performed with RNA isolated from GM15850 FRDA and GM15851 normal lymphoid cells that were either untreated or treated with polyamides 1 (at 1 and 2 μM) or 2 (at 2 μM) for 7 days on Affymetrix Human Genome
U133 Plus 2.0 GeneChips. Polyamide 1 was found to affect the mRNA levels for a limited number of genes in the FRDA cell line (at P ≤ 0.005, 51 genes affected by 1 μM 1, 16
genes affected by 2 μM 1) and only 2 genes in the normal cell line (Table 2.3). Although
more genes were called affected by 1 at 1 μM than at 2 μM, this difference is largely due
to genes whose mRNA levels change by <≈ 25% in either direction. At 2 μM 1, 15 genes
were increased in expression by >50%, and 1 gene was decreased by 45%. At 1 μM 1, only
3 genes had comparable changes in their mRNA levels. For GM15851 cells, 2 genes were up-regulated by 1, and no genes were down-regulated. For the frataxin gene, untreated GM15850 cells showed 17% of the frataxin mRNA found in untreated GM15851 cells, and incubation with 1 at 2 μM increases frataxin mRNA by 2.5-fold, bringing the frataxin
Class Parametric Fold Probe set A A G A A n o i t p i r c s e D D I e g n a h c e u l a v P n o s i r a p m o
c G AAGAAGA AAGAAGAA AAGAAGAAG
GM15851 control vs GM15851 1 M 1
1 4.65E-03 1.56 219298_at EnoylCoenzymeAhydratasedomaincontaining3 27 9 3 1
GM15851 control vs GM15851 2 M 1
1 4.83E-03 1.74 1569106_s_at HypotheticalproteinFLJ10707 54 16 7 0
GM15851 control vs GM15851 2 M 2
1 1.89E-03 1.70 219298_at EnoylCoenzymeAhydratasedomaincontaining3 27 9 3 1
GM15850 control vs GM15850 1 M 1
1 4.51E-03 2.24 213060_s_at Chitinase 3-like 2 14 3 1 1
2 3.41E-03 1.66 239862_at Tumor protein D52 150 43 17 3
3 3.37E-03 1.52 237626_at RB1-inducible coiled-coil 1 94 49 22 4
4 1.82E-03 1.50 243149_at Eukaryotic translation initiation factor 4 gamma, 3 281 120 62 19
5 2.64E-03 1.39 239188_at Chromosome 14 open reading frame 24 29 14 10 1
6 1.97E-03 1.38 227232_at Enah/Vasp-like 155 55 23 6
7 2.77E-03 1.33 242456_at MRE11 meiotic recombination 11 homolog A (S. cerevisiae) 81 27 11 3
8 3.23E-03 1.32 240174_at Hypothetical LOC388903 245 93 43 18
9 9.00E-07 1.28 232773_at Hypothetical protein MGC13057 17 7 3 1
10 3.38E-03 1.20 1564639_at Hypothetical LOC389908
11 4.37E-03 1.20 1569714_at Zinc finger, FYVE domain containing 20 19 9 4 1
12 4.09E-04 1.17 239648_at Hypothetical protein MGC48972 43 15 4 0
13 1.84E-04 1.12 231958_at Hypothetical protein BC015088 30 16 8 0
14 2.20E-03 1.11 233681_at Keratin associated protein 3-3 0 0 0 0
15 3.83E-03 1.10 1562516_at Hypothetical protein FLJ10300 64 21 12 3
16 4.97E-03 1.09 227532_at Hypothetical protein MGC14816 31 15 9 0
17 2.67E-03 1.08 1560021_at Ribosomal protein S20
18 5.76E-04 1.07 239773_at Hypothetical protein BC004923 43 18 7 1
19 4.45E-03 1.06 1553618_at Tripartite motif-containing 43 9 4 1 0
20 1.69E-03 1.04 1563540_at MRNA; cDNA DKFZp6