Ligia Maria Bohn
A cross-cultural study of E-commerce -
E
o
g
xpl rin factors that influence individuals to buy
Master’s thesis for the Communication Studies programme
New Media and Communication TechnologyGraduation Comittee:
Dr. T.M. van der Geest
Dr. P.W. de Vries
Abstract
This is a cross-cultural study that aims to investigate the factors that influence individuals to buy through the Internet or to avoid e-commerce and whether these factors play the same role in different cultures. The original sample consisted of 103 international students from 35 different nationalities studying in the east of The Netherlands. Based on the cultural dimensions of Hofstede, participants were classified as low or high UAI (Uncertainty Avoidance) and as low or high IDV (Individualism - Collectivism). The final sample consisted of 24 low and 28 high UAI participants and 26 low and 24 high IDV participants. The outcome is that ‘better prices’ is the main factor influencing e-commerce adoption for all cultures. However, there is disagreement regarding to the second most mentioned factor. For low UAI and high IDV is ‘availability’, whereas for low IDV and high UAI is ‘convenience’. Conversely, there is agreement related to factors influencing individuals to avoid e-commerce: worries about privacy/security on the Internet. Moreover, offering privacy guarantees on the Internet is very important for all individuals independent of their cultural values. It is remarkable that cultures adopt e-commerce influenced by different factors but avoid e-commerce influenced by the same kind of factors.
Table of Contents
1. Introduction 6
2. Factors Determining E-commerce Use 8
2.1 Factors Influencing Online Purchases Positively 8
2.2 Factors Influencing Online Purchases Negatively 9
2.3 Cross-cultural Studies 11
3. Culture 14
3.1 Concept of Culture 14
3.2 Dimensions of Cultural Values 15
3.2.1 Power Distance (PDI) 15
3.2.2 Uncertainty Avoidance (UAI) 16
3.2.3 Individualism - Collectivism (IDV) 17
3.2.4 Masculinity – Femininity (MAS) 18
3.2.5 Long versus Short-Term Orientation (LTO) 19
3.3 Using the Dimensions in Cross-cultural Studies 20
3.4 Hypotheses 21
4. Method 24
4.1 Participants 24
4.2 Questionnaire 24
4.3 Collection and Analysis of Data 26
5. Results 27
5.1 Participants 27
5.2 Cultural Values 27
5.2.1 Uncertainty Avoidance (UAI) 28
5.2.2 Individualism - Collectivism (IDV) 28
5.2.3 National Indexes x Individual Indexes 29
5.3 Hypotheses 31
5.3.1 Purpose of Internet Usage 31
5.3.2 Online Purchases 33
5.3.3 Internet Usage and Online Purchases 36
5.3.4 Factors Influencing Online Purchases Positively 36
5.3.5 Most Important Features 38
5.3.6 Factors Influencing Online Purchases Negatively 40
5.3.7 Security Concerns 42
5.3.8 Privacy Guarantees 43
5.3.9 Credit Card Usage 44
5.3.9.1 Credit Card Fraud 46
6.1 Conclusions 49 6.2 Analysis of the Theoretical Framework 51 6.3 Limitations of the Study 51
6.4 Recommendations for Further Research 52
References 54
Foreword
Here I am, writing the last sentences of this master thesis. I am happy feeling that the day in which I will graduate is getting closer and closer. It has been more than one year. The “opdrachten” and this master thesis have made my days very busy since I moved from Brazil to Holland in August 2004. I arrived on a Friday in Holland and the next Monday I started studying at the University of Twente. I had to forget my native language – Portuguese since from that moment on it was only English or Dutch. Those were difficult days… Assignments and exams, so much to read, to study, so many hours. I passed all and I am proud of it. A challenging time that I will remember with a smile. Also a time with funny moments like those when Simon (Danish student) and I spent almost one afternoon copying only two chapters of a book. Well, understanding a machine in which the menu is written in Dutch was not easy. Interesting how simple things can be difficult in a foreign country.
As a said, I am happy, I am finishing my master in Communication Studies. I want to thank all the people who helped me to get there.
Thea van der Geest, thank you for being my first supervisor. For your support, comments, patience and for being such a good teacher, so demanding, so organized and really willing to teach – impressive. “Hartelijk bedankt”.
Thanks Peter de Vries, my second supervisor, for your support and for your comments, so carefully made.
Thanks Dionysia Loman for your extraordinary support to us – international students.
Thanks Saxion Universities of Professional Education - Enschede for kindly having sent the invitations to their international students to take part in this study.
Thanks all my Brazilian friends and family who helped me and supported me in the way that was possible.
Thanks my parents Luiza and J. Bohn, for understanding my decision to move to Holland and for always giving me the best support.
Thanks my love, Wybe, for being next to me everyday, for your support in so many different ways.
1. Introduction
With the advent of Internet the distance barrier between countries has disappeared. Information can be sent anywhere almost instantaneous and online shopping can be done from everywhere. Electronic commerce has been primarily influenced by Western culture since that is where the majority of web sites were developed and users clustered. Consequently, many web pages have a design to appeal to North Americans (Simon, 2001). As a matter of fact, this is a problem for those companies that want to succeed worldwide; it is necessary to considerer the cross-cultural differences. Many companies have failed in differentiating their online operations (Merrilees, 2001).
For instance, the simple translation of a web site into a foreign language may be a disaster. Likewise, ignorance about colour associations may be a problem (Horton, 1993). For example, while the colour white represents purity in the United States, in Japan this colour is associated with death (Chau, Cole, Massey, Weiss & O’ Keefe, 2002).
Additionally, beyond the interface factors it is necessary to investigate to what extent other factors influence people to buy, or not, through the Internet. For instance, availability is the main factor positively influencing Internet users in Singapore to buy through the Internet (Teo, 2002). Conversely, this same factor ranked as the least important for Internet users from Malaysia. (Wiszniewski, 2002). It seems that the influencing factors to buy though the Internet differs within cultures.
On the other hand, for people who do not buy through the Internet, privacy, security and fear of using credit cards have been main factors negatively influencing individuals to buy through the Internet (Udo, 2001; Lebo, 2004; Swinyard & Smith, 2003). It seems that individuals avoid Internet purchases influenced by the same sort of factors. However, to what extent?
Therefore, this study aims to answer the following research questions:
What factors influence the individual decision to purchase online?
To what extent do
these factors play the same role in different cultures?
In order to develop this study in a cross-cultural perspective, the basic framework used is Hofstede’s cultural dimensions (Hofstede, 1984, 2001). He developed five dimensions in order to measure cultural values. These dimensions were derived from an analysis of data collected in more than 50 countries over 100.000 employees from the IBM company. Summarily, these dimensions are defined as following:
Power Distance Index (PDI): It focuses on the degree of equality or
inequality between people in the country‘s society. A High Power Distance ranking indicates that inequalities of power and wealth have been allowed to grow within the society.
Individualism - Collectivism (IDV): It focuses on the degree the society
High Individualism ranking indicates that individuality and individual rights are superior within society.
Masculinity – Femininity (MAS): It focuses on the degree that society
reinforces, or does not reinforce the traditional masculine work role model of male achievement, control and power. A High Masculinity ranking indicates the country experiences a high degree of gender differentiation.
Uncertainty Avoidance Index (UAI): It focuses on the level of tolerance for
uncertainty and ambiguity within society. A High Uncertainty Avoidance ranking indicates the country has a low tolerance for uncertainty and ambiguity. This creates a rule-oriented society with laws, rules, regulations and control in order to reduce the amount of uncertainty.
Long versus Short-Term Orientation (LTO): It focuses on the degree that
society embraces long-term devotion to traditional, forward thinking values. High Long-Term Orientation ranking indicates the country has values as respect for tradition and long-term commitments.
Based on the characteristic from each dimension, each country involved in Hofstede’s study received a value called index (see Appendix A). For instance, The Netherlands has an Uncertainty Avoidance (UAI) index 53 whereas Brazil has 76, which means that Brazil is less tolerant to uncertainty than The Netherlands. On the other hand, The Netherlands has a much higher index than Brazil according to Individualism - Collectivism (IDV), 80 comparing to 38. It indicates that in The Netherlands individual initiatives are socially encouraged and that Dutch citizens have more individualistic attitudes than Brazilian people (Hofstede, 2001).
Considering that e-commerce is a new way of shopping in which the product cannot be touched, the sales person cannot be personally reached, payments are not in cash and there is no social interaction, it can be said that e-commerce involves high degrees of uncertainty and that it is an individual task. Based on these characteristics of e-commerce, two dimensions from Hofstede are selected to form the basic framework of this study: Uncertainty Avoidance and Individualism - Collectivism.
The results of this study are based on the answers of international students from the University of Twente and the Saxion Universities of Professional Education, both situated in the city of Enschede in the east of The Netherlands.
The findings of this study can be a great contribution to those companies that are operating online worldwide and have already solved the problems with the web interfaces and now need to improve other particular factors, which may change from nationality to nationality, in order to improve the online business and survive in this competitive market.
2. Factors Determining E-commerce Use
The term e-commerce, as used in this study, is defined as the process of buying, selling or exchanging products, services and information through the Internet (Turban, King, Lee & Viehland, 2004, p. 4). There are four kinds of e-commerce: business-to-business, business-to-consumer, consumer to consumer such as E-buy or government-to-constituent. The focus of this study is on business to consumer e-commerce; which means that consumers are buying goods and services through the Internet. In literature, substitutes are being used instead of e-commerce such as: online shopping, online purchasing, web-shopping, Internet shopping.
The commerce through Internet is a relatively new market and it is not well known why some people adopt it and others avoid it. This literature review aims to answer the following question:
What are the factors that influence people to buy through the Internet?
A set of factors has been classified in previous studies as responsible for influencing people buying through the Internet. In the study reported here, these factors are divided into those that influence individuals positively and those that influence individuals negatively to choose the Internet for their purchases. Nevertheless, before this distinction is made, it is important to underline that one factor has been classified as mandatory for online purchases: Internet experience. Prior experience with the Internet had the strongest influence on the intention to purchase apparel through the Internet (Yoh, Damhorst, Sapp, & Laczniack, 2003). Additionally, the percentage of Internet users who buy online, increases with the time of experience that they have with the Internet (Lebo, 2004). The importance of Internet experience as a predictor of online purchases is addressed in this study, mainly due to the selection of the participants. They were all familiar with computers and the Internet.
Besides the sections that present the factors that influence individuals positively or negatively to choose Internet for their purchases, a final section is dedicated to present cross-cultural studies regarding e-commerce.
2.1 Factors Influencing Online Purchases Positively
Individuals have chosen the Internet for their purchases, influenced by a set of factors like: time savings, better prices, convenience (shopping from home, lack of sales pressure, no need for parking/driving, no checkout lines) and availability (an item is not available in your local area therefore you go online). Previous studies on these factors have shown that the importance of each may vary. For instance, Teo (2002) found in his study among 1133 Internet users that the main reason why participants were buying through the Internet was because the participants were able to buy items that were not available in the conventional shops in Singapore.
On the other hand, it seems that individuals did agree regarding to another factor: better prices. Dutton, di Gennaro and Hargrave (2005) found in a study they conducted among 1309 Internet users in Great Britain that the majority of participants believed that they could find lower prices on the Internet. Similarly, better prices ranked third position as a factor influencing individuals to buy through the Internet in a study conducted by Ahuja, Gupta and Aman (2003) in the USA among 190 students and 75 non–students.
Besides better prices, previous studies have shown that there is an agreement regarding to another factor positively influencing individuals to buy through the Internet: ‘time savings’. Buying through the Internet was considered a positive way to save time (Dutton et al., 2005). Likewise, ‘time savings’ was the second factor influencing positively individuals buying through the Internet (Ahuja et al., 2003).
Convenience is another factor that has positively influenced individuals to buy through the Internet. Convenience is the main reason why people shop online (Ahuja et al., 2003). Eliot (2002) suggested that convenience was the most important factor influencing customers from Dymock (Australian book-selling site), GreenGrocer’s (Australian online shop that sells groceries) and from Wineplanet (online shopper that sells wine) to buy products through the website of these companies. Likewise, convenience was the second factor influencing consumers to buy from E-store (Australian online shop that sells computer products). It seems that there is an agreement according to the importance of convenience as a factor influencing positively individuals to buy through the Internet. Nevertheless, the results presented by Elliot were derived from surveys conducted in the website of each company, which means that only people visiting the website could take part in the survey. Consequently, there was no evidence of the validity and generalization of these results but they serve as indicators of Internet shopping behaviour that demand further investigation.
To summarize, literature has shown the importance of time savings, better prices, convenience and availability, however, to different extent. What is important for this study is that these factors do influence individuals to choose the Internet for their purchases. Based on this, two main aspects will be investigated. First, to what extent are these factors mentioned in this section influencing individuals with computer literacy and Internet access to buy through the Internet. Second, the relationship between these factors and the cultural values of participants.
2.2 Factors Influencing Online Purchases Negatively
When studying the relation between cultural values and factors that influence individuals to buy through the Internet, it is important to know what kind of factors are negatively influencing individuals to buy through the Internet. Previous studies have shown that these factors are: concerns about privacy/security, credit card concerns, lack of touching the product, lack of interaction and lack of customer service. This is not a complete list of factors that influence individuals to avoid the Internet for their online purchases, but it is a list of the factors that are relevant for this study.
A more historical view can be taken from the studies conducted by Lebo (2001, 2003, 2004). Lebo found that the majority of the 2009 American households that took part in his study in 2004 were concerned about privacy of personal information when buying online. When compared to his annual previous studies, the results showed that in the last three years the percentage of people who expressed some concern about privacy declined from 94.6% in 2001, to 88.8% in 2002 and to 88.2% in 2003. Although the percentage of people who have some concern about privacy on the Internet has decreased (88.2%) it is still a very high percentage.
The concerns about privacy/security on the Internet also include concerns about credit card usage, which has been another relevant factor influencing individuals to avoid the Internet for their purchases. In a study by Udo (2001), concerns about the abuse of credit card and personal information was related to Internet shopping. Further, Swinyard and Smith (2003) found in a study conducted in the United States among 1738 households having an Internet connection at home, that the majority of them did not want to use the credit card number on the Internet. Additionally, almost half of the participants were worried about having the number being stolen on the Internet.
Another relevant aspect related to the use of credit cards, which perhaps is not perceived, is whether people have a credit card or not. People are not able to use a credit card due to the simple fact that they do not have one. Teo (2002) conducted an online survey in Singapore among 1133 Internet users in order to identify factors that influence a consumer’s decision to buy online. He found that the second reason for participants not to buy through the Internet was that participants did not have a credit card, mentioned by 416 participants. If people do not have a credit card, all alternatives to diminish concerns about credit card use on the Internet are irrelevant.
In contradiction to Teo (2002), a study conducted by Efendioglu and Yip (2004) in China among 252 Chinese citizens, considered by the authors as “early adopters” of e-commerce, revealed that the majority of participants possessed one credit card and about two-thirds possessed two or more credit cards.
Besides the factors related to privacy/security, there is another set of factors that are influencing individuals to avoid Internet purchases: lack of touching, lack of interaction and lack of customer service. These factors are intrinsically related to the characteristics of e-commerce, which is a new way of shopping. For instance, buying through the Internet means buying a product that cannot be touched. As a consequence, lack of touching the product may be a predictor for individuals to avoid online purchases. Nevertheless, previous studies demonstrated differences in the influence of this factor. For example, it was the main factor influencing Internet users from Singapore not to buy online (Teo, 2002). On the other hand, it had a low score as a factor influencing American individuals not to buy through the Internet (Ahuja et al., 2003). Additionally, people found it more convenient to buy through Internet certain kind of products that do not require touching like home electronics hardware instead of buying clothes (Bhatnagar, Misra & Rao, 2000).
the third factor influencing people not to buying online. On the other hand, Dutton et al. (2005) investigated the influence of the same factor and did not reach a conclusion for there was a disagreement among the participants. It is not clear to what extent this is a relevant factor for predicting the avoidance of online shopping. Another related factor that may influence individuals negatively to buy through the Internet is the lack of customer service. Services that are usually available in traditional shops do not exist in the same proportion in the virtual world. For instance, the possibility to communicate with someone face-to-face when a problem occurs during the transaction or later after receiving the product is not possible in the virtual world. Besides, whether the customer has questions about the product, it is not easy to obtain this kind of information in virtual shops, at least not personally and immediately like in traditional shops. Ahuja et al. (2003) found that lack of customer service was the second factor influencing people in the USA not to buy through the Internet. Similarly, questions about the return of a product could be a barrier to greater use the Internet for shopping (Dutton et al., 2005). On the other hand, Dutton et al. concluded that participants considered it easy to order products from a web site and that Internet shopping is not more difficult than traditional shopping. It seems that lack of customer service is not necessarily a factor negatively influencing individuals to buy through the Internet.
As can be seen, concerns about privacy/security and credit card usage, lack of touching, lack of interaction and lack of customer service are factors that have negatively influenced individuals to buy through the Internet. However, it is not yet evident to what extent these factors influence individuals. Based on this, two main aspects will investigated in the study reported here. First, the relative importance of these factors for individuals with computer literacy and Internet access. Second, the relationship between these factors and the cultural values of participants.
Besides the factors that influence individuals negatively to buy through the Internet, previous studies have investigated solutions in order to diminish the influence of these factors. Van Dijk (2002) affirms that offering privacy guarantees on the Internet will become one of the most important quality standards of services in networks. In a study by Udo (2001), the majority of participants revealed that if privacy and security would be assured on the Internet, they would certainly buy through the Internet. Similarly, Lebo (2004) found that guarantee of privacy and security in the Internet was the best method to reduce concern about using credit card online followed by better technology and new laws/regulations.
The results of these studies presented in this section showed that guarantee of privacy and security on the Internet were important issues that should be considered in order to diminish the worries of online purchases. These issues will be investigated in the study reported here in order to identify the relevance of them in a cross-cultural perspective and the relation between these issues and the cultural values of participants.
2.3 Cross-cultural Studies
that is relevant for this study. Tradition is more important for Chinese than for Australians. Hence, it may indicate a lower rate of adoption of e-commerce by Chinese people compared to Australians. This would be a consequence of the nature of e-commerce, which is an innovator process. It completely changes the way people buy goods or services. Regarding to the marketing variables analysed by Lowe between Australians and Chinese two conclusions are relevant for the study reported here. Chinese people, when purchasing products for own use, were more likely to shop around for the cheapest than the Australians; which means that price was very important for Chinese people. Australians showed a higher preference to deal with salespersons that they have dealt with before rather than with someone unknown. It may be a problem in e-commerce since there is no salesperson. It is an individual task.
Comparable results, regarding to difference in values between cultures, have been found in a study by Lightner, Yenisey, Osok and Salvendy (2002). They investigated the aspects of a web site that will possible influence consumers to purchase online. Besides, they identified whether cultural differences exist in the preferences of consumers for web site design. In this study, 303 Turkish and 64 American students answered a questionnaire. The results indicated that Turkish and Americans had similar concerns; however, for Turkish students some issues were much more important than for Americans. Regarding to e-commerce, the main differences between these two groups were: Turkish students were more concerned with Internet security, more interested in the speed of retrieving information and price comparison and perceived accuracy, than for Americans. On the other hand, the same study showed that individuals that did not shop online (or shopped very little) indicated that security was the main factor that made them avoid e-commerce, independently of their cultural values. Although the study of Lightner et al. brings an insight of the differences of values between cultures, there are a number of small, but important, weaknesses. For instance, there should have been a similar number of Turkish and American participants. Additionally, the method used by the researchers is contestable. Instead of applying the same questionnaire for the two communities, the authors conducted what they called “similar surveys” and compared the results.
Differences in values may also influence the purpose of Internet use. In a study conducted among 119 students from the USA and 150 from Hong Kong, Chau et al. (2002) found that there were significant differences between these groups. Participants from the USA reported more use of the Internet for the search of information and e-commerce whereas subjects in Hong Kong used the Internet for social communication and hobby activities. The authors pointed out that the differences in the results could be due to differences in diffusion or development of e-commerce in different places. Nevertheless, this difference of behaviour could be explained through the different cultural values that these two distinct societies have.
In order to develop a cross-cultural study, three main questions still have to be answered: What are values? What is culture? How culture can be measured? The answers of these questions will be addressed in the next chapter that presents the base framework of this study: Hofstede cultural dimensions.
3. Culture
3.1 Concept of Culture
Developing a cross-cultural study demands a clear comprehension of the concept of culture and all special issues related to this specific kind of research.
Cultural has been described in different ways by many authors. Hofstede (1984) defined culture as:
“The collective programming of the mind which distinguishes the member of
one human group from another. Culture, in this sense, includes system of values. And values are among the building blocks of culture” (p. 21).
Trompenaars and Hampden-Turner (1998) divided culture into two layers. The external one shows the explicit culture like art, music and language among others and the core layer expresses the norms and values of and individual group.
Hofstede has also divided culture into different levels of depth: symbols, heroes, rituals and values. It is represented in an onion diagram (fig. 3.1) in which “symbols” is the most superficial level and “values” is the most important (Hofstede, 2001, p. 11).
Symbols
Practices
Values
Rituals
Heroes
Fig 3.1 The “Onion Diagram”: Manifestations of Culture at Different Levels of Depth
Value is a central component of culture defined by Hofstede as “a broad
3.2 Dimensions of Cultural Values
In order to measure the values of a culture and compare them, Hofstede developed five different dimensions that classify countries according to: Power Distance, Uncertainty Avoidance, Individualism-Collectivism, Masculinity-Femininity and Long versus Short-Term Orientation. These dimensions derived from a survey conducted among employees at IBM worldwide. The data were collected between 1967 and 1973. Approximately 117.000 employees from 66 countries answered a questionnaire. The instrument was translated into 20 languages. Hofstede created these five dimensions based on a factor analyses. The classification of the countries in the five different dimensions was done using a formula that calculates an index for each dimension. The five dimensions are characterized below.
3.2.1 Power Distance (PDI)
Power distance is based on one main issue: human inequality. It is expressed in different levels in each society and it can occur in different areas like prestige, wealth, and power. In organizations this inequality occurs between boss and employee in a hierarchical relationship.
Power distance is defined by Hofstede (1984, p. 72) as:
“The power distance between a boss B and a subordinate S in a hierarchy is
the difference between the extent to which B can determine the behaviour of S and the extent to which S can determine the behaviour of B.”
In order to investigate the difference between countries in power distance Hofstede introduced three questions in his questionnaire. The answers were used to calculate an index for each country. The main question was “How frequently in your experience does the following problem occur: employees being afraid to express disagreement with their managers?”. The other two were respectively: “subordinate’s perceptions that their boss tends to take decisions in an autocratic (1) or persuasive/paternalistic (2) way” and “subordinates/s preferences for anything but a consultative (3) style of decision-making in their boss: that is for and autocratic (1), a persuasive/paternalistic (2) or a democratic (4)style.
The results show a large difference in indexes between countries. The five highest and lowest indexes belong to the following countries, as can be seen at the table 3.1.
Table 3.1
Country Power Distance Index*
High PDI Low PDI
Malaysia (104) Austria (11)
Guatemala (95) Israel (13)
Panama (95) Denmark (18)
Philippines (94) New Zealand (22)
Mexico (81) Ireland (28)
*Hofstede, 2001, p. 87.
However, it is important to have in mind while reading this characteristics, that they do not apply to all countries, that individuals within countries vary from
societal norms1 and countries maybe anywhere in between these two extreme
points: high and low index. These observations are also valid for the examples of the other four dimensions of Hofstede.
High Power Distance Index:
• Parents put high value on children’s obedience;
• Managers are seen as making decisions autocratically and paternalistically;
• Students put high value on conformity; • Employees fear to disagree with their boss;
• Higher and low-educated employees show similar values about authority.
Low Power Distance Index:
• Parents put less value on children’s obedience;
• Managers are seen as making decisions after consulting with subordinates;
• Employees less afraid of disagreeing with their boss; • Employees show more cooperativeness;
• Higher-educated employees hold much less authoritarian values than
lower-educated ones.
3.2.2 Uncertainty Avoidance (UAI)
This dimension is based on the extent in which members of a culture feel threatened by uncertain or unknown situations. Societies deal with uncertainty in different ways and institutions like family, school and the state, transfer and reinforce these ways of coping.
In order to measure the level of Uncertainty Avoidance in the country, Hofstede included three questions in his questionnaire. They were related to the following aspects: stress, need for fixed company rules and need for employment stability. The score of the countries in the questions related to these themes were used to form the Uncertainty Avoidance Index (Hofstede, 1984, p. 56).
There was a wide range of variety of UAI among countries, between 8 and 112. The top five of each one is demonstrated in the table below.
Table 3.2
Country Uncertainty Avoidance Index*
High UAI Low UAI
Greece (112) Singapore (8)
Portugal (104) Jamaica (13)
Guatemala (101) Denmark (23)
Uruguay (100) Sweden (29)
Belgium (94) Hong Kong (29)
*Hofstede, 2001, p. 151.
1
Differences between the values of countries with low and high Uncertainty Avoidance are presented below (Hofstede, 1984, p. 132-133).
Countries with Low UAI:
• Less emotional resistance to change; • More risk-taking;
• Loyalty to employer is not seen as a virtue; • Rules maybe broken for pragmatic reasons;
• Higher tolerance for ambiguity in perceiving others.
Countries with High UAI:
• More worry about the future;
• Tendency to stay with the same employer;
• Preference for clear requirements and instructions; • Fewer people prepared to live abroad;
• Pessimism about people’s amount of initiative, ambition, and
leadership skills.
3.2.3 Individualism - Collectivism (IDV)
Individualism is the third dimension of national culture. It is related to the relationship between individuals and the collectivity in a society. It reflects the way people live together linked to societal norms expressed by the values of the population. The differences between countries can be easy identified. The citizens in the United States of America see their culture as very individualistic and they consider this factor as a major contribution to the greatness of their country (Hofstede, 1984, pg 150). On the other hand in a country like China, individualism is seen as expression of selfish behaviour and aversion to discipline.
In order to measure this dimension, Hofstede included 14 questions in his survey about the following subjects: challenge, desirable area, earning, cooperation, training, benefits, recognition, physical conditions, freedom, employment security, advancement, manager, use of skills and personal time.
The top five countries with the highest and lowest IDV are demonstrated at table 3.3.
Table 3.3
Country Individualism Index*
High IDV Low IDV
U.S.A (91) Guatemala (6)
Australia (90) Ecuador (8)
Great Britain (89) Panama (11)
Canada (80) Venezuela (12)
The Netherlands (80) Colombia (13)
*Hofstede, 2001, p. 215.
Low IDV Countries
• Emotional dependence on the company;
• More involvement with company;
• Group decisions are considered better than individual decisions; • Social relations predetermined in terms of groups;
• More years of school needed to do a given job.
High IDV Countries
• Emotional independence from the company;
• Managers endorse “modern” point of view on stimulating employee
initiative and group activity;
• Individual decisions are considered better than group decisions; • Fewer years of school needed to do a given job;
• Managers rate having autonomy more important.
3.2.4 Masculinity – Femininity (MAS)
The main issue in this dimension is whether the biological differences between sexes should or should not have an influence on the roles of men and women in social activities.
Hofstede (1984, p.190) refers to “masculinity’ and “femininity” as the dominant sex role pattern in the vast majority of modern and traditional societies in which the men are more assertive and the women are more nurturing.
The MAS Index reflects the extent into which respondents in a country tend to have working goals that are more popular among men (high MAS) or more related to women (low MAS).
The calculation of the MAS Index was done, based on the score of answers of 14 “work goals” questions, like for example: ‘How important is it to you to have an opportunity for high earnings?’ or ‘How important is it to you to fully use your skills and abilities on the job?’ These questions served also as the base for the calculation of the Individualism Index.
The table below presents the top five countries with the highest and lowest MAS Index.
Table 3.4
Country Masculinity Index*
High MAS Low MAS
Japan (95) Sweden (5)
Austria (79) Norway (8)
Venezuela (73) The Netherlands (14)
Italy (70) Denmark (26)
Switzerland (70) Costa Rica (21)
*Hofstede, 2001, p. 286.
Low MAS Countries
• Managers relatively less interested in leadership, independence and self-realization;
• Weaker achievement motivation; • Students more benevolent;
• Smaller or no value differences between men and women in the same jobs;
• Students less interested in recognition.
High MAS countries:
• Managers have leadership, independence, and self-realization ideal; • Stronger achievement motivation;
• Students less benevolent;
• Greater value differences between men and women in the same jobs; • Students aspire for recognition.
3.2.5 Long versus Short-Term Orientation (LTO)
The fifth dimension of national culture is based on issues like persistence, thrift to personal stability and respect for tradition. This dimension is a result of a survey conducted in 1985 in 23 countries. The instrument was developed by Michael Harris Bond, in Hong Kong, based on values suggested by Chinese scholars (Hofstede, 2001, p. 351).
This dimension was not found in the IBM research. According to Hofstede, it happened probably due to the fact that the questionnaire for IBM was composed by Western minds that included Western values. On the other hand, the Chinese Value Survey (CVS) was designed using values suggested by Eastern minds (Hofstede, 2001, p. 354). For Long-Term Orientation the values are: persistence, ordering relationship by status and observing this order, thrift and having a sense of shame. Differently, for Short-Term Orientation the values are: personal steadiness and stability, protecting your “face”, respect for tradition and reciprocation of greetings, favours and gifts.
The top five countries with a high and low LTO are respectively:
Table 3.5
Country Long-Term Orientation Index Values
High LTO Low LTO
China (118) Pakistan (0)
Hong Kong (96) Nigeria (16)
Taiwan (87) Philippines (19)
Japan (80) Canada (23)
South Korea (75) Zimbabwe (25)
* Hofstede, 2001, p. 356.
Low LTO
• Quick results expected;
• Shame is not a common feeling • Leisure time important;
• Respect for traditions;
• Reciprocation of greetings, favours and gifts.
High LTO
• Persistence, perseverance;
• Adaptation of traditions to new circumstances; • Leisure time is not important;
• Students consider persistence an important personality trait; • Most important events in life will occur in future.
All countries that took part in Hofstede survey received different index for each dimension (See Appendix A).
3.3 Using the Dimensions in Cross-cultural Studies
The dimensions of Hofstede have been used in previous cross-cultural studies related to the web and the Internet. These studies are presented in this section and serve as a support for the decision of taking the Hofstede’s framework as the basis for the study reported here. Interesting is that the studies mentioned in this section show how different cultures do behave differently according to the same subject.
that they can get lower prices in traditional shops. These issues will be addressed in the study reported here (see section 2.2). As a conclusion of the study, Thai participants bought through the Internet much less than Americans do. As a matter of fact, Thailand has a high Uncertainty Avoidance index and it is a collectivist society. It seems that these two dimensions predict the frequency in which individuals buy trough the Internet. The relationship between these two dimensions and frequency of online purchases will be investigated in the study reported here.
Comparable results have been found in a study by Kacen and Lee (2002). They investigated the influence of culture on consumer impulsive buying behaviour. The sample included 706 students and non-students from Australia, United States, Hong Kong and Malaysia. The results indicated that impulsive buying behaviour differs according to the culture. For instance, people from collectivistic countries reported less tendency to make purchases by impulse than people from individualist countries. It happens because individuals from collectivistic countries suppress their impulse to buy by acting in a way that is consistent with the cultural norms.
The importance of taking the value of a culture into account were also confirmed in the study conducted by Zhang and Gelb (1996). For their experiment, they created different advertisements about the same product, a photo camera, for different cultures based on the values of each one. For Americans, who are more individualistic, the advertisement had a formal appeal and for the Chinese, who are more into family, more collectivistic, it had an appeal that took this value in account. Both slogans were respectively: “Come and indulge in the joy of self-expression” and “Share the moments of happiness with your family and friends”. The American and Chinese participants took part in the study and as a result the Chinese identify themselves with the version that was made for them and the Americans liked more the one that contain the self-expression appeal. As a conclusion, this study reinforces the statement that the values of a culture should be taking into account when there is the proposal of dealing with different cultures.
As a result, these previous studies have shown the difference of values between cultures and confirmed the importance of taking the cultural background into account when considering dealing with individuals from different cultures. The next section presents which dimensions were used in this study and the set of hypotheses that were tested.
3.4 Hypotheses
Uncertainty Avoidance (UAI) and Individualism-Collectivism (IDV) dimensions have been chosen for this study because of their intrinsic characteristics and its connection with e-commerce.
countries with high UAI present preference for clear requirements and instructions (Hofstede, 1984, p.132), which is not easily available in the virtual environment. In the traditional shop the sales person can help in case clear information is required. However, in the virtual environment the user has to be satisfied with the information presented in the web page that is not always complete or clear. As a result, it is expected that individuals with a high UAI index tend to avoid buying through the Internet.
Therefore, the following hypothesis is presented:
H1: Individuals with high UAI buy less through the Internet than individuals with
low UAI.
Individualism- Collectivism (IDV) is the second cultural dimension used in this study. Two main connotations, found as a result of this dimension, may help in the study of e-commerce. Countries with a low IDV have a more traditional time use pattern, and individual initiative is socially not encouraged. Thus, due to the nature of e-commerce, which is an individual activity and is not a traditional way of shopping, it may reflect on the adoption rate of Internet shopping in countries with a low IDV. On the other hand, countries with high IDV have a more modern time use pattern and individualistic initiative is socially encouraged (Hofstede, 1984, p. 166-167).
Therefore, the following hypothesis is presented:
H2: Individuals with high IDV buy more through the Internet than individuals
with low IDV.
The two previous hypotheses stated for each dimension whether the individuals with low or high indexes (UAI, IDV) buy more through the Internet.
Therefore, the following hypothesis is presented:
H3: Individuals with high IDV and low UAI buy more through the Internet than
individuals with low IDV and high UAI.
Considering the previous studies presented in the chapter 2, that indicated a relation between Internet experience and the rate of Internet shopping adoption, the following hypothesis is presented:
H4: Individuals who spend more hours on the Internet, buy more through the
Internet.
Another relevant characteristic of the countries with high UAI is that achievement is defined in terms of security. It may have an impact on Internet shopping adoption because of two factors. First, based on the literature review, worries about security is one of the main factors influencing people not to buy through the Internet. Second, Internet shopping still needs better regulations and systems to protect its buyers (McKnight, Choudhury & Kacmar, 2002).
Therefore, the following hypotheses are presented:
H5: Lack of security is a factor that influences more individuals with High
H6: Information about how secure a specific site is, is more important for
individuals with high UAI than for individuals with low UAI.
H7: Offering privacy guarantees in the Internet is more important for individuals with high UAI than individuals with low UAI.
Individuals from countries that have a high UAI index are less risk-taking, have a fear of failure, have a preference for clear instructions, have a tendency to stay with the same employee, among others (Hofstede, 1984, p. 132). Based on this, it could be expected that individuals from this countries would be more willing to buy through the Internet if they would know the online shop, for example.
Therefore, the following hypothesis is presented:
H8: Individuals with high UAI are more willing to use the credit card on their Internet purchases when special conditions are offered than individuals with low UAI.
4. Method
This chapter explains the design of the study in three main parts. The first one specifies the participants. The second part presents the instrument used in this study. Finally, the information about the collection and analysis of data are presented.
4.1 Participants
Considering the studies mentioned in the chapter on literature review, which concluded that prior experience with the Internet has the strongest influence on intention to buy through the Internet, this study was conducted with individuals that are familiar with computers and have experience with Internet.
The sampling of this research was based on “convenience sampling”, which means that the participants were selected due to the easy accessibility and/or availability (Schonlau, Fricker Jr. & Elliott, 2002). The University of Twente has many foreign students, which made it much easier to ask them to participate in the study since it was not possible to invite citizens worldwide living in their home country, mainly due to the lack of budget.
All international students registered at the University of Twente between 09-01-2002 and 08-31-2005 (n=1024) were invited via e-mail to participate in the study. Unfortunately, due to the change of e-mails addresses by the students, many invitations were returned to the sender. Nevertheless, about 500 international students did receive the message. Additionally, 150 international students from the Saxion Universities of Professional Education in Enschede were invited to take part in this study, via their e-mail account. In total, 126 international students filled in the questionnaire of the study reported here.
Selecting participants for a cross-cultural study must take the sub-cultural aspects into account (Hofstede, 1984). International students may not represent the citizens of their country because of the fact that they are studying abroad might differentiate them from their fellow country men/women. However, this is not a constraint because all these international students belong to the same sub-culture. They are probably open-minded, receptive and like to face challenges. Furthermore, they were not living in their home country and they moved (temporally) to an unknown country, The Netherlands.
Nevertheless, due to the fact that these students are not currently living in their home country and perhaps they have already received influence of the Dutch culture, I assessed in my research the respondent’s scores on Hofstede’s dimensions IDV and UAI instead of using the country scores.
4.2 Questionnaire
to Internet usage, online shopping, privacy, security and credit card usage (see Appendix B).
The questionnaire was created in an online version using “Survey Monkey” as a tool and participants answered the questions mainly through the selection of radio buttons.
Cultural dimensions were measured using questions copied from the original version used by Hofstede in his studies (see Appendix C). However one significant change was introduced. The original instrument that was developed for a business environment did not fit with the university environment. For this reason, all the questions relevant for this study were adapted from the business to the university environment. For instance, the original question from Hofstede: “Have a good
working relationship with your manager“ was modified into “Have a good relationship with your teacher”. Each dimension from Hofstede was measured
through a set of specific questions of his questionnaire. Uncertainty Avoidance was measured through 3 questions and Individualism-Collectivism dimension was measured through the addition of 14 specific questions.
In order to measure the Internet usage, the questions used in this study were derived from an online survey conducted by Georgia Institute of Technology’s Graphics, Visualization, and Usability Centre and endorsed by the World Wide Web Consortium (W3C). The survey had many sections and for the purpose of this study the following sections were selected:
Purchasing on the Internet questionnaire (Mathwick, 1998);
Web and Internet usage questionnaire (Schlosser & Pirolli, 1998);
Online privacy and security questionnaire (Schneck, 1998);
Finding product information and purchasing questionnaire (Riggins, Rhee & Gupta, 1998).
Furthermore, three questions included in the questionnaire were derived from an instrument used by Ahuja & et al. (2003). Two of them were related to the factors that influence people to buy or not through the Internet and one question was about the kind of products that people buy.
Questions were mainly “closed” which classified the research as quantitative (Padua, 2004). Nevertheless, in some questions there was the possibility to fill out other answers than those suggested. This option was introduced in some questions in order to get personal and spontaneous answers from participants. There were also questions using 7-point scales and 5-point scales.
Before the questionnaire was available for participants, it was pre-tested in two steps. First, it was tested with three people. Based on their feedback, the order of the questions was changed. In addition, based on some comments about the lack of comprehension, a few words were changed.
The second step, consisted of pre-testing the questionnaire with five international students. These students were asked to think aloud while filling out the questionnaire. Moreover, after answering the questionnaire they were asked to evaluate the clarity of the instrument. The pre-test was also an opportunity to measure the time that participants took to fill out the questionnaire.
4.3 Collection and Analysis of Data
The collection of data was done through the Internet. Participants received via e-mail an invitation to take part in the survey. In this message there was a link to the questionnaire. The data were collected between June 14th and July 29th 2005.
The statistical analysis of data was mainly done using the technique Independent Samples T-Test. Nevertheless, when another technique was used, it was indicated.
Based on previous studies that have shown one direction for the majority of the hypotheses, all the statistical tests were one-sided. Additionally, differences between the groups were tested based on the level of α=0.05.
5. Results
This chapter describes the results of the study in three parts. The first part introduces the demographic data of the participants and relevant information about their Internet access. The second part presents information about the cultural background of participants and classifies them according to UAI (Uncertainty Avoidance Index) and IDV (Individualism - Collectivism Index). The third part tests the eight hypotheses from this study in order to obtain an understanding about the relation between e-commerce and cultural background.
5.1 Participants
From the 126 respondents that answered the questionnaire, 23 were excluded because they did not answer the questionnaire completely. Many of these participants answered only the demographic questions.
The final sample had 103 participants of 35 nationalities (see table 5.1). They consisted of 55 females and 46 male plus two participants that did not answer this question. The majority of the participants (70.6% ) were between 21-30 years old. According to the level of education, almost fifty percent of the participants were studying at a master level. Only 4.9% of the participants were native speakers of English. The fact that the majority of the participants were not native English speakers could have been a problem, but this was not the case for participants had the opportunity to skip a question when there was a lack of comprehension. The results show that participants did skip questions, as it is specified in every table presented in this chapter. About one third of the participants were living in The Netherlands for a period over two years. Almost all participants, 97.1% have a computer in the Netherlands and 92% have a fast Internet connection. It means that almost all participants had the basic conditions to buy through the Internet.
5.2 Cultural Values
Based on these considerations, the indexes were calculated individually for each participant for the two dimensions considered in this study: Uncertainty Avoidance (UAI) and Individualism – Collectivism (IDV).
5.2.1 Uncertainty Avoidance (UAI)
The UAI index was calculated based on the answers of the three questions of Hofstede that measure this dimension:
How often do you feel nervous or tense at university? (q22)
University rules should not be broken – even when the student thinks it is in the university’s best interests. (q23)
How long do you think you will continue studying or working in this professional field? (q24)
The classification of the participants into low or high UAI was done using the median split, which consisted of the following calculation. Considering 102 participants (one participant that did not answer all the three questions was excluded), the overall mean for the three questions was M=2.85 and the overall standard deviation was SD=0.58. The overall SD=0.58 was divided by two, resulting in SD/2=0.29. This value was added to and diminished from the overall mean (M=2.85) resulting, respectively, in 3.14 and 2.56. All participants who had their own overall mean [(q22+q23+q24)/3) between these two values were excluded from the sample. Those who had an overall mean above 3.14 were classified as high UAI and those who had an overall mean lower than 2.56 were classified as low UAI. From the 102 participants, 24 were considered low UAI and 28 high UAI.
5.2.2 Individualism – Collectivism (IDV)
In order to calculate whether participants classified as individuals with low or high IDV the results of the following six questions adapted from Hofstede questionnaire were fundamental:
Have good physical studying conditions (good ventilation and lighting, adequate work space, etc.)? (physical conditions) (q8)
Have the opportunity to take other courses, apart from your regular program? (Training) (q13)
Fully use your skills and abilities on the course? (Use of skills) (q20)
Have challenging tasks to do, from which you can get a personal sense of accomplishment? (Challenge) (q9)
Have sufficient time left for your personal or family life? (Personal time) (q21)
Participants answered these questions by choosing among one of the following alternatives:
of utmost importance to me (1)
very important (2)
of moderate importance (3)
of little importance (4)
of very little or no importance (5)
Due to the fact that questions 9,16,21 have a positive correlation coefficient and questions 8,13 and 20 have a negative correlation coefficient (Hofstede, 1984, p. 156), it was necessary to introduce a reverse scale for question 9,16, and 21 in order to properly calculate the mean of these six questions. Considering the 102 participants that answered these six questions (one participant that did not answer all the six questions was excluded), the overall mean and overall standard deviation of the six questions were respectively M=3.08 and SD=0.27. The same procedure used to calculate UAI was used for IDV, which resulted in two values: 2.94 and 3.22. All participants who had their own overall mean between these two values were excluded from the sample. Those who had an overall mean above 3.22 were classified as high IDV and those who had an overall mean lower than 2.94 were classified as low IDV. From the 102 participants, 26 were considered low IDV and 24 high IDV.
5.2.3 National Indexes x Individual Indexes
Table 5.1
IDV and UAI Indexes (n=99)
# of IDV IDV UAI UAI
Participants L N H Hofstede L N H Hofstede
Armenia 1 - 1 - N/A - - 1 N/A
Belgium 1 - - 1 H - 1 - H
Brazil 4 2 2 - L 1 2 1 H
Bulgaria 2 - 1 1 L* - 2 - H*
China 11 4 3 4 L* 3 3 5 L*
Colombia 3 1 2 - L 1 1 1 H
Croatia 1 1 - - N/A - 1 - N/A
Denmark 2 - 1 1 H 1 1 - L
The Netherlands 7 - 6 1 H - 7 - L
Eritrea 1 1 - - L - 1 - L
Ethiopia 1 - - 1 L - 1 - L
Philippines 1 1 - - L - - 1 L
Finland 1 - 1 - H - 1 - L
Germany 22 5 13 4 H 11 8 3 L/H**
Greece 1 - 1 - L - 1 - H
India 5 1 4 - H - 3 2 L
Indonesia 5 2 2 1 L - 4 1 L
Ireland 1 1 - - H - 1 - L
Italy 1 - - 1 H - - 1 H
Japan 2 - 1 1 H - 1 1 H
Kuwait 2 - 1 1 L - - 2 H
Libya 2 1 1 - L - 1 1 H
Nigeria 1 - 1 - L 1 - - L
Peru 1 - 1 - L - 1 - H
Portugal 2 - 1 1 L 1 1 - H
Romania 2 - 1 1 L* - 2 - H*
South Africa 3 1 2 - H 1 2 - L
Spain 6 3 1 2 H 2 1 3 H
Sweden 1 - - 1 H - 1 - L
Tanzania 1 1 - - L - 1 - L
Turkey 1 - 1 - L - - 1 H
Uganda 1 - 1 - N/A - 1 - N/A
Ukraine 1 - 1 - N/A - - 1 N/A
Venezuela 2 - 1 1 L 1 - 1 H
Vietnam 2 1 1 - L* - 2 - L*
Index Scores for countries and regions from the IBM Set (Hofstede, 2001, p. 500) *Index score estimates for countries not in the IBM set (Hofstede, 2001, p. 502) ** Germany has an UAI index of 65, exactly the mean of the UAI dimension N/A – Countries without Hofstede dimension Index
L - Low Index
H – High Index
As can been seen in table 5.1, there were differences between the scores given by Hofstede for the countries and the scores that the participants from this study received at an individual level. For example, according to Hofstede, people from India have low UAI. In contrast, the two Indian participants of the study reported here classified as high UAI. On the other hand, Hofstede classified people from Belgium and Sweden as high IDV. Likewise, the two participants from these countries classified as high IDV in the study reported here. This difference between Hofstede classification and this study can be mainly explained by the fact that Hofstede calculated indexes for countries and in this study the indexes were calculated at the individual level. Moreover, some indexes from Hofstede were estimated values.
Overall, considering that in the study reported here the values were calculated at the individual level, all the results of this study will be presented related to the scores of the participants on the cultural dimensions (UAI, IDV) and not related to their nationalities.
5.3 Hypotheses
This section presents the results of this study related to e-commerce and its relationship with cultural background. The following hypotheses will be tested:
1. Individuals with high UAI buy less through the Internet than individuals with low UAI.
2. Individuals with high IDV buy more through the Internet than individuals with low IDV.
3. Individuals with high IDV and low UAI buy more through the Internet than individuals with high IDV and high UAI.
4. Individuals who spend more hours on the Internet, buy more through the Internet.
5. Lack of security is a factor that influences individuals with high UAI more than individuals with low UAI not to buy through the Internet.
6. Information about how secure a specific site is, is more important for individuals with high UAI than for individuals with low UAI.
7. Offering privacy guarantees on the Internet is more important for individuals with high UAI than individuals with low UAI.
8. Individuals with high UAI are more willing to use the credit card on their Internet purchases when special conditions are offered than individuals with low UAI.
5.3.1 Purpose of Internet Usage
usage, the following question was added to the questionnaire: “What do you use
the Internet for?” The results showed that shopping through the Internet was not
the main purpose for participants to use the Internet, as can be seen in table 5.2. The majority of the participants use the Internet for communication (100), followed by education (97), entertainment (77) and at the fifth position is shopping (56).
Table 5.2
Internet Purpose Usage (n=103)
Purpose Total
Communication with others 100
Education 97
Banking 89
Entertainment 77
Shopping/gathering product information 56
Work/Business 53
Other 7
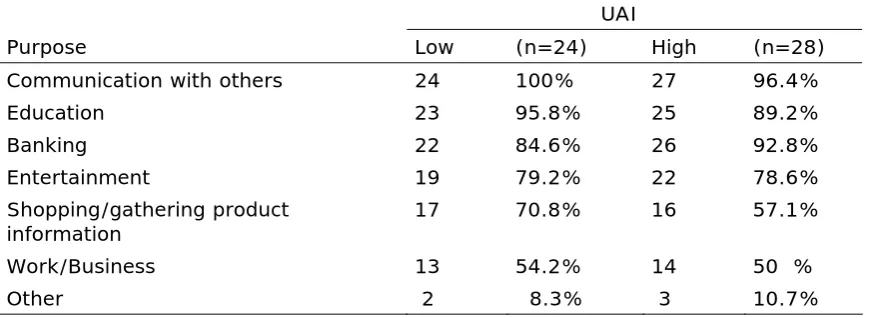
Since ‘communication with others’ was the purpose of Internet usage for 97% of the participants, as expected, it also kept as the main purpose for individuals with low and high UAI. However, regarding to the second purpose, there was a small difference between the two groups, as can be seen in table 5.3. While people with low UAI used Internet more for education (95.8%), high UAI used it more for banking (92.8%). The third purpose of Internet usage, indicates that low UAI used it for banking (84.6%) while high UAI for education (89.2%). In fact, these differences between groups were too small to be significant. More interesting results were found when comparing individuals with low and high UAI related to ‘shopping/gathering product information’ as a purpose of Internet usage. Individuals with low UAI used the Internet more (70.8%) for this purpose than individuals with high UAI (57.1%). This result is in accordance with what is predicted by hypothesis 1 “Individuals with high UAI buy less through the Internet
than individuals with low UAI”. Nevertheless, before this hypothesis will be
supported, further analysis has to be done. This hypothesis will be further tested at section 5.3.2.
Table 5.3
UAI and Internet Purpose Usage (n=52)
UAI
Purpose Low (n=24) High (n=28)
Communication with others 24 100% 27 96.4%
Education 23 95.8% 25 89.2%
Banking 22 84.6% 26 92.8%
Entertainment 19 79.2% 22 78.6%
Shopping/gathering product
information 17 70.8% 16 57.1%
Work/Business 13 54.2% 14 50 %
Comparing individuals with low and high IDV, as can be seen in table 5.4, there was a difference in the order of importance of the purpose of Internet usage. While, ‘communication with others’ was a purpose of Internet usage for 100% of the high IDV, it was for 84.6% of the low IDV. For low IDV, education was the most important purpose of Internet usage whereas for high IDV it was the second main purpose for Internet usage. Nevertheless, it was a purpose of Internet usage for 95.9% of the high IDV. Banking remained as the third purpose for Internet usage. However, high IDV (91.6%) used slightly more Internet for banking than low IDV (80.7%)%). Comparing individuals regarding to the shopping purpose, surprisingly, low IDV (57.7%) considered it slightly more a purpose of Internet usage than high IDV (50%). Nevertheless, shopping remained as the fifth purpose of Internet usage for both groups.
Table 5.4
IDV and Internet Purpose Usage (n=50)
IDV
Purpose Low (n=26) High (n=24)
Communication with others 22 84.6% 24 100 %
Education 24 92.3% 23 95.9%
Banking 21 80.7% 22 91.6%
Entertainment 18 69.2% 19 79.2%
Shopping/gathering product
information 15 57.7% 12 50 %
Work/Business 14 53.8% 9 37.5%
Other 2 7.7% 2 8.3%
5.3.2 Online Purchases
Of the 103 participants that answered the question “How often have you
bought through the Internet in the past year?“, 21 have never bought through the
Internet. Thus, 79.6% of the participants have bought through the Internet in the past year. As can be seen in table 5.5, about two thirds (69%) can be considered regular buyers.
Table 5.5
Frequency of Online Purchases (n=103)
Frequency Frequency
Never 21
Once 11
2-5 times 46
Over five times 25
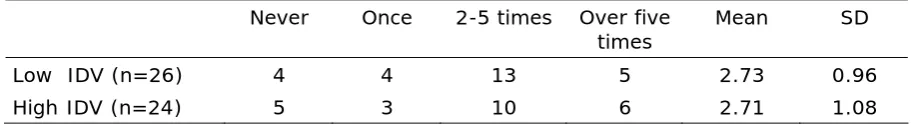
Table 5.6 provides the figures to test the hypothesis 1 “Individuals with high
UAI buy less through the Internet than individuals with low UAI” buy less through
than individuals with low UAI (70.8%). Likewise, comparing the frequency of online purchases of these two groups, the figures appear to show that individuals with high UAI bought less through the Internet (M=2.68, SD=1.09, n=28) than individuals with low UAI (M=3.00, SD=1.02, n=24). However, this difference is not statistically significant (t(50)=1.09, p=0.14). It was expected to be a negative correlation between UAI and frequency of online purchases. The Spearman’s Correlation Test done with the complete sample seems to indicate that there might be a negative correlation between UAI and frequency of online purchases, however, not statistically supported (r= -.14, N= 102, p= 0.08).
Table 5.6
UAI and Frequency of Online Purchases (n=52)
Never Once 2-5 times Over five
times Mean SD
Low UAI (n=24) 3 3 9 9 3.00 1.02
High UAI (n=28) 6 4 11 7 2.68 1.09
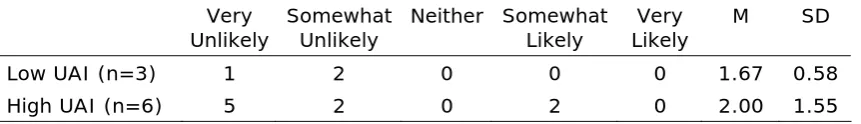
When those participants who have never bought through the Internet were asked the following question ” How likely is it that you will buy through Internet in
the next six months?“, participants with high UAI seemed to be more willing to buy
through the Internet (M=2.00, SD=1.55, n=6) than participants with low UAI (M=1.67, SD=0.58, n=3), as can be seen in table 5.7. However, this difference is not significant (t(19)=-.35, p=0.37), perhaps due to the small number of respondents involved (6+3). As conclusion, based on the statistical analyses of the results presented in tables 5.6 and 5.7 it can be said that hypothesis 1 “Individuals
with high UAI buy less through the Internet than individuals with low UAI” is not
supported.
Table 5.7
UAI and Intention to Buy in the Next 6 Months (n=9)
Very
Unlikely Somewhat Unlikely Neither Somewhat Likely Likely Very M SD
Low UAI (n=3) 1 2 0 0 0 1.67 0.58
High UAI (n=6) 5 2 0 2 0 2.00 1.55
The analysis of the two questions above is also important in order to test the hypothesis 2: “Individuals with high IDV buy more through the Internet than
individuals with low IDV”. Table 5.8 shows that individuals with high IDV (M=2.71,
SD=1.08, n=24) did not buy more than individuals with low IDV (M=2.73, SD=0.96, n=26). Based on the statistical analyses of these results (t(48) =0.08, p=0.47), it can be said that the hypothesis 2 is not supported. Additionally, the Spearman’s Correlation Test done with the complete sample shows that there is no significant correlation between IDV and frequency of online purchases (r=0.06, N= 102, p= 0.29).