R E S E A R C H
Open Access
Context-aware visual analysis of elderly activity in
a cluttered home environment
Muhammad Shoaib
*, Ralf Dragon and Joern Ostermann
Abstract
This paper presents a semi-supervised methodology for automatic recognition and classification of elderly activity in a cluttered real home environment. The proposed mechanism recognizes elderly activities by using a semantic model of the scene under visual surveillance. We also illustrate the use of trajectory data for unsupervised learning of this scene context model. The model learning process does not involve any supervised feature selection and does not require any prior knowledge about the scene. The learned model in turn de-fines the activity and inactivity zones in the scene. An activity zone further contains block-level reference information, which is used to generate features for semi-supervised classification using transductive support vector machines. We used very few labeled examples for initial training. Knowledge of activity and inactivity zones improves the activity analysis process in realistic scenarios significantly. Experiments on real-life videos have validated our approach: we are able to achieve more than 90% accuracy for two diverse types of datasets.
Keywords:elderly, activity analysis, context model, unsupervised, video surveillance
1 Introduction
The expected exponential increase of elderly population in the near future has motivated researchers to build multi-sensor supportive home environments based on intelligent monitoring sensors. Such environments will not only ensure a safe and independent life of elderly people at their own homes but will also result in cost reductions in health care [1]. In multi-sensor supportive home environments, the visual camera-based analysis of activities is one of the desired features and key research areas [2]. Visual analysis of elderly activity is usually per-formed using temporal or spatial features of a moving person’s silhouette. The analysis methods define the posture of a moving person using bounding box proper-ties like aspect ratio, projection histograms and angles [3-7]. Other methods use a sequence of frames to com-pute properties like speed to draw conclusion about the activity or occurred events [8,9]. The unusual activity is identified as a posture that does not correspond to nor-mal postures. This output is conveyed without taking care of the reference place where it occurs. Unfortu-nately, most of the reference methods in the literature
related to the elderly activity analysis base their results on lab videos and hence do not consider resting places, normally a compulsory part of realistic home environ-ments [3-10]. One other common problem specific to the posture-based techniques is partial occlusion of a person, which deforms the silhouette and may result in abnormal activity alarm. In fact, monitoring and surveil-lance applications need models of context in order to provide semantically meaningful summarization and recognition of activities and events [11]. A normal activ-ity like lying on a sofa might be taken as an unusual activity in the absence of context information for the sofa, resulting in a false alarm.
This paper presents an approach that uses the trajec-tory information to learn a spatial scene context model. Instead of modeling the whole scene at once, we pro-pose to divide the scene into different areas of interest and to learn them in subsequent steps. Two types of models are learned: models for activity zones, which also contain block-level reference head information, and models for the inactivity zones (resting places). The learned zone models are saved as polygons for easy comparison. This spatial context is then used for the classification of the elderly activity.
The main contributions of this paper are
* Correspondence: [email protected]
Institut fuer Informationsverarbeitung, Appelstr. 9A, 30167 Hannover, Germany
- automatic unsupervised learning of a scene context model without any prior information, which in turn generates reliable features for elderly activity analysis,
- handling of partial occlusions (person to object) using context information,
- a semi-supervised adaptive approach for the classifi-cation of elderly activities suitable for scenarios that might differ from each other in different aspects and
- refinement of the classification results using the knowledge of inactivity zones.
The rest of the paper is organized as follows: In Sec-tion 2, we give an overview of related work and explain the differences to our approach. In Section 3, we present our solution and outline the overall structure of the context learning method. In Section 4, the semi-super-vised approach for activity classification is introduced. Experimental results are presented in Section 5 to show the performance of our approach and its comparison with some existing methods. Section 6 concludes our paper.
2 Related work
Human activity analysis and classification involves the recognition of discrete actions, like walking, sitting, standing up, bending and falling [12]. Some application areas that involve visual activity analysis include beha-vioral biometrics, content-based video analysis, security and surveillance, interactive applications and environ-ments, animation and synthesis [13]. In the last decades, visual analysis was not a preferred way for elderly activ-ity due to a number of important factors like privacy concerns, processing requirements and cost. Since sur-veillance cameras and computers became significantly cheaper in recent years, researchers have started using visual sensors for elderly activity analysis. Elderly people and their close relatives also showed a higher acceptance rate of visual sensors for activity monitoring [14,15]. A correct explanation of the system before asking their opinion resulted in an almost 80% acceptance rate. Priv-acy of the monitored person is never compromised
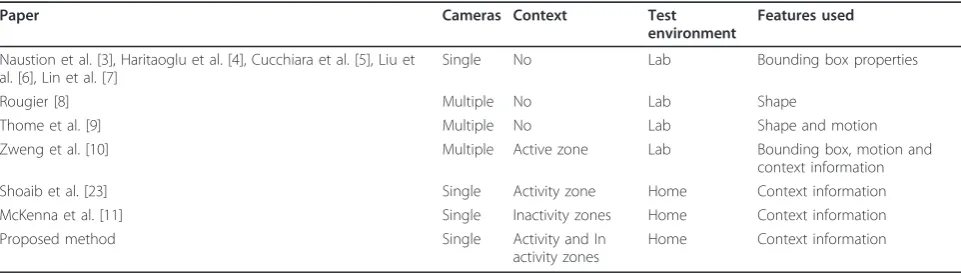
during visual analysis. No images leave the system unless authorized by the monitored person. If he allows transmitting the images for the verification of unusual activities, then only the masked images are delivered, in which he or his belongings cannot be recognized. Research methods that have been published in the last few years can be categorized into three main types. Table 1 summarizes approaches used for elderly activity analysis. The approaches like [3-7] depend on the varia-tion of the person bounding box or its silhouette to detect a particular action after its occurrence. Approaches [8,16] depend upon shape or motion pat-terns of the moving persons for unusual activity detec-tion. Some approaches like [9] use a combination of both type of features. The authors in Thome et al. [9] proposed a multi-view approach for fall detection by modeling the motion using a layered Hidden Markov Model. The posture classification is performed by a fusion unit that merges the decisions provided by pro-cessing streams from independent cameras in a fuzzy logic context. The approach is complex due to its multi-ple camera requirement. Further, no results were pre-sented from real home cluttered environments, and resting places were not taken into account either.
The use of context is not new and has been employed in different areas like traffic monitoring, object detec-tion, object classificadetec-tion, office monitoring [17], video segmentation [18], or visual tracking [19-21]. McKenna et al. [11] introduced the use of context in elderly activ-ity analysis. They proposed a method for learning mod-els of spatial context from tracking data. A standard overhead camera was used to get tracking information and to define inactivity and entry zones from this infor-mation. They used a strong prior about inactive zones, assuming that they are always isotropic. A person stop-ping outside a normal inactive zone resulted in an abnormal activity. They did not use any posture infor-mation, and hence, any normal stopping outside inactive region might result in false alarm. Recently, Zweng et al. [10] proposed a multi-camera system that utilizes a
Table 1 Summary of the state of the art visual elderly activity analysis approaches
Paper Cameras Context Test
environment
Features used
Naustion et al. [3], Haritaoglu et al. [4], Cucchiara et al. [5], Liu et al. [6], Lin et al. [7]
Single No Lab Bounding box properties
Rougier [8] Multiple No Lab Shape
Thome et al. [9] Multiple No Lab Shape and motion
Zweng et al. [10] Multiple Active zone Lab Bounding box, motion and
context information
Shoaib et al. [23] Single Activity zone Home Context information
McKenna et al. [11] Single Inactivity zones Home Context information
Proposed method Single Activity and In
activity zones
Home Context information
Shoaibet al.EURASIP Journal on Advances in Signal Processing2011,2011:129 http://asp.eurasipjournals.com/content/2011/1/129
context model called accumulated hitmap to represent the likelihood of an activity to occur in a specific area. They define an activity in three steps. In the first step, bounding box features such as aspect ratio, orientation and axis ratio are used to define the posture. The speed of the body is combined with the detected posture to define a fall confidence value for each camera. In the second step, the output of the first stage is combined with the hitmap to confirm that the activity occurred in the specific scene area. In the final step, individual cam-era confidence values are fused for a final decision.
3 Proposed system
In home environment, context knowledge is necessary for activity analysis. Lying on the sofa has a very differ-ent interpretation than lying on the floor. Without con-text information, usual lying on sofa might be classified as unusual activity. Keeping this important aspect in mind, we propose a mechanism that learns the scene context model in an unsupervised way. The proposed context model contains two levels of informations: block-level information, which will be used to generate features for direct classification process, and zone-level information, which is used to confirm the classification results.
The segmentation of a moving person from back-ground is the first step in our activity analysis mechan-ism. The moving person is detected and refined using a combination of color and gradient-based background subtraction methods [22]. We use mixture of Gaussian-based background subtraction with three distributions to identify foreground objects. Increasing the number of distributions does not improve segmentation in indoor scenarios. The effects of the local illuminations changes like shadows and reflections, and global illumination changes like switching light on or off, opening or closing curtains are handled using gradient-based background subtraction. Gradient-based background subtraction provides contours of the moving objects. Only valid objects have contours at their boundary. The resulting silhouette is processed further to define key points, the center of mass, head centroid position Hc and feet or lower body centroid position using connected compo-nent analysis and ellipse fitting [14,23]. The defined key points of the silhouette are then used to learn the activ-ity and inactivactiv-ity zones. These zones are represented in the form of polygons. Polygon representation allows easy and fast comparison with the current key points.
3.1 Learning of activity zones
Activity zones represent areas where a person usually walks. The scene image is divided into non-overlapping blocks. These blocks are then monitored over time to record certain parameters from the movements of the
persons. The blocks through which feet or in case of occlusions lower body centroids pass are marked as floor blocks.
Algorithm 3.1:Learning of the activity zones (image) Step 1:Initialize
i. divide the scene image into non-overlapping blocks ii. for each block set the initial values
μcx¬0
μcy¬0 count¬0 timestamp¬0
Step 2: Update blocks using body key-points fort¬ 1toN
do ⎧ ⎪ ⎪ ⎪ ⎪ ⎪ ⎪ ⎪ ⎪ ⎪ ⎪ ⎪ ⎪ ⎪ ⎪ ⎨ ⎪ ⎪ ⎪ ⎪ ⎪ ⎪ ⎪ ⎪ ⎪ ⎪ ⎪ ⎪ ⎪ ⎪ ⎩
ifaction=walk
then ⎧ ⎪ ⎪ ⎪ ⎪ ⎪ ⎪ ⎪ ⎪ ⎪ ⎪ ⎪ ⎪ ⎨ ⎪ ⎪ ⎪ ⎪ ⎪ ⎪ ⎪ ⎪ ⎪ ⎪ ⎪ ⎪ ⎩
update the block where the centroid of body lie
ifcount= 0
then
μcx(t) =Cx(t)
μcy(t) =Cy(t)
else
μcx(t) =α.Cx(t) + (1−α).μcx(t−1)
μcy(t) =α.Cy(t) + (1−α).μcy(t−1)
count←count+ 1 timestamp←currentime
Step 3: refine the block map and define activity zones
topblk = block at the top of current block toptopblk = block at the top of topblk rightblk = block to the right of current block rightrightblk = block to the right of rightblk i. perform the block-level dilation process iftopblk = 0∩toptopblk! = 0
then
topblk−μcx(t) = (toptopblk−μcx(t)) +μcx(t))/2 topblk−μcy(t) = (toptopblk−μcy(t)) +μcy(t))/2
ifrightblk = 0∩rightrightblk! = 0
then
rightblk−μcx(t) = (rightrightblk−μcx(t) +μcx(t))/2
rightblk−μcy(t) = (rightrightblk−μcy(t)) +μcy(t))/2
ii. perform the connected component analysis on the refined floor
blocks to find clusters
iii. delete the clusters containing just single block iv. define the edge blocks for each connected component
v. find the corner points from the edge blocks vi. save corner pointsV0,V1,V2, ...,Vn=V0
as the vertices of a polygon representing an activity zone or cluster
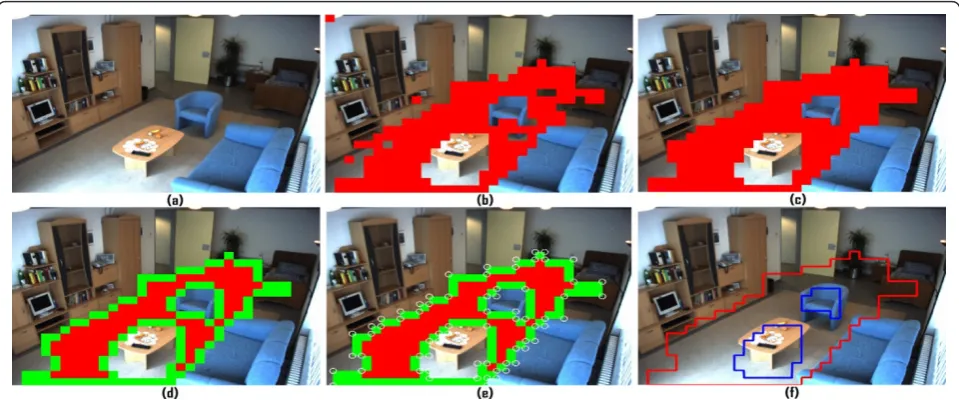
information of moving persons. Figure 1c shows the refinement process, blocks are clustered into connected groups, single block gaps are filled, and then, clusters containing just one block are removed. This refinement process adds the missing block information and removes the erroneous blocks detected due to wrong segmenta-tion. Each block has an associated count variable to ver-ify the minimum number of the centroids passing through that block and a time stamp that shows the last use of the block. These two parameters define a prob-ability value for each block. Only highly probable blocks are used as context. Similarly, the blocks that have not been used for a long time, for instance if covered by the movement of some furniture do not represent activity regions any more, and are thus available to be used as a possible part of an inactivity zone. The refinement pro-cess is performed when the person leaves the scene or after a scheduled time. Algorithm 3.1 explains the mechanism used to learn the activity zones in detail. Each floor block at timet has an associated 2D refer-ence mean head location Hr (μcx(t), μcy(t) for x and y coordinates). This mean location of a floor block repre-sents the average head position in walking posture. It is continuously updated in case of normal walking or standing situations.
In order to account for several persons or changes over time, we compute the averages according to
μcx(t) =α·Cx(t) + (1−α)·μcx(t−1) μcy(t) =α·Cy(t) + (1−α)·μcy(t−1)
(1)
whereCx,Cyrepresent the current head centroid loca-tion, andais the learning rate, which is set to 0.05 here. In order to identify the activity zone, the learned blocks
are grouped into a set of clusters, where each cluster represents a set of connected floor blocks. A simple postprocessing step similar to erosion and dilation is performed on each cluster. First, single floor block gaps are filled, and head location means are computed by interpolation from neighboring blocks. Then, clusters containing single blocks are removed. Remaining clus-ters are finally represented as a set of polygons. Thus, each activity zone is a closed polygon Ai, which is defined by an ordered set of its vertices V0, V1,V2, ...,
Vn =V0. It consists of all the line segments consecu-tively connecting the vertices Vi, i.e.,
V0V1,V1V2, ...,Vn−1Vn=Vn−1V0. An activity zone is normally in an irregular shape and is detected as a con-cave polygon. Further, it may contain holes due to the presence of obstacles, for instance chairs or tables. It might be possible that all floor blocks are connected due to continuous paths in the scene. Therefore, the whole activity zone might just be a single polygon. Fig-ure 1c shows the cluster representing the activity zone area. Figure 1d shows the result after refinement of the clusters. Figure 1e shows the edge blocks of cluster drawn in green and the detected corners drawn as cir-cles. The corners define the vertices of the activity zone polygon. Figure 1f shows the final polygon detected from the activity area cluster, the main polygon contour is drawn in red, while holes inside polygon are drawn in blue.
3.2 Learning of inactivity zones
Inactivity zones represent the areas where a person nor-mally rests. They might be of different shapes or scales and even in different numbers depending on the Figure 1Unsupervised learning procedure for activity zones.aSurveillance scene,bfloor blocks,crefinement process of blocks,dedge blocks,ecorners andfactivity zone polygon.
Shoaibet al.EURASIP Journal on Advances in Signal Processing2011,2011:129 http://asp.eurasipjournals.com/content/2011/1/129
number of resting places in the scene. We do not assume any priors about the inactivity zones. Any num-ber of resting places of any size or shape present in the scene will be modeled as inactivity zones, as soon as they come in to use. Inactivity zones again are repre-sented as polygons. A semi-supervised classification mechanism classifies the actions of a person present in the scene. Four types of actions, walk, sit, bend and lie, are classified. The detailed classification mechanism is explained later in Section 4. If the classifier indicates a sitting action, a window representing a rectangular area Baround the centroid of the body is used to learn the inactivity zone. Before declaring this area Bas a valid inactivity zone, its intersection with existing sets of activity zone polygons Ai is verified. A pairwise polygon comparison is performed to check for intersections. The intersection procedure results in a clipped polygon con-sisting of all the points interior to the activity zone poly-gonAi(clip polygon) that lie inside the inactivity zoneB (subject). This intersection process is performed using a set of rules summarized in Table 2[24,25].
The intersection process [24] is performed as follows. Each polygon is perceived as being formed by a set of left and right bounds. All the edges on the left bound are left edges, and those on the right are called right edges. Left and right sides are defined with respect to the interior of polygon. Edges are further classified as likeedges (belonging to same polygon) and unlikeedges (of different types means belongs to two different poly-gons). The following convention is used to formalize these rules: An edge is characterized by a two-letter word. The first letter indicates whether the edge is left (L) or right (R) edge, and the second letter indicates whether the edge belongs to subject (S) or clip (C) poly-gon. An edge intersection is indicated by X. The vertex formed at the intersection is assigned one of the four vertex classifications: local minimum (MN), local maxi-mum (MX), left intermediate (LI) and right intermediate (RI). The symbol || denotes the logical‘or’.
The inactivity zones are updated anytime when they come in to use. If some furniture is moved to a neutral zone area, then the furniture is directly taken as new
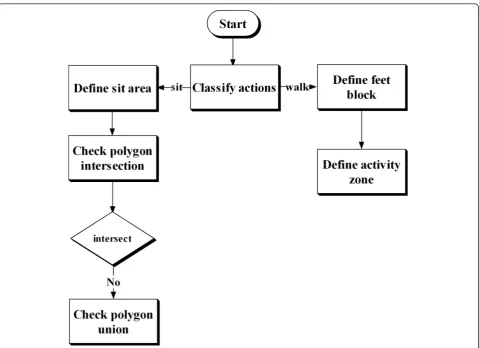
inactivity zone, as soon as it is used. If the furniture is moved to the area of an activity zone (intersect with an activity zone), then the furniture’s new place is not learned. This is only possible after the next refinement phase. The following rule is followed for the zone upda-tion: an activity region block might take the place of an inactivity region, but an inactivity zone is not allowed to overlap with an activity zone. The main reason for this restriction is that a standing posture on an inactivity place is unusual to occur. If it occurs for short time, either it is wrong and will be automatically handled by evidence accumulation or it has been occurred while the inactivity zone has been moved. In that case, the stand-ing posture is persistent and results in the updation of an inactivity zone. The converse is not allowed because it may result in learning of false inactivity zones in the free area like floor. Sitting on the floor is not same as sitting on sofa and is classified as bending or kneeling. The newly learned feet blocks are then accommodated in an activity region in the next refinement phase. This region learning is run as a background process and does not disturb the actual activity classification process. Fig-ure 2 shows a flowchart for the inactivity zone learning.
In the case of intersection with activity zones, the assumed current sitting area B (candidate inactivity zone) is detected as false and ignored. In case of no intersection, neighboring inactivity zones Ii of B are searched. If neighboring inactivity zones already exist,B is combined with Ii. This extended inactivity zone is again checked for intersection with the activity zones, while it is probable that two inactivity zones are close enough, but in fact, they belong to two separate resting places and are partially separated by some activity zone. So the activity zones act as a border between different inactivity zones. Without intersection check, a part of some activity zone might be considered as an inactivity zone, which might result in wrong number and size of inactivity zones, which in turn might result in wrong classification results. The polygon intersection verifica-tion algorithm from Vatti [24] is strong enough to pro-cess irregular polygons with holes. In the case of intersection of joined inactivity polygon with activity polygon, the union of the inactivity polygons is reversed and the new area B is considered as a new inactivity zone.
4 Semi-supervised learning and classification The goal of activity analysis is to automatically classify the activities into predefined categories. The perfor-mance of supervised statistical classifiers often depends on the availability of labeled examples. Using the same labeled examples for different scenarios might degrade the system performance. On the other hand, due to the restricted access and manual labeling of data, it is Table 2 Rules to find intersections between two polygons
[24,25]
Rules to classify intersection between unlike edges are: Rule 1: (LC∩LS)||(LS∩LC)®LI
Rule 2: (RC∩RS)||(RS∩RC)®RI
Rule 3: (LS∩RC)||(LC∩RS)®MX
Rule 4: (RS∩LC)||(RC∩LS)®MN
Rules to classify intersection between like edges are: Rule 5: (LC∩RC)||(RC∩LC)®LIandRI
difficult to get data unique for different scenarios. In order to make the activity analysis process completely automatic, the semi-supervised approach transductive support vector machines (TSVMs) [26] are used. TSVMs are a method of improving the generalization accuracy of conventional supervised support vector machines (SVMs) by using unlabeled data. As conven-tional SVM support only binary classes, a multi-class problem is solved by using a common one-against-all (OAA) approach. It decomposes an M-class problem into a series of binary problems. The output of OAA is MSVM classifiers with the ith classifier separating class ifrom the rest of classes.
We consider a set of L training pairs L={(x1,y1), ..., (xL,yL)}, x Î ℝn, y Î {1, ..., n} common for all scenarios and an unlabeled set of Utest vectors {xL+1, ..., xL+U} specific to a scenario. Here, xi is the input vector and yi is the output class. SVMs have a decision functionfθ(·)
fθ(·) =w·(·) +b, (2)
whereθ= (ω,b) are parameters of the model, andF (·) is the chosen feature map. Given a training setLand an unlabeled datasetU, TSVMs find among the possible binary vectors
{ϒ= (yL+1, . . ., yL+U)} (3)
that one such that an SVM trained on L∪(U × ϒ) yields the largest margin. Thus, the problem is to find an SVM separating the training set under constraints, which force the unlabeled examples to be as far away as possible from the margin. This can be written as mini-mizing
1 2 ω
2+C L
i=1 ξi+C∗
L+U
i=L+1
ξi (4)
with subject to
yifθ(xi)≥1−ξi, i= 1,. . .,L (5)
|fθ(xi)| ≥1−ξi, i=L+ 1,. . .,L+U. (6)
Figure 2Flowchart for the inactivity zone learning.
Shoaibet al.EURASIP Journal on Advances in Signal Processing2011,2011:129 http://asp.eurasipjournals.com/content/2011/1/129
This minimization problem is equal to minimizing
Js(θ) =1
2 ω
2+C L
i=1
H1(yifθ(xi)) +C∗ L+2U
i=L+1
Rs(yifθ(xi))(7)
where -1≤s≤0 is a hyper-parameter, the functionH1 (·) = max(0, 1 - ·) is the classical Hinge loss function,Rs (·) = min(1 -s, max(0, 1 - ·)) is the Ramp loss function for unlabeled data,ξi are slack variables that are related to a soft margin andCis the tuning parameter used to balance the margin and training error. For C* = 0, we obtain the standard SVM optimization problem. For C* ≥ 0, we penalize the unlabeled data that is inside the margin. Further specific details of the algorithm can be found in Collobert et al. [26].
4.1 Feature vector
The input feature vectorsxifor the TSVM classification consist of three features, which describe the geometric constellation of feet, head and body centroid;
DH=|Hc−Hr|, DC= |Cc−Hr|, θH= arccos(γ
2+δ2−β2)
(2∗γ∗δ) , (8)
where
β=|Hc−Hr|, γ = |Hc−Fc|, δ= |Hr−Fc|. (9)
- The angleθH between the current 2D head position Hc(Hcx,Hcy) and 2D reference head positionHr,
- the distanceDHbetween HcandHr,
- and the distance DC between the current 2D body centroidCc andHr.
Note Hr is the 2D reference head location stored in the block-based context model for the each feet or lower body centroid Fc. The angle is calculated using the law of cosine. Figure 3 shows the values of three fea-tures for different posfea-tures. The blue rectangle shows the current head centroid, the green rectangle shows the reference head centroid, while the black rectangle shows the current body centroid. First row shows the distance values between the current and the reference head for different postures, and the second row shows the dis-tance between the reference head centroid and the cur-rent body centroid. The third row shows the absolute value of the angle between the current and the reference head centroids.
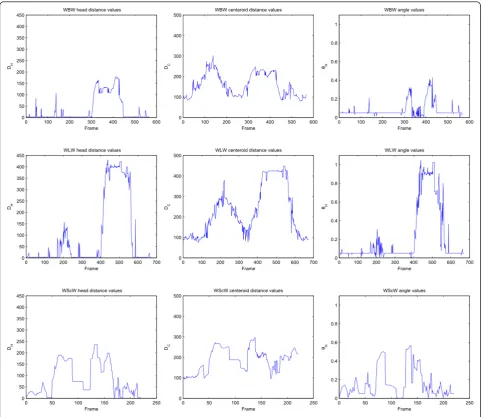
Figure 4 shows the frame-wise variation in the feature values for three example sequences. The first column shows the head centroids distance (DH) for three sequences, the second column shows the body centroid distance (DC), and the third column shows (θ) the abso-lute value of angle between the current and the refer-ence head centroids for three sequrefer-ences. The first row represents the sequence WBW (walk bend walk), the second row represents the sequence WLW (walk lie
walk), and the third row represents the sequence (walk sit on chair walk). Different possible sequence of activ-ities is mentioned in Table 3. It is obvious from the graphs in Figure 4 that the lying posture results in much higher values of the head distance, the centroid distance and the angle, while the walk posture results in very low distance and angle values. The bend and sit postures lie within these two extremes. The bending posture values are close to walking, while sitting posture feature values are close to lying.
4.2 Evidence accumulation
In order to exploit temporal information to filter out false classifications, we use the evidence accumulation mechanism from Nasution and Emmanuel [3]. For every framet, we maintain an evidence levelEt
j wherejrefers to thejth posture classified by SVM. Initially, evidence levels are set to zero. Evidence levels are then updated in each incoming frame depending on the svm classifier result as follows:
Etj=
Etj−1+Ec◦nst
D ,j= classified posture
0, otherwise (10)
where Econstis a predefined constant whose value is chosen to be 10000 andDis the distance of the current feature vector from the nearest posture. In order to per-form this comparison, we define an average feature vec-tor (DA
H, DAC, θHA)from initial training data for each posture.
D=|DH−DAH|+|DC−DAC|+|θH−θHA| (11)
All the feature values are standardized to correct their scales for distance calculation. The lower the distance, the more we are certain about a posture and less frames it will take to notify an event.
The updated evidence levels are then compared against a set of threshold values TEj, which correspond to each posture. If the current evidence level for a pos-ture exceeds its corresponding threshold, the pospos-ture is considered as final output of the classifier. At a certain framet, all the evidencesEt
jare zero except evidence of the matched or classified posture. At the initialization stage, we wait for accumulation of evidence to declare first posture. At later stages, if the thresholdTEjfor the matched posture has not reached, then last accumulated posture is declared for current frame.
4.3 Posture verification through context
normally lie on the resting places in order to relax or sleep. Hence, if the person is classified as lying in an inactivity zone, then it is considered as a normal activity and unusual activity alarm is not generated. In order to verify the elderly presence in the inactivity zone, cen-troid of the person silhouette in the inactivity polygons is checked. Similarly, a bending posture detected in an inactivity zone is false classification and is changed to sitting, and sitting posture within activity zone might be bending and changed vice versa.
4.4 Duration test
A valid action (walk, bend etc) persists for a minimum duration of time. Slow transition between two posture states may result in an insertion of extra posture between two valid actions. Such short time postures can be removed by verifying the minimum length of the action. We empirically derived that a valid action must persist for minimum of 50 frames (a minimum period of 2 s).
5 Results and evaluation
In order to evaluate our proposed mechanism, we con-ducted our result on two completely different and diverse scenarios.
5.1 Scenario one 5.1.1 Experimental setup
Establishing standardized test beds is a fundamental requirement to compare algorithms. Unfortunately, there is no standard dataset available online related to elderly activity in real home environment. Our dataset along ground truth can be accessed at [27]. Figure 1a shows a scene used to illustrate our approach. Four actors were involved to perform a series of activities in a room specifically designed to emulate the elderly home environment. The room contains three inactivity zones chair (c), sofa (s) and bed (b). The four main actions possible in scenario might be walk (W), sit (S), bend (B) and lying (L). The actors were instructed to perform dif-ferent activities in difdif-ferent variations and combinations. One possible example might be“WScW”that represents walk into the room, sit on chair and then walk out of the room. A total of 16 different combinations of activ-ities is performed. The actors were allowed to perform an instruction more than once in a sequence, so
“WBW”might be“WBWBWBW”.
We used a static camera with wide-angle lens mounted at the side wall in order to cover maximum possible area of the room. A fish-eye lens was not employed to avoid mistakes due to lens distortion. The Figure 3Values of the features for different postures.
Shoaibet al.EURASIP Journal on Advances in Signal Processing2011,2011:129 http://asp.eurasipjournals.com/content/2011/1/129
sequences were acquired at a frame rate of 25 Hz. The image resolution was 1024 × 768. We also tested our system with low-resolution images too. In total, 30 video sequences containing more than 20.000 images (with person presence) were acquired under different lighting conditions and at different times. Indeed, room scenario used consists of a large area and even contains darker portions, where segmentation proved to be very hard task. Table 3 shows details of different possible combinations of instructions in acquired video dataset. 5.1.2 Evaluation
For evaluation, the sequences in the dataset were ran-domly allocated to training and testing such that half of the examples were allocated for testing. The training and test sets were then swapped, and results on the two sets were combined. Training process generates
unlabeled data that are used to retrain the TSVM classi-fier for testing phase. The training phase also generates the inactivity and activity zone polygons that are used for posture verification in testing phase. The annotation results for the dataset are summarized in Table 4. An overall error rate is computed using the measure Δ described in McKenna et al. [11]:
= 100× sub+ins+de1
Ntest (12)
such as walk and lying is ignored. Deletion errors occurred due to the false segmentation, for example in the darker area, on and near bed, distant from camera. Insertion errors occur due to slow state change, for instance, bending might be detected between walking and sitting. Substitution errors occurred either due to the wrong segmentation or due to wrong reference head position in context model. In summary, the automatic recognition of the sequences of atomic instructions
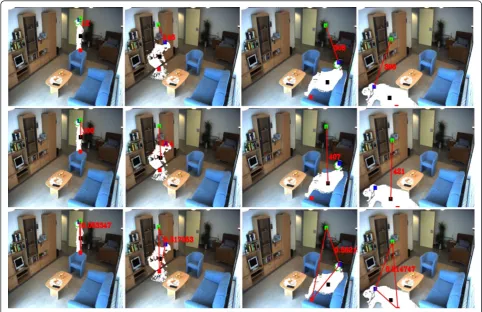
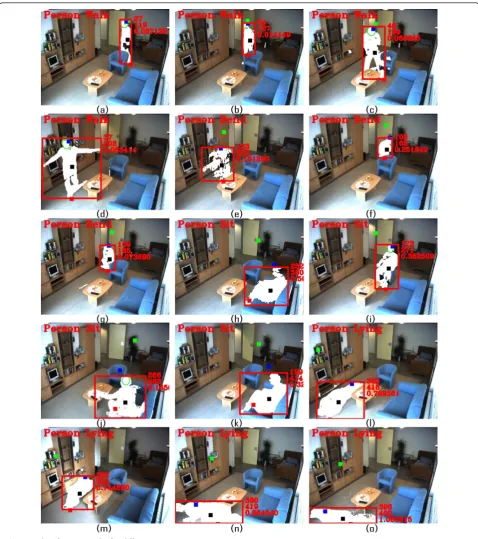
compared well with the instructions originally given to actors. Our mechanism proved to be view-invariant. It can detect unusual activity like fall in every direction, irrespective to the distance and direction of the person from camera. As we base our results on the context information, thus our approach does not fail for a parti-cular view of a person.
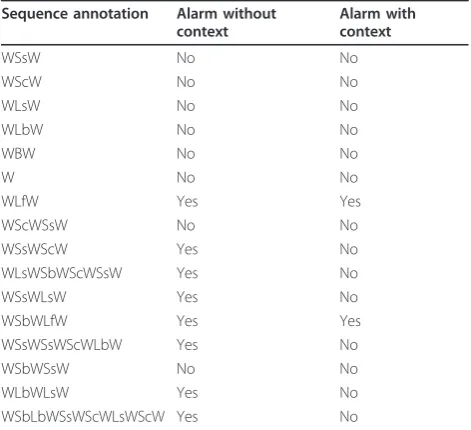
This fact is evident from the results in the Figure 5 and the Table 5. It is clearly evident that a person in the forward, lateral and backward views is correctly classi-fied. The Table 6 shows a list of alarms generated for different sequences with or without context information. Without context information, a normal lying on the sofa or on the bed resulted in a false alarm. The use context information successfully removed such false alarms.
The effect of evidence accumulation is verified by comparing the output of our classifier with or without evidence accumulation technique. We use following thresholds,TEj= Walk = 150,TEj= Bend = 800,TEj= Sit = 600, andTEj= Lying = 300 for evidence accumu-lation in our algorithm. Figure 6 shows a sample of this comparison. It can be seen that the output is less fluctu-ating with evidence accumulation. Evidence accumula-tion removes false postures detected for very short duration 1-5 frames. It might also remove short dura-tion true positives like bend. Frame-wise classifier results after applying accumulation of evidence are shown in the form of confusion matrix in Table 7. The majority of the classifier errors occur during the transi-tion of states, i.e., from sitting to standing or vice versa. These frame-level wrong classifications do not harm the activity analysis process. As long as state transitions are of short duration, they are ignored.
Table 3 The image sequences acquired for four actors
Sequence annotation Number of sequences
Average number of frames
WSsW 2 648
WScW 1 585
WLsW 1 443
WLbW 2 836
WBW 3 351
W 2 386
WLfW 10 498
WScWSsW 1 806
WSsWScW 1 654
WLsWSbWScWSsW 1 1512
WSsWLsW 1 1230
WSbWLfW 1 534
WSsWSsWScWLbW 1 2933
WSbWSsW 1 1160
WLbWLsW 1 835
WSbLbWSsWScWLsWScW 1 2406
Totals 30 20867
Label W, S, B, L denote atomic instructions for the actor to walk into the room, sit on sofa (s), chair (c) or bed (b), bend and lie (on sofa or floor (f)), respectively
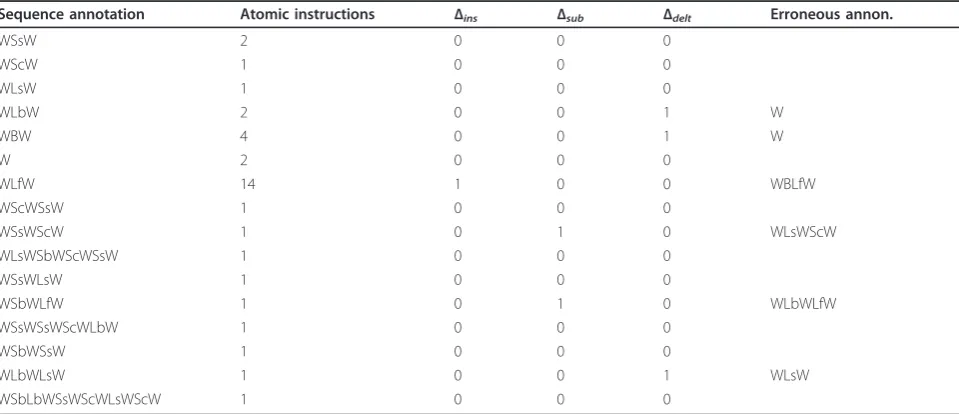
Table 4 Annotation errors after accumulation
Sequence annotation Atomic instructions Δins Δsub Δdelt Erroneous annon.
WSsW 2 0 0 0
WScW 1 0 0 0
WLsW 1 0 0 0
WLbW 2 0 0 1 W
WBW 4 0 0 1 W
W 2 0 0 0
WLfW 14 1 0 0 WBLfW
WScWSsW 1 0 0 0
WSsWScW 1 0 1 0 WLsWScW
WLsWSbWScWSsW 1 0 0 0
WSsWLsW 1 0 0 0
WSbWLfW 1 0 1 0 WLbWLfW
WSsWSsWScWLbW 1 0 0 0
WSbWSsW 1 0 0 0
WLbWLsW 1 0 0 1 WLsW
WSbLbWSsWScWLsWScW 1 0 0 0
Insertion, substitution and deletion errors are denotedΔins,ΔsubandΔdel, respectively
Shoaibet al.EURASIP Journal on Advances in Signal Processing2011,2011:129 http://asp.eurasipjournals.com/content/2011/1/129
Table 5 shows the posture-wise confusion matrix. The results shown are already refined using zone information and instruction duration test. The average posture clas-sification accuracy is about 87%. The errors occurred either in the bed inactivity zone as it is too far from camera and in a dark region of the room; hence, Figure 5Classification results for different postures.
Table 5 Confusion matrix: posture-wise results
Walk Lying Bend
Walk 72 0 1
Lying 0 40 3
segmentation of objects proved to be difficult. In a few cases, sitting on sofa turned into lying, while persons sit-ting in a more relaxed position resulted in a posture in between lying and sitting. In one sequence, bending was
totally undetected due to very strong shadows along the objects.
Figure 5 shows the classification results for different postures. The detected postures along with current fea-tures values like head distance, centroid distance and current angle are shown in the images. The detected sil-houettes are enclosed in the bounding box just to improve the visibility. The first row shows the walk pos-tures. Note that partial occlusions do not disturb the classification process, as we are keeping record of head reference at each block location. Similarly, the person with distorted bounding box with unusual aspect ratio in as we do not base our results on bounding box prop-erties. It is also clearly visible that even a false head location in Figure 5k, o resulted in correct lying posture, as we still get considerable distance and angle values using the reference head location. The results show that the proposed scheme is reliable enough for variable Table 6 Unusual activity alarm with and without context
information
Sequence annotation Alarm without context
Alarm with context
WSsW No No
WScW No No
WLsW No No
WLbW No No
WBW No No
W No No
WLfW Yes Yes
WScWSsW No No
WSsWScW Yes No
WLsWSbWScWSsW Yes No
WSsWLsW Yes No
WSbWLfW Yes Yes
WSsWSsWScWLbW Yes No
WSbWSsW No No
WLbWLsW Yes No
WSbLbWSsWScWLsWScW Yes No
Figure 6Accumulation process.
Table 7 Confusion matrix: frame-wise classifier results
Walk Lying Bend Sit
Walk 14627 55 157 122
Lying 116 1914 13 182
Bend 165 34 704 102
Sit 132 336 116 1536
Shoaibet al.EURASIP Journal on Advances in Signal Processing2011,2011:129 http://asp.eurasipjournals.com/content/2011/1/129
scenarios. Context information generates reliable fea-tures, which can be used to classify normal and abnor-mal activity.
5.2 Scenario two 5.2.1 Experimental setup
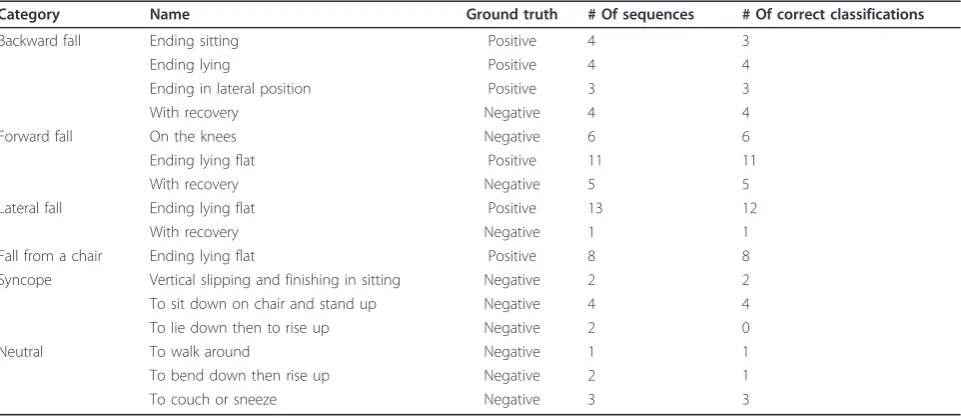
In order to verify our approach on some standard video dataset, we used a publically available lab video dataset for elderly activity [10,28]. The dataset defines no parti-cular postures like walk, sit, bend; videos are categorized into two main types normal activity (no fall) and abnor-mal activity (fall). They acquired different possible types of abnormal and normal actions described by Noury et al. [29] in lab environment. Four cameras with a resolu-tion 288 × 352 and frame rate of 25 fps were used. Five different actors simulated a scenarios resulting in a total of 43 positive (falls) and 30 negative sequences (no falls). As our proposed approach is based on 2Dimage features, hence we used videos only from one camera view (cam2). The videos from the rest of the cameras were not used in result generation. While using videos from a single camera, in some sequences due to restricted view, persons become partly or totally invisi-ble. As the authors did not use home scenario, so no resting places are considered, and for this particular video dataset, we use only block-level context informa-tion. We trained classifiers for three normal postures (walk, sit, bend or kneel) and one abnormal posture (fall). For evaluation, we divide the dataset into 5 parts. One part was used to generate the feature for training, and rest of 4 parts were used to test the system. Table 8 shows the average results after 5 test phases.
5.2.2 Evaluation
The average classification results for different sequences are shown in Table 8. The true positive and true nega-tives are considered in terms of sequences of abnormal and normal activity. The sequence-based sensitivity and specificity of our proposed method for above-mentioned dataset calculated using following equations are 97.67 and 90%.
sensitivity = tp
tp+fn (13)
specificity = tn
tn+fp (14)
wheretpis the number of true positives,tnnumber of true negatives,fpnumber of false positives and fn num-ber of false negatives. The ROC curves (Receiver Oper-ating characteristics) are not plotted against our classification results, while our TSVM-based semi-super-vised classifier does not use any classification thresholds; hence, we cannot generate different sensitivity and spe-cificity values for same dataset. We achieved competing results for resolution 288 × 352 video dataset using only single camera, while [28] used four cameras to generate their results for same dataset. Moreover, authors consid-ered lying on floor as a normal activity, but in fact lying on floor is not a usual activity.
The application of proposed method is not restricted to elderly activity analysis. It may also be used in other research areas. An interesting example may be traffic analysis; the road can be modeled as an activity zone. For such modeling, complete training data for a road
Table 8 The classification results for different sequences containing possible type of usual and unusual indoor activities using a single camera
Category Name Ground truth # Of sequences # Of correct classifications
Backward fall Ending sitting Positive 4 3
Ending lying Positive 4 4
Ending in lateral position Positive 3 3
With recovery Negative 4 4
Forward fall On the knees Negative 6 6
Ending lying flat Positive 11 11
With recovery Negative 5 5
Lateral fall Ending lying flat Positive 13 12
With recovery Negative 1 1
Fall from a chair Ending lying flat Positive 8 8
Syncope Vertical slipping and finishing in sitting Negative 2 2
To sit down on chair and stand up Negative 4 4
To lie down then to rise up Negative 2 0
Neutral To walk around Negative 1 1
To bend down then rise up Negative 2 1
should be available. Later, any activity outside the road or activity zone area might be unusual. An example of unusual activity might be an intruder on a motorway. Another interesting scenario might be crowd flow analy-sis. The activity zones can be learned as a context for usual flow of the crowd. Any person moving against this reference or context might be then classified as suspi-cious or unusual.
6 Conclusion
In this paper, we presented a context-based mechanism to automatically analyze the activities of elderly people in real home environments. The experiments performed on the sequence of datasets resulted in a total classifica-tion rate between 87 and 95%. Furthermore, we showed that knowledge about activity and inactivity zones signif-icantly improves the classification results for activities. The polygon-based representation of context zones proved to be simple and efficient for comparison. The use of context information proves to be extremely help-ful for elderly activity analysis in real home environ-ment. The proposed context-based analysis may be useful in the other research areas such as traffic moni-toring and crowd flow analysis.
Acknowledgements
We like to thank Jens Spehr and Prof. Dr.-Ing. Friedrich M. Wahl for their cooperation in capturing video dataset in home scenario. We also like to thank Andreas Zweng for providing his video dataset for the generation of results.
Competing interests
The authors declare that they have no competing interests.
Received: 31 May 2011 Accepted: 9 December 2011 Published: 9 December 2011
References
1. N Noury, G Virone, P Barralon, J Ye, V Rialle, J Demongeot, New trends in health smart homes. inProceedings of 5th International Workshop on Healthcom118–127 (2003)
2. O Brdiczka, M Langet, JL JM Crowley, Detecting human behavior models from multimodal observation in a smart home. IEEE Trans Autom Sci Eng.
6, 588–597 (2009)
3. H Nasution, S Emmanuel, inIEEE International Workshop on Multimedia Signal Processing, Intelligent Video Surveillance for Monitoring Elderly in Home Environments, (2007)
4. I Haritaoglu, D Harwood, LS Davis, inProceedings of the 14th International Conference on Pattern Recognition-Volume 1–Volume 1. ICPR‘98.Ghost: A Human Body Part Labeling System Using Silhouettes, IEEE Computer Society, Washington, DC, p. 77 (1998)
5. R Cucchiara, A Prati, R Vezzani, An intelligent surveillance system for dangerous situation detection in home environments. Intell Artif.1, 11–15 (2004)
6. CL Liu, CH Lee, PM Lin, A fall detection system using k-nearest neighbor classifier. Expert Syst Appl.37, 7174–7181 (2010). doi:10.1016/j. eswa.2010.04.014
7. CW Lin, ZH Ling, YC Chang, CJ Kuo, Compressed-domain fall incident detection for intelligent homecare. J VLSI Signal Process Syst.49, 393–408 (2007). doi:10.1007/s11265-007-0092-3
8. C Rougier, J Meunier, A St-Arnaud, J Rousseau, Robust video surveillance for fall detection based on human shape deformation. IEEE Trans Circuits Syst Video Technol.21, 611–622 (2011)
9. N Thome, S Miguet, S Ambellouis, A real-time, multiview fall detection system: a lhmm-based approach. IEEE Trans Circuits Syst Video Tech.18, 1522–1532 (2008)
10. A Zweng, S Zambanini, M Kampel, inProceedings of the 6th International Conference on Advances in Visual Computing–Volume Part I. ISVC’10.
Introducing a Statistical Behavior Model Into Camera-Based Fall Detection, Springer, Berlin, pp. 163–172 (2010)
11. J McKenna, N Charif, Summarising contextual activity and detecting unusual inactivity in a supportive home environment. Pattern Anal Appl.7, 386–401 (2004). doi:10.1007/s10044-004-0233-2
12. A Ali, JK Aggarwal, inIEEE Workshop on Detection and Recognition of Events in Video, vol. 0. Segmentation and Recognition of Continuous Human Activity, p. 28 (2001)
13. P Thuraga, R Chellappa, V Subrahmanian, O Udrea, Machine recognition of human activities: a survey. IEEE Trans Circuits Syst Video Technol.18, 1473–1488 (2008)
14. M Shoaib, T Elbrandt, R Dragon, J Ostermann, in4th International ICST Conference on Pervasive Computing Technologies for Healthcare 2010, Altcare: Safe Living for Elderly People, (2010)
15. C Rougier, J meunier, A St-Arnaud, J Rousseau,Video Surveillance for Fall Detection, in the book titled Video Surveillance, In-Tech Publishing University Campus STeP Ri Slavka Krautzeka 83A 51000 Rijeka Croatia. ISBN 978-953-307-436-8 (2011)
16. C Rougier, J Meunier, A St-Arnaud, J Rousseau, inProceedings of 28th Annual International Conference of the IEEE Engineering in Medicine and Biology Society, Monocular 3d Head Tracking to Detect Falls of Elderly People, (2006)
17. D Ayers, M Shah, Monitoring human behavior from video taken in an office environment. Image Vis Comput.19, 833–846 (2001). doi:10.1016/S0262-8856(01)00047-6
18. V Martin, M Thonnat, Learning Contextual Variations for Video
Segmentation, inIEEE International Conference on Computer Vision Systems (ICVS). Volume 5008 of Lecture Notes in Computer Science, ed. by Gasteratos A, Vincze M, Tsotsos JK (Springer, Berlin, 2008), pp. 464–473
19. E Maggio, A Cavallaro, Learning scene context for multiple object tracking. Trans Imge Process.18, 1873–1884 (2009)
20. M Yang, Y Wu, G Hua, Context-aware visual tracking. IEEE Trans Pattern Anal Mach Intell.31, 1195–1209 (2009)
21. G Gualdi, A Prati, R Cucchiara, Contextual information and covariance descriptors for people surveillance: an application for safety of construction workers. Eurasip J Image Video Process.2011(2011)
22. M Shoaib, R Dragon, J Ostermann, inICASSP International Conference on Acoustics, Speech and Signal Processing, Shadow Detection for Moving Humans Using Gradient-Based Background Subtraction, (2009)
23. M Shoaib, R Dragon, J Ostermann, inThe Fourth Pacific-Rim Symposium on Image and Video Technology (PSIVT2010), View-Invariant Fall Detection for Elderly in Real Home Environment, (2010)
24. BR Vatti, A generic solution to polygon clipping. Commun ACM.35, 56–63 (1992). doi:10.1145/129902.129906
25. MK Agoston,Computer Graphics and Geometric Modelling: Implementation & Algorithms, (Springer, New York, 2004)
26. R Collobert, F Sinz, J Weston, L Bottou, Large scale transductive svms. J Mach Learn Res.7, 1687–1712 (2006)
27. Jens Spher, Muhammad Shoaib, Dataset. http://www.tnt.uni-hannover.de/ staff/shoaib/fall.html (2011)
28. S Zambanini, J Machajdik, M Kampel, in10th IEEE International Conference on Information Technology and Applications in Biomedicine (ITAB), 2010, Detecting Falls at Homes Using a Network of Low-Resolution Cameras), pp. 1–4 (2010)
29. N Noury, A Fleury, P Rumeau, A Bourke, G Laighin, V Rialle, J Lundy, in
Engineering in Medicine and Biology Society, 2007. EMBS 2007. 29th Annual International Conference of the IEEE, Fall Detection–Principles and Methods), pp. 1663–1666 (2007)
doi:10.1186/1687-6180-2011-129
Cite this article as:Shoaibet al.:Context-aware visual analysis of elderly activity in a cluttered home environment.EURASIP Journal on Advances in Signal Processing20112011:129.
Shoaibet al.EURASIP Journal on Advances in Signal Processing2011,2011:129 http://asp.eurasipjournals.com/content/2011/1/129
![Table 2 Rules to find intersections between two polygons[24,25]](https://thumb-us.123doks.com/thumbv2/123dok_us/1144147.1143554/5.595.57.290.632.731/table-rules-intersections-polygons.webp)