A Multitarget Tracking Video System Based on
Fuzzy and Neuro-Fuzzy Techniques
Jes ´us Garc´ıa
Departamento de Inform´atica, Universidad Carlos III de Madrid, Avda de la Universidad Carlos III 22, Colmenarejo 28270, Spain
Email:jgherrer@inf.uc3m.es
Jos ´e M. Molina
Departamento de Inform´atica, Universidad Carlos III de Madrid, Avda de la Universidad Carlos III 22, Colmenarejo 28270, Spain
Email:molina@ia.uc3m.es
Juan A. Besada
E.T.S.I. Telecomunicaci´on, Universidad Polit´ecnica de Madrid, Ciudad Universitaria s/n, Madrid 28040, Spain Email:besada@grpss.ssr.upm.es
Javier I. Portillo
E.T.S.I. Telecomunicaci´on, Universidad Polit´ecnica de Madrid, Ciudad Universitaria s/n, Madrid 28040, Spain Email:javierp@grpss.ssr.upm.es
Received 19 December 2003; Revised 23 December 2004
Automatic surveillance of airport surface is one of the core components of advanced surface movement, guidance, and control systems (A-SMGCS). This function is in charge of the automatic detection, identification, and tracking of all interesting targets (aircraft and relevant ground vehicles) in the airport movement area. This paper presents a novel approach for object tracking based on sequences of video images. A fuzzy system has been developed to ponder update decisions both for the trajectories and shapes estimated for targets from the image regions extracted in the images. The advantages of this approach are robustness, flexi-bility in the design to adapt to different situations, and efficiency for operation in real time, avoiding combinatorial enumeration. Results obtained in representative ground operations show the system capabilities to solve complex scenarios and improve track-ing accuracy. Finally, an automatic procedure, based on neuro-fuzzy techniques, has been applied in order to obtain a set of rules from representative examples. Validation of learned system shows the capability to learn the suitable tracker decisions.
Keywords and phrases:fuzzy-knowledge-based system, neuro-fuzzy learning, video image tracking, data association.
1. INTRODUCTION
In airport areas, advanced surface movement, guidance, and control systems (A-SMGCS) [10] are conceived as new pro-cedures and technologies to support ground traffic manage-ment, increasing both safety and efficiency of traffic flow in complex, high-density airport ground scenarios. One of the core functions within A-SMGCS is surveillance, in charge of the automatic detection and tracking of all relevant tar-gets located in the airport movement area (runways, taxi-ways, and apron areas). These targets moving in the airport are generally commercial aviation aircraft and surface vehi-cles, such as fuel trucks, luggage convoys, cars, and so forth. A-SMGCS processes data from different types of sensors
to monitor all ground traffic providing controllers with a periodically updated synthetic image containing all interest-ing traffic state on the airport surface.
calculates target trajectories (local tracks) in the projected camera plane by performing two steps. First, moving targets are detected against their local background to generate de-tected pixels, connecting them later to form image regions referred to as blobs. Blobs are defined with their spatial bor-ders, generally a rectangular box, centroid location, and area. Then, the tracker must distinguish all targets in the scene and track their motion, applying association and filtering pro-cesses to blobs extracted from the processed images.
The traditional association systems use, together with motion estimation, target position (represented by cen-troids) extracted from sensor data. Conventional nearest neighbor systems [5] deal with the assignment between plots and tracks as if minimizing a global cost function. This func-tion is computed based on the distance between plots and predicted tracks (residuals) and known statistical models for sensor errors. Bayesian extensions of NN, such as multiple hypothesis tracking (MHT) [5] consider association deci-sions over several data scans to ensure track continuity under critical conditions such as presence of false alarms, maneu-vers, or closely spaced targets. These types of hard-decision systems assume basic constraints of single plot updating each track, and no more than one track updated by the same plot, which are not applicable to the problem at hard.
A possible solution could be the removal of the one-to-one constraints and the enumeration of all possible grouping and assignment hypothesis with approaches similar to that suggested in [11]. However, these types of solutions could demand excessive computation load to process the frames in real time and it would not ensure solving some problems such as the assignation of corrupted blobs resulting from the mix of several target images. As alternative, an all-neighbors approach, similar to joint probabilistic data association [5] or PMHT [12], seems adequate to this problem, since all blobs potentially gated with each track are used to update it, re-quiring besides quite lower memory and computation than MHT approaches. Other approaches apply the expectation-maximization [8] clustering algorithm for estimating the un-known correspondence among blobs and tracks. The groups of cells representing each target are modelled as a mixture of Gaussian pdf ’s of unknown parameters, so a likelihood func-tion for those parameters given the measurements are com-puted at the same time as the unknown correspondence. The application of EM algorithm transforms the hard assignment to a continuous problem, numerically solved with a “hill-climbing” approach. It has been previously applied to data association for computer vision applications [7], and for a probabilistic approach to MHT, PMHT [12].
Using a video surveillance system, an explicit represen-tation of target shape and dimensions seems more adequate than a simple position to improve the association logic in or-der to select the set of updating blobs for each track. There are many approaches for video-based tracking systems based on regions in the computer vision literature, for instance, [23,24]. Some proposals use in addition 3D models of inter-esting targets which are projected on camera plane, and then a correlation process allows model identification and extrac-tion of parameters such as posiextrac-tion or orientaextrac-tion [13,16].
However, these systems require detailed 3D models of all interesting targets, which may be difficult in heterogeneous airport scenarios, and they could be computationally expen-sive in situations with a moderate number of targets.
The approach proposed here does not take advantage of any 3D information; it uses a generic 2D model based on moving regions to represent the targets. The central prob-lem addressed is the correspondence between tracked objects and extracted regions making use of a spatial shape repre-sentation and a rule-based system. Besides, the rules also ad-dress the evolution of shape (it depends on the relative posi-tion of target with respect to camera plane), which is updated accordingly to the information received from the images se-quence.
The updating scheme should be designed considering a number of factors to overcome all the specific problems and effects with video data, in order to guarantee the stability of the tracking output. There are no detailed models or ana-lytical expressions to design this process, similar to JPDA [9] where there is full-detailed statistical model of sensor data. As an alternative, this paper presents a representation of knowl-edge in order to enhance the tracking performance. An anal-ysis of continuity performance with different strategies, de-pending on numeric heuristics describing the possible situ-ations to solve, may potentially provide robust rules to take appropriate association decisions [11].
The proposed algorithm estimates a correlation level, as-sessing the confidence given to every blob for updating every track, with a number of rules derived from experimentation. Rules can be obtained by analysis of conventional tracking systems performance under different conditions, character-ized with these heuristics values. The rules represent the suit-able actions to take under a set of particular extreme con-ditions to guarantee track continuity. Fuzzy reasoning tech-niques [19,28] may be adopted to reproduce the system be-havior under these extreme conditions, and besides gener-ate the proper output for all intermedigener-ate cases. One of the advantages of this soft approach is that it avoids combinato-rial complexity, essential to real-time operation with moder-ate frame rmoder-ates, since it removes enumeration of hypotheses, while it is flexible to include specific rules to deal with the most complex situations. The fuzzy system will compute for each blob potentially gating each track a weight to be consid-ered in the track update, so that several blobs can contribute in final estimation.
Finally, learning techniques can be potentially exploited to automatically learn and tune the proposed rule system. A machine-learning procedure (neuro-fuzzy technique) has been applied in order to extract rules directly from examples, analyzing the capability to provide right decisions in different conditions.
The rest of paper is organized as follows. In the next sec-tion, the particular association problems in this type of appli-cation are summarized and taken as the objective of design.
Section 3presents the representation of target shape and the
Blobs
Figure1: Blob-to-track association problem.
parameters is presented in Section 4, including the learn-ing approach based on a neuro-fuzzy technique. Section 5 is dedicated to evaluation, and the system output in several scenarios is analyzed indicating the response for complex sit-uations with real image sequences of representative ground operations. The end of this section is related with the ap-plication of the learning method and the evaluation of the learned rules. Finally, some conclusions and future work are presented inSection 6.
2. THE MULTITARGET TRACKING PROBLEM IN VIDEO SURVEILLANCE SYSTEMS
As mentioned above, the design of a multitarget tracking sys-tem must address the data association logic [5], which is the focus of interest in this case of video data processing. Its de-sign must take into account the characteristics and quality of data resulting from the detection subsystem. In this case, data are the blobs resulting from the detection subsystem applied on image sequences of airport surface scenes.
Figure 1shows an example where a single target (an
air-craft) is the source for five blobs separated from the back-ground. When processing video output in dense airport ar-eas, each available frame presents a set of blob-to-track mul-tiassignment problems to be solved, where several (or none) blobs may be assigned to the same track and simultaneously several tracks could overlap and share common blobs.
So the association problem to solve is the decision of the most proper grouping of blobs and assignation to each track for each frame processed. The characteristics of data to be processed, blobs detected in image sequences of air-port surface areas, have been taken into account to develop the image-based tracking system. Due to image irregularities, shadows, occlusions, and so forth, a first problem of imper-fect image segmentation appears resulting in multiple blobs potentially generated for a single target. This splitting effect occurs with extraneous surface objects such as luggage con-voys, or presence of irregular shadows, and especially when obstacles or other targets appear between the interest target and camera. So, blobs must be reconnected before track as-signment and updating. This problem might be easily solved in single-target scenarios using a blob-grouping algorithm based on the blobs associated to the track in previous frames, defining a spatial gate for each track. However, when multi-ple targets move closely spaced, their image regions interact and overlap causing some targets to appear occluded by other
xmin Gated blobs xmax
ˆ
xp lˆH
ymin
ymax
ˆ lV
ˆ yp
∆H
Inner target gate
Outer target gate
∆v
Track-state vector (predicted)
Figure2: Target segmentation with estimated box.
targets or obstacles, so that some blobs can be shared by dif-ferent tracks. So, a blob-to-track multiassignment problem has to be solved, where several blobs could be assigned to the same track and simultaneously several tracks could overlap and share common blobs. The key trade-offto be considered in the system performance can be summarized in the follow-ing two aspects, which represent conflictfollow-ing requirements:
(1) it must group the different blobs representing a single target to avoid track-splitting effects. Grouping must adapt to gradual variations in targets sizes and shapes due to changes in distances and orientations of targets; (2) when different targets approach one another, it should avoid mixing their close image regions since their tracks can be wrongly updated or even one of them discarded resulting in an erroneous single track in-cluding more than one target.
Besides, the case of no plot updating the track (track pre-dicted) is also weighted and included to generate the final pseudomeasure to update the track. If more than one blob is within track gate, their centroids are combined after, using their areas as weighing factors to finally update the track.
Finally, a recursive filter is used to update both centroid position and velocity for each track from the sequence of as-signed values, by means of a decoupled Kalman filter for each Cartesian coordinate, with a piecewise constant white accel-eration model [5]. So, the association of blobs to tracks de-termines the evolution of tracks representing the targets. The logic included in the fuzzy system is mainly intended to keep tracks continuity in real conditions.
3. REPRESENTATION OF TARGETS SHAPES AND ASSOCIATION HEURISTICS
Overlap 50% Overlap 100% Overlap 0% Predicted track
Blobs Inner correlation region
Outer correlation region
Figure3: Overlapping degree heuristic.
For the sake of simplicity, a rectangular box has been used to represent the target, as indicated inFigure 2. Around the predicted position, ( ˆxp, ˆyp), a rectangular box is defined, (xmin,xmax,ymin,ymax), with the estimated target dimensions (ˆlH, ˆlV). Then, an outer gate, computed with parameters∆H, ∆V, is used to finally gate the potential blobs updating the track estimates.
This outer gate allows the system to track dynamic vari-ations in target shape along the sequence for targets not perfectly matching the predictions due to variations in pro-jected shape (changes of orientation, distance, etc.), or ma-neuvers. Besides, it avoids the initialization of tracks around existing ones, potential source of instabilities. The process of shape update with new information should reach a trade-off between the conflicting requirements presented in previous section: it must reconnect the different blobs representing a single target to avoid track-splitting effects and, when dif-ferent targets approach one another, it should avoid group-ing their image regions since their tracks could be wrongly updated. So, the shape must be dynamically updated with the information contained in blobs, but the changes must be smooth, avoiding instabilities in scenarios with closely spaced targets.
The final weight of gated blobs in the update phase should take into account the aspects mentioned before. Al-though there is not any closed expression doing that, sim-ilar to statistical residuals, some numeric heuristics, com-puted with simple geometrical analysis of blobs and pre-dicted tracks, have shown to provide helpful indications to be considered. They can be used to asses the confidence given to each blob after it is included into a certain group, and also to assess confidence in predicted track. They were detailed in [11], and are summarized as follows.
(1)Overlapping heuristic: this component can be seen as a “soft gating,” computed as the fraction of blob area con-tained within track-predicted region. Maximum value, 1, is given when blob is completely included within an inner track-predicted gate, and minimum, 0, when blob is out of an outer track region (seeFigure 3). Both regions for each track allow adaptive grouping for targets not perfectly matching
Ix
IY
Pseudoblob Area 1
Area 3
Area 2 Blob 1
Blob 2 Centroids
Figure4: Group density after blob reconnection.
Track 2 Conflict-free
blobs Track 1 Blob in conflict
Figure5: Blob in assignment conflict with two tracks.
predictions due to variations in projected shape (changes of orientation, distance, etc.), or maneuvers.
(2)Group density and distance to track: this heuristic,ρ, evaluates the ratio between areas of detected regions and nondetected zones (holes) in the box enclosing the finally re-connected pseudoblob (seeFigure 4).ρ=iAreai/(lxly). So, in the case that the blobs grouped are very scattered, a low value ofρwill indicate that different targets probably have originated them.
To do that, a criterion based in the distance to track is used to finally compute this heuristic whose values fall from 1, when distance is zero, toρ, for the most separated blobs, so that they would be practically discarded when density is low. (3)Conflict with other tracks: this component evaluates the likelihood of blob being in conflict with other tracks. This problem appears when target trajectories are so close that track gates get overlapped and share the blob, as depicted in
Figure 5.
Evaluation of blob conflict degree is completely equiva-lent to the first heuristic, overlapping, but computed with the other existing tracks. In the case that more than one track are in conflict, the maximum overlapping degree is selected.
(4)Proximity to image borders: finally, image borders are the areas where tracks are usually initialized, and so they are transient areas where tracks are not stabilized yet. This num-ber evaluates if the blob is close to any of the four image bor-ders.
blob before track update. Additionally, the predicted track may be also characterized with some heuristics, indicating the confidence given to the fact that this track represents mo-tion of a real target. These track heuristics detect when it may be deviating from the real trajectory.
(i) Number of missed updates: it is the number of consec-utive frames where no blob was included into track in-ner gate.
(ii) Track detected area: conversely to blob overlapping heuristic, it is the proportion of area, within predicted inner gate, filled with blobs detected in current frame. (iii) Proximity to image borders: this value is equivalent to
the one computed for blobs.
4. FUZZY SYSTEM FOR UPDATING TARGETS SHAPES
Heuristics defined above are the input to unknown relations computing the confidence levels both for blobs and predicted tracks in the update process. A rules system based on fuzzy logic has been developed in order to approximate these rela-tions. The first step to build this system should be the selec-tion of adequate descripselec-tions of heuristics and rules relating them with the outputs: confidence levels for blobs and pre-dictions. The inputs (heuristic values) are translated into lin-guistic variables. Using these concepts, for heuristichi, a lin-guistic variableLhiis introduced together with its set of val-ues{lhi1,lhi2,. . .,lhimi}, whose cardinality ismi. Each term
lhij in the set, labels a fuzzy subset in the universe of dis-courseHi, with membership functionµlhij(hi). A fuzzy
rela-tional algorithm (FRA) will store the knowledge required to obtain the final confidence level, CONF, both for blobs and tracks involved in each decision. It is composed of a finite set of fuzzy conditional statements of the form IF{Lhiislhij} THEN{LCONF islαk}, where LCONF is a linguistic variable representing blobs or track confidence levels, with a set of possible values{lα1,. . .,lαn}. The Mamdani implication [17] has been chosen. Finally,αis the defuzzification of LCONF, and CONF represents its numerical domain (universe of dis-course of LCONF). The adopted defuzzification process on LCONF will be a modified version of the center of gravity procedure [29].
Target’s estimated shape will vary very smoothly, accord-ingly to confidence levels of gated blobs. The estimated po-sition (measured centroid to update track vector) will de-pend both on these blobs confidence levels,αbi, and on pre-dicted track confidence,αp, in order to avoid losing tracks when they deviate from real trajectory. So, estimated shape (dimensions of box) is the most constrained feature, remain-ing “locked” while the blobs confidence levels are not high enough, while estimated position (where the bounding box is located) will be a trade-offbetween confidence levels esti-mated both for blobs and tracks.
With the rectangular simplification considered, only two shape parameters are estimated: length, width (ˆlH, ˆlV). If we consider horizontal coordinate, the two gated blobs with the minimum and maximum extremes for coordinate x,
(xbmin,xbmax) are taken into account. Denoting their as-sociated confidence levels, computed by fuzzy system, as α1H,α2H, the minimum and maximum values are obtained: αminH=min[α1H,α2H];αmaxH=max[α1H,α2H].
First, the target horizontal length is updated considering the minimum blob confidence value,αminH:
ˆ
lH[k]=αminH
xbmax−xbmin
+1−αminH ˆ
lH[k−1]. (1)
So, the estimated target length will be modified only in the case where both blobs have enough confidence. Then, the estimated target bounds (location of box) are updated from the blob with the highest confidence, αmaxH, considering also the value for track confidence,αp. It is required thatαp reaches a minimum threshold,Tp, to weight the track predic-tion with the blob having highest confidence. In other case, track prediction is discarded, and box is positioned aligned with the best blob, in order to avoid track lost when de-viation between predictions and detected regions increases. For instance, if left-hand side blob defining valuexbminhad the highest confidence, the estimated target bounds would be updated as follows.
(i) αp> Tp:
ˆ
xmin[k]=αmaxHxbmin +1−αmaxH
ˆ
xmin[k−1] + ˆvx[k−1]T,
ˆ
xmax[k]=xˆmin[k] + ˆlH[k].
(2)
(ii) αp< Tp:
ˆ
xmin[k]=xbmin,
ˆ
xmax[k]=xˆmin[k] + ˆlH[k]. (3)
( ˆxmin[k−1], ˆxmax[k−1]) are the horizontal bounds in last update, ˆvx[k−1] the horizontal velocity estimated by track-ing filter, ˆlH[k] the value computed in (1), andT the time elapsed.Tpis the threshold on track confidence. Similar con-siderations are made for the other possible case (right-hand blob) and for the vertical dimension update.
Figure 6shows an example of track shape update with
two targets overlapping, and performing maneuvers (track 1 represents a target accelerating and track 2 decelerating). Due to the conflicting blob, dimensions of both tracks re-main locked in this frame, but bounds are computed to con-form to the conflict-free blobs (with high confidence levels for association). So, the biases produced by maneuvers are corrected.
Finally, the measured target centroid used to update the estimated track vector is extracted from the set of blobs gated in the updated track contour, after applying the logic ex-plained above to generate target bounds. To do that, only the portion of blobs within the track box are considered, and they are weighted with their areas,xa=ixiAi, as indicated
Track 2 (predicted)
Conflict-free blobs Track 1 (predicted)
Blob in conflict
Track 2 (updated)
Track 1 (updated)
Figure6: Shape update with conflicts and maneuvers.
ˆ lH
ˆ lV
Pseudoblob Area 1
Area 3
Area 2 Blob 1
Blob 2
Blob 3
Pseudoblob centroidxa
Gated blobs centroids
Figure7: Centroid computation.
0 0.1 0.2 0.3 0.4 0.5 0.6 0.7 0.8 0.9 1 0
1 S M L
Overlap
Overlap input
M
embership
function
Figure8: Membership function for overlap input.
The first implemented system had the seven inputs men-tioned (overlap, density, conflict, border, track misses, track overlap, and track border) and two outputs, correlation level for blob,αb, and track weight,αp. Each linguistic variable was
0 0.1 0.2 0.3 0.4 0.5 0.6 0.7 0.8 0.9 1 0
1 S M L
Correlation
Correlation output
M
embership
function
Figure9: Membership function for blob correlation output.
defined with three fuzzy sets: small (S), medium (M), and large (L). The membership function for them is indicated in
Figure 8, common for all inputs, andFigure 9, for outputαb.
The rules were the following:
(i) overlap is small=>correlation is small, (ii) density is small=>correlation is small, (iii) conflict is large=>correlation is small, (iv) conflict is medium=>correlation is small,
(v) (overlap is medium), (density is medium), and (con-flict is small)=>correlation is medium,
(vi) (overlap is medium), (density is large), and (conflict is small)=>correlation is medium,
(vii) (overlap is large), (density is medium), and (conflict is small)=>correlation is medium,
(viii) (overlap is large), (density is large), and (conflict is small)=>correlation is large,
(ix) border is large=>correlation is large.
This first system was manually set by analysis of tracking per-formance. Next, a data analysis was performed to automati-cally tune the fuzzy sets and rules, as indicated next.
4.1. Rule extraction using neuro-fuzzy techniques An automatic learning procedure could be applied as an al-ternative to the manual derivation of the fuzzy rules from the expert knowledge, or to tune the labels’ membership functions of linguistic variables used to represent the knowl-edge. Although many proposals have been developed based on neural networks [6] or in genetic algorithms [18], the fuzzy systems with learning techniques based on neural net-works show mathematical consistence and have been applied profusely in many applications [14].
Two approaches of neuro-fuzzy systems exist. The first type uses differentiable operators in the fuzzy system to apply gradient descent procedures. These systems, such as ANFIS or GARIC, generate fuzzy systems that are not easy to inter-pret. The ANFIS model by Jang [15] implements a Sugeno-like fuzzy system [26] in a network structure, and applies a mixture of backpropagation and least-mean-square proce-dure to train the system. The GARIC model [2] uses a special “soft minimum” function which is differentiable.
The second type of neuro-fuzzy system uses max-min operators and the learning procedure is heuristic, these sys-tems are easy to interpret as the syssys-tems developed by Nauck and Kruse: NEFCLAS [20] and NEFCON [21]. The neuro-fuzzy system developed by Nauck and Kruse learns a neuro-fuzzy system in several steps. In the first place, it builds the fuzzy rule base using a labeled data set and a fuzzy classifier. Each fuzzy rule is a multidimensional fuzzy set covering a hyper-box in the data space. The membership degree of a cluster is the degree in which an individual pattern belongs to the clus-ter. The second step, starting with the learned rules (learned clusters), is the refinement of the membership functions to adjust the membership degree to the data set. This algorithm depends on the shape of the membership function (in the available software NECFLASS there are triangles, trapezoids, and bell-shaped functions). Finally, the last step is used to prune the fuzzy rule base. The pruning algorithm reduces the number of rules selecting the best rules and deleting the re-dundant ones.
The idea of the learning algorithm, see [22], is to create a rule base first and then to refine it by modifying the initially given membership functions (usually fuzzy partitions of in-put and outin-put variables). The rule base is created by finding for each pattern in the training set a rule that best classifies it. If a rule with an identical antecedent is not already in the rule base, it will be added. The learning algorithm of the mem-bership functions uses the output error that tells whether the degree of fulfillment of a rule has to be higher or lower. This information is used to change the input fuzzy sets by shifting the membership functions and making their supports larger or smaller. There are defined different shapes for fuzzy mem-berships (triangles, bells, etc.), and all of them can be easily modified with parameters. Constraints are defined here for the learning procedure (fuzzy sets must not pass each other or that they must intersect at 0.5, etc.), in order to obtain an interpretable rule base. After the rule learning algorithm has terminated, the predefined fuzzy partitioning on both input variables defines a partitioning of the input space created by overlapping hyperboxes where each hyper-box is formed by the Cartesian product of the supports of the defined fuzzy sets (the number of sets is predefined). Each hyper-box rep-resents the support of an n-dimensional fuzzy set which is the antecedent of a fuzzy rule.
The fuzzy sets are trained by a backpropagation-like al-gorithm, the error is propagated from the output units to-wards the input units and is used to change the membership function parameters, but there is no gradient information in-volved. The adaptivity of an NEFCLASS system is restricted because of the initially given input fuzzy partitions, which
define the form and maximal number of clusters, and by the constraints that do not admit certain changes in the fuzzy sets.
Finally, to interpret a fuzzy rule base it is important that there are as few rules as possible and that superfluous vari-ables are not used in the rules. NEFCLASS defines pruning techniques to improve the rule base automatically. Besides, each of these pruning strategies can be interactively applied by the user with a graphical rule editor. Some of the strategies are related to rule evaluation (the rule learning procedure is invoked to keep only the best krules) or to input deletion (the correlations of the input variables with the class infor-mation are computed in order to remove input variables with the worst correlation to the output).
In this paper, the fuzzy system for association used Mam-dani implication [17] because the fuzzy system interpolates a generic function (the association function) without ana-lytical expression. The Nauck/Kruse neuro-fuzzy approach was applied because it uses directly this type of implication and the method was developed for this type of fuzzy system. The goal of learning here was the suitable decision for each blob association to each track under different situations. The heuristic descriptors presented inSection 3are used as input variables and the right decision, among three possibilities, is the available output, so it is a supervised learning. The de-tails of learning process and the results about the capability of generalization from examples in this application are pre-sented at the end of following section.
5. EXPERIMENTS AND PERFORMANCE RESULTS
This section presents some results about the performance of the developed video tracking system with real data from some sample scenarios. The evaluation of video tracking sys-tems is an important aspect since it may require plenty of effort, especially when manual generation of ground truth is done. There are different approaches for performance as-sessing in the literature. The most direct is using manual mark-up of all samples, obtaining the “ideal” segmentation of all interesting targets from the background; there are avail-able standard video sequences for test containing the ground truth, such as the PETS (performance evaluation of track-ing systems) collections [23]. Other approaches make use of synthetic data or hybrid combinations of synthetic and real samples, such as [1,4,25].
(a)
(b)
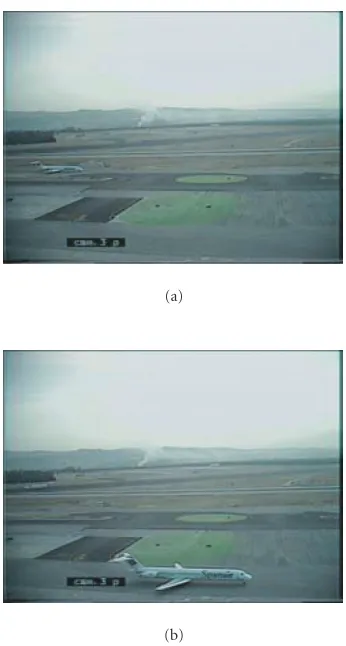
Figure10: Single-target scenario 1. (a)t=15 and (b)t=124.
Finally, the section is closed presenting the automatic learn-ing of association rules from data with a neuro-fuzzy model, and assessing the quality of learning in terms of generaliza-tion.
5.1. Continuity
First, the tracking output (estimated targets shape and cine-matics) is presented for some representative scenarios, where the fuzzy association rules solved the most representative types of problems that can appear in the airport area. In all cases, blobs resulting from segmentation are always rep-resented by dashed rectangles, with centroid location indi-cated with a circle. Tracks, predicted to the time instants of blobs detections, are represented by asterisks, vector veloc-ity, and a solid rectangular target contour (inner correlation gate). Axis units are image pixels, and the time units are the frame numbers, with an average rate of 3 frames per sec-ond.
5.1.1. Scenario 1: single-target scenario
This situation has an aircraft detected, without other close targets, which performs a double turn to change the taxiway in which it is moving. InFigure 10, there are pictures for time
instants before and after the maneuver. System output in six time instants is presented inFigure 11. The shape and area are continuously adapted to target dynamic evolution, and fragmented blobs are correctly reconnected, with maximum confidence levels.
5.1.2. Scenario 2: conflicts with two targets, no maneuvers
In this case, two aircrafts are moving in parallel taxiways and, due to the low depression angle, their images get mixed when they cross (Figure 12). System output in four represen-tative time instants is presented in Figure 13. While targets are close, detection system extracts a single blob for two tar-gets (t = 47,t = 49). The confidence level is lowered due to the conflict heuristic, and tracks shape and velocities are not affected during this interval. Int = 50, conflict degree is lower, confidence increases, and tracks are again updated with blobs.
5.1.3. Scenario 3: conflicts and occlusions
In this case, Figure 14 presents a situation where two ef-fects, track conflicts and splits, due to occlusions, appear. A luggage convoy is partially occluded by an aircraft tail, and at the same time a high-speed van is moving in oppo-site direction. As shown in Figure 15, in time instants 113, 118, two blobs appear (indicated with discontinuous boxes), one as result of partial occlusion, and other in conflict with both tracks. Tracks shapes and locations are updated with blobs accordingly to confidence levels given basically by con-flict degree, so the situation is correctly solved (tracks are displayed with continuous boxes and velocity vector super-posed).
5.1.4. Scenario 4: conflicts and occlusions
In Figure 16, a multiple blob reconnection scenario is
de-picted. There is an aircraft moving from right to left, with oc-clusions due to a stopped bus and an aircraft located in front. As a consequence, multiple blobs representing different parts of aircraft and its shadow appear (seeFigure 17, blobs are the discontinuous boxes with circles), and those are connected to update the aircraft track, without track-splitting effects. There are two continuous boxes representing the tracks for the aircraft and for an upper vehicle moving in a parallel in-ner taxiway, and the conflicts due to interactions when blobs are overlapped are correctly solved.
5.1.5. Scenario 5: conflicts and maneuvers
0 50 100 150 200 250 300 350 400 0
50 100 150 200 250
(a)
0 50 100 150 200 250 300 350 400
0 50 100 150 200 250 300
(b)
0 50 100 150 200 250 300 350 400
0 50 100 150 200 250 300
(c)
0 50 100 150 200 250 300 350 400
0 50 100 150 200 250 300
(d)
0 50 100 150 200 250 300 350 400
0 50 100 150 200 250
(e)
150 200 250 300 350 400 450 500 550 0
50 100 150 200
(f)
Figure11: Shape evolution with single-target scenario 1: (a)t=15, (b)t=50, (c)t=75, (d)t=100, (e)t=116, and (f)t=124.
Figure12: Constant-speed track conflict in scenario 2.
mix image regions from the two targets. In frame 90, due to conflict, a single discontinuous box melts the two aircrafts. The fuzzy system successfully avoids updating with the cor-rupted blobs and, as soon as targets separate (from frame 109 on) tracks (continuous boxes) are gradually updated to fol-low their respective trajectories.
5.1.6. Scenario 6: conflicts and maneuvers
150 200 250 300 350 120
140 160 180 200 220 240 260 280 300
(a)
100 150 200 250 300
140 160 180 200 220 240 260 280 300 320
(b)
100 150 200 250 300 350
120 140 160 180 200 220 240 260 280 300 320
(c)
100 150 200 250 300
120 140 160 180 200 220 240 260 280 300 320
(d)
Figure13: Shapes with a two-target conflict and constant velocity, scenario 2: (a)t=44, (b)t=47, (c)t=49, and (d)t=50.
Figure14: Track conflict and occlusion in scenario 3.
a deceleration maneuver. A van (white) and a vehicle move from left to right, and another vehicle is moving from right to left. As depicted inFigure 20, images from three vehicles overlap when the first vehicle moving from left to right stops in front of the aircraft.Figure 21indicates some of the most important time instants, the blobs extracted by detector, and the tracks updated accordingly to the rules activated.
5.2. Accuracy
Here some comparative results about accuracy in two scenar-ios are presented, comparing the fuzzy system with an ad-hoc system with hard-decisions for association.
(i) Update with all blobs included in the gate if group den-sity is higher than 0.7. Otherwise, remove the farthest blobs from the group.
(ii) If two or more tracks share any conflictive blobs, pre-dict them without update.
350 400 450 500 550 600 650 150
200 250 300
(a)
450 500 550 600
140 160 180 200 220 240 260 280 300
(b)
350 400 450 500 550 600
150 200 250 300
(c)
400 450 500 550 600 650 700
100 150 200 250 300
(d)
Figure15: Output with reconnections and conflicts, scenario 3: (a)t=116, (b)t=113, (c)t=118, and (d)t=120.
Figure16: Target splitting in scenario 4.
Errors in scenario 4
First, the trajectory estimated for the aircraft in the 4th scenario above has been used to compare both systems.
200 250 300 350 400 450 500 550 600 100
150 200 250 300 350
(a)
150 200 250 300 350 400 450 500 550 150
200 250 300 350 400
(b)
150 200 250 300 350 400 450 500
150 200 250 300 350
(c)
150 200 250 300 350 400 450 500 150
200 250 300 350
(d)
Figure17: Blob reconnection with scenario 4: (a)t=89, (b)t=96, (c)t=99, and (d)t=102.
Figure18: Low-density blob grouping and maneuvers in scenario 5.
in vertical accuracy appears with the new system, due to the fact that this track is more stable now, after integrating the fuzzy combination of blobs to be grouped.
Errors in scenario 5
In that scenario two aircrafts cross and their images get mixed with association conflicts for an interval of 25 frames (frames 90 to 113). In frame 95, where an aircraft is clearly occluded by another, fuzzy system successfully avoids update with cor-rupted blobs due to conflict, (frame 101), but as soon as
targets separate (from frame 105), tracks are gradually up-dated to follow the trajectory. The output of both systems is displayed in Figure 25. The rigid system with extrapola-tion during conflicts clearly separates from real trajectory, due to maneuver during the conflict interval. This fact is il-lustrated in Figure 26, depicting the horizontal and vertical residuals with both systems (fuzzy with solid line, and pre-vious one with dashed). In this case with maneuver it is not applicable using a linear approximation of trajectory, and so the residuals (difference between blobs centroids and track predictions) have been shown for evaluation.
5.3. Rules extraction with neuro-fuzzy techniques
260 280 300 320 340 360 380 400 420 440 460 360
380 400 420 440 460 480 500
(a)
260 280 300 320 340 360 380 400 420 440 460 360
380 400 420 440 460 480 500
(b)
240 260 280 300 320 340 360 380 400 420 360
380 400 420 440 460 480 500
(c)
200 250 300 350 400 450
350 400 450 500
(d)
Figure19: Shape evolution with scenario 5: (a)t=86, (b)t=90, (c)t=109, and (d)t=118.
(a) (b)
(c) (d)
80 100 120 140 160 180 200 220 240 260 300
350 400
(a)
120 130 140 150 160 170 180 190 200 210 330
340 350 360 370 380 390 400
(b)
130 140 150 160 170 180 190 200 210 220 230 330
340 350 360 370 380 390 400
(c)
80 100 120 140 160 180 200 220 240 260 300
320 340 360 380 400 420
(d)
Figure21: Tracker output in scenario 6: (a)t=29, (b)t=35, (c)t=42, and (d)t=55.
60 70 80 90 100 110 120
Frames (0.3 s) 100
200 300 400 500 600 700 800
Fuzzy system Previous system
LS approximated trajectory
Estimat
ed
X,
Y
co
or
dinat
es
(pix
els)
Figure22: Estimated and approximated trajectories for track 18.
high. So, for each detected blob located around the target bounds (predicted by the tracking system), the three possible
60 70 80 90 100 110 120
Frames (0.3 s)
RMS
er
ro
r
0 1 2 3 4 5 6 7 8 9
RMS with fuzzy system 1.95% RMS with previous system 2.52%
Figure23: Horizontal error with respect to straight line.
60 70 80 90 100 110 120 Frames (0.3 s)
RMS
er
ro
r
RMS with fuzzy system 1.87% RMS with previous system 2.89% 0
1 2 3 4 5 6 7
Figure24: Vertical error with respect to straight line.
70 80 90 100 110 120 130 140 150 Frames (0.3 s)
136 138 140 142 144 146 148 150 152 154 156
Fuzzy system Previous system
Estimat
ed
Y
(pix
els)
Figure25: EstimatedYcoordinate with both systems in scenario 5.
is reliable and only referred to the represented target; dis-card the blob (disdis-card), if it clearly comes from a different source; or partially update the track (low), when the blob has information about target but it is corrupted by effects such as occlusion or overlapping. The learning process then obtained a “synthetic” fuzzy system connecting these labels with the heuristics variables describing different situations. The three selected scenarios used to do that were the follow-ing.
(i) Scenario 2. Pairs of aircraft moving in parallel taxi-ways, with their images getting overlapped when they cross. The confidence level of blobs in such situations must be lowered to avoid degradation of estimated shape and kinematics of targets.
(ii) Scenario 4. Multiple blob reconnections. An aircraft is moving behind stopped vehicles and aircraft, which occlude it while other vehicles move in close parallel roads. Multiple blobs representing different parts of
20 40 60 80 100 120 140 160 180
Frames (0.3 s)
RMS
er
ro
r
0 5 10 15 20 25 30 35
Fuzzy system Previous system
(a)
20 40 60 80 100 120 140 160 180
Frames (0.3 s)
RMS
er
ro
r
0 2 4 6 8 10 12 14 16 18
Fuzzy system Previous system
(b)
Figure26: Residuals of both tracking systems in scenario 5: (a) hor-izontal residual (%) and (b) vertical residual (%).
aircraft and its shadow appear. These blobs must be grouped to update the aircraft track, avoiding split-ting effects. Besides, images from other vehicles must be kept separated guaranteeing track continuity for all targets.
(iii) Scenario 6. Three vehicles were moving on a road, approaching one another until their images overlap, while at the same time one of them performs a decel-eration maneuver.
(i) If overlap T is large, density is medium, proximity is large, conflict is small, border is small, and overlap I is large, then high.
(ii) If overlap T is large, density is large, proximity is large, conflict is small, border is small, and overlap I is large, then high.
(iii) If overlap T is large, density is medium, proximity is large, conflict is small, border is medium, and overlap I is large, then high.
(iv) If overlap T is large, density is large, proximity is large, conflict is small, border is medium, and overlap I is large, then high.
(v) If overlap T is small, density is large, proximity is large, conflict is large, border is small, and overlap I is large, then discard.
(vi) If overlap T is small, density is medium, proximity is medium, conflict is medium, border is small, and overlap I is large, then discard.
(vii) If overlap T is small, density is medium, proximity is medium, conflict is large, border is medium, and overlap I is large, then discard.
(viii) If overlap T is small, density is medium, proximity is medium, conflict is large, border is small, and overlap I is large, then discard.
Figure27: Rules automatically obtained.
Table1: Accuracy of rules generated with different subsets of data.
Test
Training S2 (22–43)
S2 (44–52)
S2 (53–88)
S4 (61–67)
S4 (72–137)
S4 (115–120)
S6 (40–63)
S6 (64–85)
S6 (86–111)
S6
(112–136) All
S2 (22–43) — 36.7 89.5 33.3 91.6 28 88.2 48.4 46.2 73.8 61.9
— 43.3 94.7 53.3 99 44 94.1 60.5 65.1 100 76
S2 (44–52) 100 — 94.7 63.3 92.6 56 88.2 68.6 63.9 73.8 76.2
93.5 — 81.6 63.3 74.7 64 79.4 67.7 60.3 70.2 70.2
S2 (53–88) 100 83.3 — 73.3 92.6 68 91.2 76.6 69.2 76.2 78.8
100 86.7 — 86.7 100 84 94.1 96.8 94.7 100 95.7
S4 (61–67) 100 83.3 94.7 — 94.7 56 91.2 74.2 70.4 77.4 80.7
96.8 90 96.1 — 84.2 80 82.4 67.7 74.6 96.4 81.2
S4 (72–137) 100 43.3 89.5 33.3 — 28 88.2 50 50.3 94.1 63.9
100 43.3 94.7 53.3 — 44 94.1 60.5 65.1 100 73.7
S4 (115–120) 100 83.3 94.7 63.3 94.7 — 91.2 85.8 73.4 75 83.4
100 86.7 96.1 76.7 92.6 — 91.2 95.1 89.4 73.8 89.6
S6 (40–63) 100 43.3 94.7 43.3 93.7 28 — 53.2 53.3 77.4 67.2
100 43.3 94.7 53.3 99 44 — 60.5 65.1 100 76.2
S6 (64–85) 100 83.3 100 73.3 92.6 60 91.2 — 75.7 77.4 83.8
100 86.7 100 86.7 96.8 84 94.1 — 91.7 85.7 92.5
S6 (86–111) 100 83.3 94.7 63.3 94.7 72 91.2 84.7 — 75 85.8
100 86.7 100 86.7 99 76 94.1 96 — 100 95.9
S6 (112–136) 100 43.3 94.7 43.3 93.7 28 94.1 55.7 56.8 — 68.7
100 43.3 94.7 53.3 99 44 94.1 60.5 65.1 — 73.9
Repres. 1 100 — — 63.3 94.7 68 91.2 — 75.2 75 80.8
100 — — 76.7 100 84 97.1 — 94.1 97.6 94.9
Repres. 2 — 100 94.7 — 94.7 72 91.2 87.1 — 76.9 88.4
— 86.7 100 — 96.8 84 97.1 97.6 — 83.3 93.8
All — — — — — — — — — — 84.1
— — — — — — — — — — 93.3
No. instances 31 30 76 30 95 25 34 124 169 85 699
We can compare these rules with the ones directly set to represent the “expert knowledge” in Section 4 and no-tice their similarities. As it can be seen, the most important attributes to classify blobs are again conflict degree and
into ten groups, depending on the characteristics of each se-quence (segments without conflicts, segments with occlu-sions, with bad segmentations, etc.). These sets are summa-rized next.
(i) S2 (22–43), S2 (53–88): frames intervals of scenario 2 containing separated targets.
(ii) S2 (44–52): frames interval of scenario 2 containing conflicts with several interacting targets (crosses). (iii) S4 (61–67), S4 (115–120): frames intervals of scenario
4 with no interactions.
(iv) S4 (72–137): frames interval of scenario 4 containing a target with reconnections due to background occlu-sions and interactions with a second target (vehicle). (v) S6 (40–63), S4 (86–111): frames intervals of scenario 6
with interactions and occlusions.
(vi) S6 (64–85), S6 (112–136): frames interval of scenario 6 containing separated targets.
(vii) All: all frames available.
The training and evaluation process was performed with different scenarios to obtain the rate of instances correctly predicted in order to assess the ability to “generalize” suit-able rules from sets of data representing different situations. The results are depicted inTable 1. Two types of fuzzy sets were selected to represent the concepts: triangular and bell-shaped, whose performances are indicated at the top and bottom, respectively, of each cell. From the results, the learn-ing capability is generally better when bell-shaped functions are applied. The main diagonal is blank since the test was al-ways performed with data different from training, in order to avoid over-fitting in the results. Final column has the mean performance for each training set applied to the rest of avail-able data. The worst results were obtained when data from simple segments without problems were used for training. For instance, intervals S2 (22–43) and S2 (53–88) from sce-nario 2 containing only separated targets.
It is interesting to notice the “specialization” effect ap-pearing when the rules obtained for each scenario obtain bet-ter results than those generated from other ones (although with different data sets than training), but worse in the rest. The rows “representative 1” and “representative 2” are from data samples containing a sample of conflictive situations in scenarios 1 and 2, with overlap, occlusions, and splits. The training with a “sufficient” sample of different situations ob-tained the best results. Finally, the row “all” represents the re-sult obtained with a random sampling for training and val-idation complementary sets, applying cross valval-idation, very similar to the best result. In fact, both sets resulted in sets of rules very similar to the one generated with all available data.
6. CONCLUSIONS AND FUTURE WORK
Fuzzy reasoning has been successfully applied to effectively solve the core problem of data association for video track-ing under complex, high-density conditions. Specific domain knowledge is represented as a set of rules to adapt association decisions as a function of several heuristics inferred from ex-perimentation. This approach allowed a robust and flexible
design to cope with different situations and at the same time guarantee real-time operation with an efficient computation load, avoiding combinatorial enumeration as in other ap-proaches. Results obtained in representative ground opera-tions illustrate the system capabilities to solve complex sce-narios and improve tracking accuracy, with a satisfactory trade-offbetween system performance and computation ef-ficiency. Future works will extend evaluation on more sam-ples and make use of ground truth data. Finally, an auto-matic procedure, based on neuro-fuzzy techniques, has been applied in order to obtain a set of rules from representa-tive examples showing that the domain is susceptible to ap-ply machine-learning techniques to tune its design, in this case, to refine the rules to decide the appropriate associations. The evaluation assessed the capability to decide the appropri-ate labels for each blob. A thorough evaluation with ground truth will measure the capability of learning processes to im-prove the accuracy and continuity performance of a given design of tracker, and this is also left for future work.
ACKNOWLEDGMENT
This work is funded by the Spanish CICYT (TIC2002-04491-C02-02).
REFERENCES
[1] G. Appenzeller and J. L. Crowley, “Experimental performance characterization of adaptive filters,” inProc. IEEE 13th Inter-national Conference on Pattern Recognition (ICPR ’96), vol. 2, pp. 417–421, Vienna, Austria, August 1996.
[2] H. R. Berenji and P. Khedkar, “Learning and tuning fuzzy logic controllers through reinforcements,”IEEE Trans. Neural Networks, vol. 3, no. 5, pp. 724–740, 1992.
[3] J. A. Besada, J. Portillo, J. Garc´ıa, and J. M. Molina, “Image-Based automatic surveillance for airport surface,” inProc. 4th International Conference on Information Fusion (FUSION ’01), pp. 11–18, Montreal, Quebec, Canada, August 2001. [4] J. Black, T. Ellis, and P. L. Rosin, “A novel method for video
tracking performance evaluation,” inProc. Joint IEEE Interna-tional Workshop on Visual Surveillance and Performance Evalu-ation of Tracking and Surveillance (VS-PETS ’03), pp. 125–132, Nice, France, October 2003.
[5] S. Blackman and R. Popoli, Design and Analysis of Modern Tracking Systems, Artech House, Norwood, Mass, USA, 1999. [6] J. J. Buckley and Y. Hayashi, “Neural nets for fuzzy systems,”
Fuzzy Sets and Systems, vol. 71, no. 3, pp. 265–276, 1995. [7] F. Dellaert, S. M. Seitz, C. E. Thorpe, and S. Thrun, “Structure
from motion without correspondence,” inProc. IEEE Confer-ence on Computer Vision and Pattern Recognition (CVPR ’00), vol. 2, pp. 557–564, Hilton Head Island, SC, USA, June 2000. [8] A. P. Dempster, N. M. Laird, and D. B. Rubin, “Maximum likelihood from incomplete data via the EM algorithm,” Jour-nal of the Royal Statistical Society B, vol. 39, no. 1, pp. 1–38, 1977.
[9] Z. Ding, H. Leung, and L. Hong, “Decoupling joint proba-bilistic data association algorithm for multiple target track-ing,”IEE Proceedings Radar, Sonar and Navigation, vol. 146, no. 5, pp. 251–254, 1999.
[11] J. Garc´ıa, J. A. Besada, J. M. Molina, J. Portillo, and G. de Miguel, “Fuzzy data association for image-based tracking in dense scenarios,” in Proc. IEEE International Conference on Fuzzy Systems (FUZZ-IEEE ’02), vol. 2, pp. 902–907, Hon-olulu, Hawaii, USA, May 2002.
[12] H. Gauvrit, J. P. Le Cadre, and C. Jauffret, “A formulation of multitarget tracking as an incomplete data problem,”IEEE Trans. on Aerospace and Electronics Systems, vol. 33, no. 4, pp. 1242–1257, 1997.
[13] M. Haag and H.-H. Nagel, “Tracking of complex driving ma-noeuvres in traffic image sequences,”Image and Vision Com-puting, vol. 16, no. 8, pp. 517–527, 1998.
[14] S. K. Halgamuge and M. Glesner, “Neural networks in design-ing fuzzy systems for real world applications,”Fuzzy Sets and Systems, vol. 65, no. 1, pp. 1–12, 1994.
[15] J.-S. R. Jang, “ANFIS: adaptive-network-based fuzzy infer-ence systems,”IEEE Trans. Syst., Man, Cybern., vol. 23, no. 3, pp. 665–685, 1993.
[16] D. Koller, K. Daniilidis, and H.-H. Nagel, “Model-based ob-ject tracking in monocular image sequences of road traf-fic scenes,”International Journal of Computer Vision, vol. 10, no. 3, pp. 257–281, 1993.
[17] E. H. Mamdani and J. Efstathion, “An analysis of formal log-ics as inference mechanism on expert systems,”International Journal of Man-Machine Studies, vol. 21, no. 3, pp. 213–227, 1984.
[18] V. Matell´an, C. Fern´andez, and J. M. Molina, “Genetic learn-ing of fuzzy reactive controllers,”Robotics and Autonomous Systems, vol. 25, no. 1-2, pp. 33–41, 1998.
[19] J. M. Mendel, “Fuzzy logic systems for engineering: a tutorial,” Proc. IEEE, vol. 83, no. 3, pp. 345–377, 1995.
[20] D. Nauck and R. Kruse, “NEFCLASS—a neuro-fuzzy ap-proach for the clasification of data,” inProc. ACM Symposium on Applied Computing, pp. 461–465, Nashville, Tenn, USA, February 1995.
[21] D. Nauck, R. Kruse, and R. Stellmach, “New learning al-gorithms for the neuro-fuzzy environment NEFCON-1,” in Proc. Neuro-Fuzzy Systems, pp. 357–364, Darmstadt, Ger-many, 1995.
[22] D. Nauck, “Neuro-fuzzy systems: review and prospects,” in Proc. 5th European Congress on Intelligent Techniques and Soft Computing (EUFIT ’97), pp. 1044–1053, Aachen, Germany, September 1997.
[23] J. H. Piater and J. L. Crowley, “Multi-modal tracking of in-teracting targets using Gaussian approximations,” in Proc. IEEE 2nd International Workshop on Performance Evaluation of Tracking and Surveillance (PETS ’01), Kauai, Hawaii, USA, December 2001.
[24] D. Pokrajac and L. J. Latecki, “Spatiotemporal blocks-based moving objects identification and tracking,” in Proc. Joint IEEE International Workshop on Visual Surveillance and Per-formance Evaluation of Tracking and Surveillance (VS-PETS ’03), Nice, France, October 2003.
[25] P. L. Rosin and E. Ioannidis, “Evaluation of global image thresholding for change detection,”Pattern Recognition Let-ters, vol. 24, no. 14, pp. 2345–2356, 2003.
[26] M. Sugeno, “An introductory survey of fuzzy control,” Infor-mation Science, vol. 36, no. 1-2, pp. 59–83, 1985.
[27] N. Tschichold-G¨urman, “Generation and improvement of fuzzy classifier with incremental learning using fuzzy rulenet,” inProc. ACM Symposium on Applied Computing, pp. 466–470, Nashville, Tenn, USA, February 1995.
[28] L. A. Zadeh, “Outline of a new approach to the analysis of complex systems and decision processes,”IEEE Trans. Syst., Man, Cybern., vol. 3, no. 1, pp. 28–44, 1973.
[29] H. J. Zimmermann, Fuzzy Set Theory and Its Applications, Kluwer Academic, Norwell, Mass, USA, 1990.
Jes ´us Garc´ıais currently an Associate Lec-turer in the Computer Science Department, Universidad Carlos III de Madrid, since the year 2000. He received a degree in telecommunication engineering from Uni-versidad Polit´ecnica de Madrid in 1996, and the Ph.D. degree from the same univer-sity in 2001. He currently works in the Re-search Group of Applied Artificial Intelli-gence. Prior to this appointment, he had
worked in the Data Processing and Simulation Group, Universidad Polit´ecnica de Madrid. He has participated in several national and European projects related to air traffic management. His main in-terests are in artificial intelligence applied to engineering aspects in the context of radar and image data processing, navigation, and air traffic management. He is the author of more than 10 publications in journals and 30 publications in international conferences.
Jos´e M. Molinais an Associate Professor at the Universidad Carlos III de Madrid. He joined the Computer Science Department, Universidad Carlos III de Madrid in 1993. Currently he coordinates the Applied Arti-ficial Intelligence Group (GIAA). His cur-rent research focuses on the application of soft computing techniques (NN, evolution-ary computation, fuzzy logic, and multia-gent systems) to radar data processing, air
traffic management, and e-commerce. He is author of up to 20 journal papers and 80 conference papers. He received a degree in telecommunication engineering from the Universidad Polit´ecnica de Madrid in 1993 and a Ph.D. degree from the same university in 1997.
Juan A. Besada received a degree in telecommunication engineering from the Universidad Polit´ecnica de Madrid in 1996 and a Ph.D. degree from the same university in 2001. He has worked in the Signal Pro-cessing and Simulation Group of the same university since 1995, participating in sev-eral national and European projects related to air traffic control. He is currently an As-sociate Professor at Universidad Polit´ecnica
de Madrid. His main interests are air traffic control, navigation, and data fusion.
Javier I. Portillo received his B.S. and Ph.D. degrees in telecommunication engi-neering in 1985 and 1991, respectively, both from Universidad Polit´ecnica de Madrid. Currently, he is a Professor in the Sig-nal, System, and Radiocommunications De-partment, Telecommunication Engineering School, Universidad Polit´ecnica de Madrid. His research interests are image processing, computer vision, and simulation, and the