“A pedometer-based physically active learning intervention: The importance of using pre-intervention physical activity categories to assess effectiveness” by Morris JL et al.
A pedometer-based physically active learning intervention: The importance
of using pre-intervention physical activity categories to assess effectiveness.
Jade L Morris1, Andy Daly-Smith1, Margaret A Defeyter2, Jim McKenna1, Steve Zwolinsky1, Scott
Lloyd3, Melissa Fothergill4
,
Pamela L Graham5.1 Centre of Active Lifestyle, Institute for Sport, Physical Activity and Leisure, School of Sport
,
Leeds Beckett University, Leeds, UK2 Psychology
,
Northumbria University, Newcastle, UK.3 Public Health
,
Redcar & Cleveland Borough Council, UK.4 Health, Sport and Exercise Psychology,School of Psychology, Newcastle University, UK.
5 Social Work, Education and Community Wellbeing
,
Northumbria University, Newcastle, UK.Corresponding Author: Jade L Morris. Email: [email protected] 3
4 1 2
“A pedometer-based physically active learning intervention: The importance of using pre-intervention physical activity categories to assess effectiveness” by Morris JL et al.
Abstract
Purpose: To assess physical activity (PA) outcomes of a pedometer-based physically active learning (PAL) intervention in primary school children.
Method: Six paired schools, were randomly allocated either to a six-week teacher-led pedometer-based PAL intervention or control (n=154, Female=60%, 9.9±0.3yrs). Accelerometers assessed total daily sedentary time, light PA (LPA) and moderate-to-vigorous PA (MVPA). Pre-intervention mean daily MVPA minutes grouped participants as Low Active (<45 minutes/day) and High Active (≥45 minutes/day).
Results: From the final sample size,the intervention (n=52) significantly improved LPA versus control (n=31, p=0.04), by reducing sedentary time. More intervention (+10%) than control (+3%) pupils met the 60 minutes/day guidelines. In both intervention subgroups pupils spent less time in LPA (p<0.05) versus control. The greatest non-significant increase was found in the Low Active pupils MVPA levels.
Conclusion: Improvements in LPA were statistically significant in the intervention versus control group. In subgroup analysis Low Active pupils in the intervention showed the greatest beneficial effects and the Most Active pupils may have replaced MVPA and sedentary time with LPA. The intervention group housed clusters of pupils showing variable responsiveness, justifying routine examination of subgroup variability in future studies.
8 9 12
13 14
15 16 17 18 19
“A pedometer-based physically active learning intervention: The importance of using pre-intervention physical activity categories to assess effectiveness” by Morris JL et al.
Introduction
The beneficial effects of childhood physical activity (PA) are profound (22,44). Increased PA has been associated with improvements in cardiovascular health (1), cardiometabolic risk factors (4,14) and adiposity (19,23), as well as psychological health including depression (10), self-esteem and reduced anxiety levels (3,27). Yet, in 38 countries around the world, including England, Canada, Australia and America, less than 30% of children are sufficiently active to secure these benefits (23,43). This is all-the-more alarming given the well documented adverse health outcomes for children who lead inactive lifestyles (23,43). Moreover, inactivity is now considered an important global economic problem due to escalating health care costs (13).
Overcoming high rates of physical inactivity is challenging, with no universal solution at present. Given that behaviour is driven by a combination of individual, social and environmental factors, children’s responsiveness to PA interventions is widely variable (26,29). Although schools are often a favoured environment for PA interventions targeted at children (11), data from contemporary interventions continue to demonstrate limited effectiveness (46). Current national and international guidelines recommend that children engage in at least 60 minutes of moderate-to-vigorous PA (MVPA) each day (8,12,43,45), of which 30 minutes should be during the school day (21). Yet, school-based interventions typically display only small effects and short-term behavioural changes; clearly some children respond powerfully, while others do not. This undermines any presumptions about universal benefit arising from any provision and justifies looking at subgroup responsiveness within all intervention (11,25). In this regard, it is unhelpful that data pertaining to children have typically utilised a single overall mean score, meaning that intervention effects may be attributed to high levels of subgroup responsiveness rather than a universal intervention effect (24). Reliance on single outcome averages may also conceal noteworthy detail about PA behaviour in the groups that require most assistance and support (26), such as the most inactive children that are often overweight and obese (41).
13 14
29
“A pedometer-based physically active learning intervention: The importance of using pre-intervention physical activity categories to assess effectiveness” by Morris JL et al.
New interventions, especially those targeting lesson times - the most inactive period in a child’s day (2,18,34) - may offer further opportunities to improve PA. Physically active learning (PAL) provides one such avenue for intervention, whereby movement is combined with learning to replace the typical traditional sedentary classroom lessons (35). Using a single mean outcome score, recent systematic reviews and meta analyses revealed mixed success for PAL in increasing MVPA (35,45), whereas a study using subgroup analyses found notable improvements in girls (36). While participant variability has been identified as an important consideration when evaluating interventions (15,16), subgroup analyses around PA behaviours are often overlooked (36) in favour of approaches that identify ‘universal’ outcomes. To date, few studies have used subgroup approaches in PA and PAL research (36,40); no previous studies have conducted subgroup analyses on pre-intervention PA levels to explore the differing effect of a PAL and pedometer-based intervention.
The present study aims to evaluate the effectiveness of a PAL intervention on children’s PA levels using subgroup analysis to reveal stratified intervention effects highlighted by pre-intervention PA levels.
Materials and Methods
Participants and Study Design
Participants (n=154, intervention: n=82, females=55%, age=9.98±0.31yrs, control, n=72, females=52%, age=9.89±0.29yrs) were recruited from six year 5 classes across six schools (see figure 1 for CONSORT flow diagram). As directed by the local public health commissioner, the intervention was directed to key stage two (years 3 to 6), however the evaluation was taken with year 5 due to exam commitments of the other year groups. Prior to commencing, consent was obtained from headteachers and parents; and assent was obtained from pupils. Ethical clearance was granted by the Leeds Beckett University Ethics Committee (reference 37482). Schools were ranked and paired 18
19 54 55 56 57 58 59 60 61 62 63 64 65 66 67 68
69
70
“A pedometer-based physically active learning intervention: The importance of using pre-intervention physical activity categories to assess effectiveness” by Morris JL et al.
by socioeconomic status (SES), determined by the proportion of children receiving free school meals (2.39% to 31.79%, M=16.37±0.10%). One school per pair was randomly allocated, by coin toss, to a six-week teacher-led pedometer-based PAL intervention or control condition. Data collection commenced in January 2016.
[ Insert figure 1 here ]
Intervention Design
Pre-intervention, teachers received a one-to-one PAL training session from the local School Games Organiser (SGO), a qualified teacher who organises inter-school sports participation and competition for all and provides teacher training workshops. The intervention was commissioned by the local authority and was practitioner designed and there was an absence of a theoretical underpinnings. The training consisted of providing teachers with practical strategies to integrate movement within their lessons both within and outside of the classroom environment. PAL lesson ideas were shared amongst participants and further support was provided to assist with lesson plan modification to facilitate teachers’ incorporation of activities. One example of a lesson strategy involved reinforcing spelling through active spelling relays in the playground. In addition, the SGO modelled a PAL lesson with the teacher’s class in the school hall, combining traditional PE activities with subject specific learning outcomes and involving the students in an active story.
During the intervention period, participants wore pedometers (SW200 Digiwalker). These were used to support the delivery of PAL lessons through (a) each school identified a target destination based on a number of steps they had to achieve over the six-week period (e.g., walk to the Olympic stadium) and (b) incorporation of the outcome data into classroom activity (e.g., to develop bar charts of the number of steps undertaken). Goal setting with the pedometers was also implemented with the aim to increase step counts during the six-week step challenge. In the first week, children’s baseline step account was assessed using the pedometers, with an expectation this 23
24 78 79 80 81
82
83 84 85 86 87 88 89 90 91 92 93 94
“A pedometer-based physically active learning intervention: The importance of using pre-intervention physical activity categories to assess effectiveness” by Morris JL et al.
target would be increased each week through school-based PA. Tracking sheets were provided to monitor pupils step count progress. Control schools were instructed to maintain their current provision. There were no perceived adverse events from the intervention.
Outcome Measures
Physical Activity Levels
The impact of the intervention on PA was assessed by GT1M uniaxial accelerometers (ActiGraph, Pensacola, FL, USA). Control and intervention participants wore the monitors for eight days’ pre-intervention and for the final eight days of the intervention (final intervention week). The accelerometers were worn on the right hip; every day, all day except for sleeping and water-based activities. Monitors recorded from the second day to allow for reactivity on day one, resulting in seven days’ data collection. Counts were recorded in 15-second epochs (31).
Accelerometer data were downloaded using ActiLife 6, and analysed in KineSoft (v3.3.75, Loughborough, UK). A period of non-wear time used the criterion of greater ≥20-minutes of consecutive zero counts. A minimum of 480 minutes/day identified a valid day. Spurious values were identified as ≥30,000 counts and omitted from the final data analysis. A valid profile required a minimum of three-school days (5,30). Evenson’s cut-points were used, determining time spent in sedentary (0-25 counts 15-1), light (26-573 counts 15-1), moderate (574-1002 counts 15-1) and
vigorous activity (≥ 1003 counts 15-1) (17). Individual accelerometer profiles were independently
screened to validate wear time and remove incomplete data.
Anthropometrics and Biological Maturation
On the day when accelerometers were fitted – the week before the intervention started -participants height and weight were also collected, using Seca 217 Stadiometer (Seca, Germany) and Seca 875 Digital Weighing Scales (Seca, Germany). Participants wore their school uniform but removed jumpers and shoes. BMI and BMI SDS (standard deviation scores) were calculated and 28
29 102 103 104
105
106 107 108 109 110 111 112
113 114 115 116 117 118 119 120
“A pedometer-based physically active learning intervention: The importance of using pre-intervention physical activity categories to assess effectiveness” by Morris JL et al.
classified against British 1990 growth reference (UK90) distribution (9). Biological maturation was calculated using gender specific equations to predict children’s age from on peak height velocity (32). This method has been commonly used with children in similar studies (42).
Statistical Analysis
Average daily minutes spent sedentary, light PA (LPA) and MVPA were converted into percentages based on the average total day. Change in percentage from pre to final intervention week, and percentage of participants meeting the MVPA guidelines (60 minutes/day) were also calculated to explore pre to final intervention week differences in the intervention versus control. Analysis of Covariance tests (ANCOVA) using SPSS (Version 24) identified any significant intervention effects on sedentary time, LPA and MVPA. Covariates entered in the model were maturity offset, BMI SDS, gender and the appropriate pre activity category.
Two subgroups were created using initial accelerometery data on MVPA levels; (i) Low Active(e.g. achieved less than 45 minutes/day MVPA), and (ii) High Active (e.g. achieved more than 45 minutes/day of MVPA, including children achieving 60 minutes/day fulfilling the PA guidelines). ANCOVA tests were conducted to identify main interactions with the addition of the subgroups on sedentary time, LPA and MVPA and using the same covariates previously described. Post hoc analysis was conducted using a Bonferroni correction to look at the differences between subgroups for sedentary time, LPA and MVPA.
To determine statistical significance, α was set at p<0.05. This study did not include an a priori power calculation due to the nature of the recruitment process. As a result, the sample size was determined using a non-probability purposive sample. Nevertheless, a post hoc power calculation indicated that the study achieved 8% power. To achieve 80% power, a sample size of 128 participants would have been required (1-beta probability =0.80, alpha error probability =0.05, effect size f=0.25, number of groups =4, number of covariates =4).
Results
33 34 126 127 128
129 130 131 132 133 134 135 136 137 138 139 140 141 142 143 144 145 146 147 148 149
“A pedometer-based physically active learning intervention: The importance of using pre-intervention physical activity categories to assess effectiveness” by Morris JL et al.
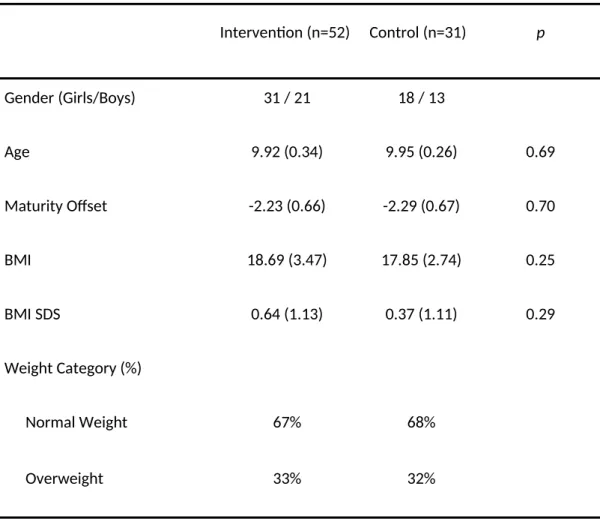
Eighty-three participants met the inclusion criteria (intervention: n=52, females=61.5%, age=9.92±0.34yrs, control: n=31, females=56.3%, age=9.95±0.26yrs); 69 were removed for providing <3 days of valid data at both time points (nIntervention=29, nControl=40), and 2 were removed due to missing data (nIntervention=1, nControl=1). Table 1 details characteristics for the intervention and control conditions, identifying no significant differences (p>0.05).
Main effects revealed intervention participants improved time spent in LPA (2.03±4.63% vs. -0.04±4.32%) and found a trend towards significant improvements for sedentary time (-2.33±5.90% vs. -0.14±5.60%) versus control. A significant time by group interaction was observed for LPA (p=0.04, ɳ2
p=0.05, 95% CI: 0.12, 4.27). No significant time by group interaction effects were observed
for MVPA (p=0.65, ɳ2
p=0.05) or sedentary time (p=0.06, ɳ2p=0.04). A seven percent greater increase
was observed in the proportion of intervention participants (17% to 27%) who met the daily MVPA guidelines compared to controls (16% to 19%).
Subgroup analysis revealed no significant main interaction between subgroups and conditions for MVPA (p=0.899, ɳ2
p=0.003), LPA (p=0.644, ɳ2p=0.000) or sedentary behaviour
(p=0.568, ɳ2
p=0.004). On closer inspection, the Low Active intervention subgroup revealed a
significant improvement in percentage of time spent in LPA (2.09 ± 5.05%, vs. 1.10±4.05, p=0.04, ɳ2
p=0.118) and the greatest non-significant improvement in time spent in MVPA (1.27±2.11% vs.
0.79±2.23, p=0.728) and sedentary time (-3.36±6.16%, vs. -1.89±4.96, p=0.08). The High Active intervention subgroup revealed the greatest significant increase in time spent in LPA versus control (1.96 ± 4.23%, vs. -0.95±4.31, p=0.052, ɳ2
p=0.099). Whilst improvements were in seen in the High
Active intervention subgroup for sedentary time, this was not statistically significant versus control (p=0.199). The High Active subgroup in both the intervention and the control conditions demonstrated a small non-significant decrease in MVPA levels (table 2 and figure 2).
When assessing the change in the proportion of participants meeting the PA guidelines of 60 minutes/day, stratified by the subgroups, an increase was identified in both the Low Active 38
39 151 152 153 154 155
156 157 158 159 160 161 162
163 164 165 166 167 168 169 170 171 172 173
“A pedometer-based physically active learning intervention: The importance of using pre-intervention physical activity categories to assess effectiveness” by Morris JL et al.
intervention (+3 participants, 11%) and control subgroup (+2 participants, 15%). The High Active intervention subgroup revealed a greater increase in participants meeting the guidelines with an increase of 13% (+2 participants) versus a decrease of 6% (-1 participant) in the control.
[ Insert figure 2 here ]
Discussion
This in-school pedometer-based PAL intervention identified statistically significant increases in LPA versus the control. The improved PA profiles indicate that LPA displaced sedentary time and MVPA in the intervention group. In line with previous school-based interventions (38), this intervention resulted in significant increases in LPA but not MVPA, and reductions in time spent being sedentary. These findings are noteworthy as some international PA guidelines for children now include recommendations for LPA alongside MVPA (6). Recommendations for LPA have been supported by the epidemiological evidence indicating the potential benefits of increasing LPA, including associations with reduced systolic blood pressure (21), diastolic blood pressure and HDL-cholesterol levels (7). Indeed, all intensities of PA above sedentary activity have significant beneficial associations with such cardiometabolic biomarkers (21). This reinforces the beneficial effects of the current study for increasing LPA levels through a PAL intervention.
A further purpose of this study was to undertake a preliminary PA subgroup analysis, given few studies have explored similar subgroup analysis methods (36,40). Although we found statistically significant improvements in LPA at the group level, the standard universal approach masked behavioural differences between subgroups and incorrectly presumed all participants reacted in the same way to the intervention (26,29). Refined analysis revealed small, but varied responses to the intervention: first, the least active pupils benefitted most, an effect supported by previous literature (39). Second, both intervention subgroups revealed a significant increase in time spent in LPA 43
44 176 177 178
179
180
“A pedometer-based physically active learning intervention: The importance of using pre-intervention physical activity categories to assess effectiveness” by Morris JL et al.
(p<0.05), however the High Active subgroup showed decreases in percentage of time spent in MVPA, suggesting the possibility of some form of ‘compensation’.
This compensation may be due to the subtle decline in time spent in MVPA and sedentary behaviour that allowed an increase in LPA. This may suggest the beneficial effects of the intervention were not as unified for High Active as the beneficial effects for the Low Active subgroup. This stratified examination of the current data, using subgroup analysis, revealed varied response to the intervention in groups identified as different using baseline figures. Using conventional reporting of a single value of the intervention effect would overlook the distinctive responsiveness of these groups. While the current study provides an interesting insight, these findings do need to be treated with some caution. The small sample size may have produced an estimate for the benefits of PAL that are too imprecise to be useful for planning and intervention.
Although a single mean statistical difference was found using traditional data analysis methods, unpicking the data with subgroup analysis revealed the scale and direction of the variable responses generated by a pedometer-based PAL intervention. These profiles can be used to inform future interventions, on which children, to target greatest benefits. The current study is supported by previous evidence on PAL interventions showing mixed success and small changes at the group level (35,36). Varied responsiveness has previously been demonstrated by Oliver et al. (36) who found that least active girls benefited most from a PAL intervention, whereas a whole-group analysis showed no benefit. Moreover, a recent systematic review identified the scarcity of studies providing evidence on a range of equity effects on interventions beyond gender (26), resulting in a lack of understanding of subgroups and their varied intervention responses. The current results support the use of subgroup analysis, while offering new insights into the responsiveness of a pedometer-based PAL intervention based on pre-intervention PA characteristics.
One of the most important findings from our data relates to the stratified responsiveness of participants to the intervention. While there were several positive significant subgroup improvements in activity levels in the intervention, a decrease in MVPA and increase in sedentary 48
“A pedometer-based physically active learning intervention: The importance of using pre-intervention physical activity categories to assess effectiveness” by Morris JL et al.
time in the High Active was also evident. Although this may seem negative, overall PA levels in this subgroup were still higher than all other intervention subgroups. Furthermore, these differences could be attributed from day-to-day variability, environmental influences or individual behaviours (29,37). These effects should be addressed in future research using tightly controlled designs.
The present study, in part, aims to encourage schools and policymakers to address the issue of traditional didactic teaching methods promoting sedentary behaviour and limiting time to be physically active (39). Moreover, it also endorses deploying analyses that can illustrate variations in intervention effect when the intervention occurs in a confined classroom space. While the conclusions emerging from these data, based on traditional analysis methods, provide some positive outcomes, further analysis exploring subgroups provides a more in-depth understanding of the intervention, which otherwise, might have been overlooked. Acknowledging that few PA interventions will provide a ‘universal’ fix for inactive children, analytical approaches are available to investigate individual and stratified responsiveness (37). Subsequently, these individual responses need to be considered in future interventions to ensure greater returns and associated benefits. The challenge for policymakers and practitioners is to correctly identify intervention impact across groups with diverse baseline PA profiles, which can be used for tailored context and population implementation.
Several strengths are encompassed within the current study including the use of a randomised control design balanced by SES. An objective assessment of PA was also used; this is rare in school-based pedometer interventions (26,28). However, there was a high non-return rate resulting in a small sample size, which limits the external validity, especially for subgroup analysis. Statistical conclusions drawn from the subgroup analysis should be considered with caution, with an emphasis on the potential possibilities subgroups analysis can provide for a more in-depth analysis of PA behaviour, especially in relation to field-based studies.
This pilot study would benefit from being replicated with a sample of sufficient statistical power to support subgroup analysis that can be directly related to policy (20). Future studies 53
“A pedometer-based physically active learning intervention: The importance of using pre-intervention physical activity categories to assess effectiveness” by Morris JL et al.
expanding on the current studies analysis techniques with a sufficient sample size, would warrant using more subgroups that can be aligned more appropriately to the PA guidelines and provide greater public health relevance (e.g., Subgroup 1 ‘Non-Achievers’ = achieved less than 30minutes/day MVPA, Subgroup 2 ‘Non-Achievers’ = 30-44 minutes/day, Subgroup 3 ‘Near-Achievers’ = 45-59 minutes/day and Subgroup 4 ‘‘Near-Achievers’ = more than 60minutes/day). Finally, recent conclusions around the success of school-based PA interventions states that they can be successful without visible changes in PA behaviour, where other potential benefits may be revealed (33). The present study assessed LPA, MVPA and sedentary behaviour, future studies may include further outcome measures, including psychological changes such as motivation and enjoyment (33) to explain changes in PA behaviours.
Conclusions
The current findings confirm statistically significant improvements in time spent in LPA for the intervention versus control. On closer inspection, subgroup analysis identified statistical improvements in both intervention subgroups versus control, which for the Low Active subgroup may be compensated due to decreases in sedentary behaviour, yet the more active subgroup may have increased LPA due to a combination of decreased time spent in MVPA and time spent sedentary. Rather than expecting universal effects from generic interventions, researchers can use subgroup analysis to explore individual variability to establish the many ways children may respond to school-based PA interventions. Once this is established, research can move towards understanding how to appropriately tailor intervention methods to identify and reproduce more sustainable and widespread improvements.
58 59 251 252 253 254 255 256 257 258 259 260
261
“A pedometer-based physically active learning intervention: The importance of using pre-intervention physical activity categories to assess effectiveness” by Morris JL et al.
References
1. Andersen LB, Riddoch C, Kriemler S, Hills AP, Hills A. Physical activity and cardiovascular risk factors in children. Br J Sports Med. 2011;45(11):871–6.
2. Bailey, D.P., Fairclough, S.J., Savory, L.A. Accelerometry-assessed sedentary behaviour and physical activity levels during the segmented school day in 10-14-year-old children: the HAPPY study. Eur J Pediatr. 2012;171:1805–13.
3. Biddle SJ, O’Connell S, Braithwaite RE. Sedentary behaviour interventions in young people: a meta-analysis. Br J Sports Med. 2011;45(11):937–42.
4. Boddy LM, Murphy MH, Cunningham C, Breslin G, Foweather L, Gobbi R, et al. Physical activity, cardiorespiratory fitness, and clustered cardiometabolic risk in 10- to 12-year-old school children: the REACH Y6 study. Am J Hum Biol. 2014;26(4):446–51.
5. Cain KL, Sallis JF, Conway TL, Van Dyck D, Calhoon L. Using accelerometers in youth physical activity studies: a review of methods. J Phys Act Health. 2013;10(3):437–50.
6. Canadian Society for Exercise Physiology. Canadian Physical Activity Guidelines and Canadian
Sedentary Behaviour Guidelines: Your Plan to Get Active Every Day. 2012.
7. Carson V, Ridgers ND, Howard BJ, Winkler EAH, Healy GN, Owen N, et al. Light-intensity physical activity and cardiometabolic biomarkers in US adolescents. PLoS One.
2013;8(8):e71417.
8. Chief Medical Officers of England Scotland Wales and Northern Ireland. Start Active, Stay Active: A Report on Physical Activity for Health from the Four Home Countries Chief Medical
Officers. London: Department of Health, Physical Activity, Health Improvement and
Protection; 2011.
9. Cole TJ, Freeman JV, Preece MA. Body mass index reference curves for the UK, 1990. Arch
Dis Child. 1995;73(1):25–9.
63 64
“A pedometer-based physically active learning intervention: The importance of using pre-intervention physical activity categories to assess effectiveness” by Morris JL et al.
10. Daley A. Exercise and Depression: A Review of Reviews. J Clin Psychol Med Settings.
2008;15(2):140.
11. Demetriou Y, Höner O. Physical activity interventions in the school setting: A systematic review. Psychol Sport Exerc. 2012;13(2):186–96.
12. Department of Health. Does Your Child Get 60 Minutes of Physical Activity Every Day? Make
Your Move - Sit Less, Be Active for Life! Australia: Department of Health; 2012.
13. Ding D, Lawson KD, Kolbe-Alexander TL, Finkelstein EA, Katzmarzyk PT, van Mechelen W, et al. The economic burden of physical inactivity: a global analysis of major non-communicable diseases. Lancet. 2016 Sep;388(10051):1311–24.
14. Ekelund U, Luan J ’an, Sherar LB, Esliger DW, Griew P, Cooper A, et al. Moderate to vigorous physical activity and sedentary time and cardiometabolic risk factors in children and adolescents. JAMA. 2012;307(7):704–12.
15. Epstein LH, Paluch RA, Roemmich JN, Beecher MD. Family-based obesity treatment, then and now: twenty-five years of pediatric obesity treatment. Health Psychol. 2007;26(4):381– 91.
16. Epstein LH, Wrotniak BH. Future directions for pediatric obesity treatment. Obesity. 2010;18 Suppl 1:S8–12.
17. Evenson KR, Catellier DJ, Gill K, Ondrak KS, McMurray RG. Calibration of two objective measures of physical activity for children. J Sports Sci. 2008;26(14):1557–65.
18. Fairclough SJ, Beighle A, Erwin H, Ridgers ND. School day segmented physical activity patterns of high and low active children. BMC Public Health. 2012;12:406.
19. Fairclough SJ, Boddy LM, Ridgers ND, Stratton G. Weight status associations with physical activity intensity and physical self-perceptions in 10- to 11-year-old children. Pediatr Exerc Sci. 2012;24(1):100–12.
20. Harris T, Kerry SM, Victor CR, Shah SM, Iliffe S, Ussher M, et al. PACE-UP (Pedometer and consultation evaluation--UP)--a pedometer-based walking intervention with and without 68
“A pedometer-based physically active learning intervention: The importance of using pre-intervention physical activity categories to assess effectiveness” by Morris JL et al.
practice nurse support in primary care patients aged 45-75 years: study protocol for a randomised controlled trial. Trials. 2013;14:418.
21. HM Government. Childhood Obesity: A Plan for Action. GOV.UK; 2012.
22. Howard B, Winkler EAH, Sethi P, Carson V, Ridgers ND, Salmon JO, et al. Associations of Low-and High-Intensity Light Activity with Cardiometabolic Biomarkers. Med Sci Sports Exerc. 2015;47(10):2093–101.
23. Janssen I, Leblanc AG. Systematic review of the health benefits of physical activity and fitness in school-aged children and youth. Int J Behav Nutr Phys Ach. 2010;7:40.
24. Johnson WD, George VT. Effect of regression to the mean in the presence of within-subject variability. Stat Med. 1991;10(8):1295–302.
25. Lonsdale C, Rosenkranz RR, Peralta LR, Bennie A, Fahey P, Lubans DR. A systematic review and meta-analysis of interventions designed to increase moderate-to-vigorous physical activity in school physical education lessons. Prev Med. 2013;56(2):152–61.
26. Love RE, Adams J, van Sluijs EMF. Equity effects of children’s physical activity interventions: a systematic scoping review. Int J Behav Nutr Phys Act. 2017;14(1):134.
27. Lubans D, Richards J, Hillman C, Faulkner G, Beauchamp M, Nilsson M, et al. Physical Activity for Cognitive and Mental Health in Youth: A Systematic Review of Mechanisms. Pediatrics. 2016;138(3).
28. Lubans DR, Morgan PJ, Tudor-Locke C. A systematic review of studies using pedometers to promote physical activity among youth. Prev Med. 2009;48(4):307–15.
29. Mansfield ED, Ducharme N, Koski KG. Individual, social and environmental factors influencing physical activity levels and behaviours of multiethnic socio-economically disadvantaged urban mothers in Canada: a mixed methods approach. Int J Behav Nutr Phys Act. 2012;9:42.
30. Mattocks C, Leary S, Ness A, Deere K, Saunders J, Tilling K, et al. Calibration of an accelerometer during free-living activities in children. Int J Pediatr Obes. 2007;2(4):218–26. 73
“A pedometer-based physically active learning intervention: The importance of using pre-intervention physical activity categories to assess effectiveness” by Morris JL et al.
31. Migueles JH, Cadenas-Sanchez C, Ekelund U, Delisle Nyström C, Mora-Gonzalez J, Löf M, et al. Accelerometer Data Collection and Processing Criteria to Assess Physical Activity and Other Outcomes: A Systematic Review and Practical Considerations. Sports Med. 2017;47(9):1821–45.
32. Moore SA, McKay HA, Macdonald H, Nettlefold L, Baxter-Jones ADG, Cameron N, et al. Enhancing a Somatic Maturity Prediction Model. Med Sci Sports Exerc. 2015 Aug;47(8):1755– 64.
33. Nayak BK. Understanding the relevance of sample size calculation. Indian J Ophthalmol. 2010;58(6):469–70.
34. Nettlefold L, McKay HA, Warburton DER, McGuire KA, Bredin SSD, Naylor PJ. The challenge of low physical activity during the school day: at recess, lunch and in physical education. Br J
Sports Med. 2011;45(10):813–9.
35. Norris E, Shelton N, Dunsmuir S, Duke-Williams O, Stamatakis E. Physically active lessons as physical activity and educational interventions: a systematic review of methods and results.
Prev Med. 2015;72:116–25.
36. Oliver M, Schofield G, McEvoy E. An integrated curriculum approach to increasing habitual physical activity in children: a feasibility study. J Sch Health. 2006;76(2):74–9.
37. ONS. Population Estimates for UK, England and Wales, Scotland and Northern Ireland. Office for National Statistics; 2016.
38. Pate RR, Brown WH, Pfeiffer KA, Howie EK, Saunders RP, Addy CL, et al. An Intervention to Increase Physical Activity in Children: A Randomized Controlled Trial With 4-Year-Olds in Preschools. Am J Prev Med. 2016;51(1):12–22.
39. Quarmby W, Daly-Smith A, Kime N. ‘You get some very archaic ideas of what teaching is…’: primary school teachers’ perceptions of the barriers to physically active learning. Education.
2018:3-13. 78
“A pedometer-based physically active learning intervention: The importance of using pre-intervention physical activity categories to assess effectiveness” by Morris JL et al.
40. Resaland GK, Aadland E, Moe VF, Aadland KN, Skrede T, Stavnsbo M, et al. Effects of physical activity on schoolchildren’s academic performance: The Active Smarter Kids (ASK) cluster-randomized controlled trial. Prev Med. 2016;91:322–8.
41. Spear BA, Barlow SE, Ervin C, Ludwig DS, Saelens BE, Schetzina KE, et al. Recommendations for treatment of child and adolescent overweight and obesity. Pediatrics. 2007;120 Suppl 4:S254–88.
42. Taylor SL, Curry WB, Knowles ZR, Noonan RJ, McGrane B, Fairclough SJ. Predictors of Segmented School Day Physical Activity and Sedentary Time in Children from a Northwest England Low-Income Community. Int J Environ Res Public Health. 2017;14(5).
43. Tremblay MS, Barnes JD, González SA, Katzmarzyk PT, Onywera VO, Reilly JJ, et al. Global Matrix 2.0: Report Card Grades on the Physical Activity of Children and Youth Comparing 38 Countries. J Phys Act Health. 2016;13(11 Suppl 2):S343–66.
44. Tremblay MS, Warburton DER, Janssen I, Paterson DH, Latimer AE, Rhodes RE, et al. New Canadian physical activity guidelines. Appl Physiol Nutr Metab. 2011;36(1):36–46; 47–58. 45. U.S. Department of Health and Human Services. 2008 Physical Activity Guidelines for
Americans. Be Active, Healthy and Happy! U.S: Centers for Disease Control and Prevention.;
2008.
46. Watson A, Timperio A, Brown H, Best K, Hesketh KD. Effect of classroom-based physical activity interventions on academic and physical activity outcomes: a systematic review and meta-analysis. Int J Behav Nutr Phys Act. 2017;14(1):114.
“A pedometer-based physically active learning intervention: The importance of using pre-intervention physical activity categories to assess effectiveness” by Morris JL et al.
Table 1: Descriptive characteristics of the intervention and control conditions.
Intervention (n=52) Control (n=31) p
Gender (Girls/Boys) 31 / 21 18 / 13
Age 9.92 (0.34) 9.95 (0.26) 0.69
Maturity Offset -2.23 (0.66) -2.29 (0.67) 0.70
BMI 18.69 (3.47) 17.85 (2.74) 0.25
BMI SDS 0.64 (1.13) 0.37 (1.11) 0.29
Weight Category (%)
Normal Weight 67% 68%
Overweight 33% 32%
“A pedometer-based physically active learning intervention: The importance of using pre-intervention physical activity categories to assess effectiveness” by Morris JL et al.
Table 2: Average pre-total daily percentage of time spent in MVPA and LPA and time spent being sedentary and change in percentage, stratified by
condition and pre-activity group.
MVPA (SD)
Change in Time Spent in MVPA (SD)
LPA (SD)
Change in Time Spent in LPA (SD)
Sedentary Time (SD)
Change in Sedentary Time (SD)
Pre % FIW % %
Minute s
Pre % FIW % %
Minute s
Pre % FIW % % Minutes
“A pedometer-based physically active learning intervention: The importance of using pre-intervention physical activity categories to assess effectiveness” by Morris JL et al. Control Low Active (n =13) 4.85 (1.47) 5.65 (2.72) 0.79 (2.23) 6.75 (15.98) 27.48 (4.36) 28.57 (3.34) 1.10 (4.05) 14.43 (35.72) 67.67 (5.23) 65.78 (4.19) -1.89 (4.96) 2.21 (55.19) High Active (n =18) 8.18 (2.33) 7.80 (2.34) -0.38 (2.45) -2.13 (16.40) 31.84 (7.12) 30.90 (4.55) -0.95 (4.31) -6.61 (32.72) 59.99 (8.17) 61.31 (5.76) 1.33 (5.66) 3.10 (52.76) TOTAL (n=32) 6.72 (2.55) 6.85 (2.70) 0.13 (2.35) 1.75 (16.57) 29.93 (6.27) 29.88 (4.18) -0.05 (4.19) 2.59 (35.14) 63.35 (7.82) 63.27 (5.54) -0.08 (5.52) 2.71 (52.95)
NB: FIW Final Week Intervention, SD Standard Deviation. Low Active: Children active for less than 45 minutes/day; High Active : Children active for 45
minutes/day or more.
20 98
396 397