ANALYSING SOURCE CODE STRUCTURE AND MINING SOFTWARE REPOSITORIES TO CREATE REQUIREMENTS TRACEABILITY LINKS
NASIR ALI
D´EPARTEMENT DE G´ENIE INFORMATIQUE ET G´ENIE LOGICIEL ´
ECOLE POLYTECHNIQUE DE MONTR´EAL
TH`ESE PR´ESENT´EE EN VUE DE L’OBTENTION DU DIPL ˆOME DE PHILOSOPHIÆ DOCTOR
(G ´ENIE INFORMATIQUE) D´ECEMBRE 2012
c
´
ECOLE POLYTECHNIQUE DE MONTR´EAL
Cette th`ese intitul´ee :
ANALYSING SOURCE CODE STRUCTURE AND MINING SOFTWARE REPOSITORIES TO CREATE REQUIREMENTS TRACEABILITY LINKS
pr´esent´ee par : ALI Nasir
en vue de l’obtention du diplˆome de : Philosophiæ Doctor a ´et´e dˆument accept´ee par le jury d’examen constitu´e de :
Mme BOUCHENEB Hanifa, Doctorat, pr´esidente
M. GU´EH ´ENEUC Yann-Ga¨el, Doct., membre et directeur de recherche M. ANTONIOL Giuliano, Ph.D., membre et codirecteur de recherche M. ADAMS Bram, Ph.D., membre
This dissertation is dedicated to my parents, for their support in seeing this work through its completion.. . .
ACKNOWLEDGMENTS
First of all, I would like to thank almighty ALLAH. Without his wish nothing is possible. The completion of this dissertation was only possible with the contributions of many people. Foremost are the generous support, mentoring, and patience of my advisors.
I would like to take this opportunity to thank my main supervisor, Dr. Prof. Yann-Ga¨el Gu´eh´eneuc for his encouragement, advices and inspiration throughout this research. I have learned much from him about the attitudes and skills for conducting research, collaborat-ing with other colleagues, presentcollaborat-ing ideas, and becollaborat-ing open-minded. He brought forth this research and allowed me to extend my education beyond the formal studies leading to this dissertation.
I would like to thank my co-supervisor, Prof. Dr. Giuliano Antoniol, whose support and guidance made my thesis work possible. I am very obliged for his motivation and immense knowledge in Software Engineering that, taken together, make him a great mentor. He always helped me to meet the short deadline by helping at evenings and–or on weekends. He never charged more than $5 for million dollar ideas and support. He could not even realise how much I have learned from him.
I would also thank Dr. Bram Adams, assistant professor at the ´Ecole Polytechnique de Montr´eal, Canada, Dr. Massimiliano Di Penta, associate professor at University of Sannio, Italy, of the University of Sannio, and Dr. Jane Huffman Hayes, Professor in Computer Science at the University of Kentucky, USA, for their assistance and feedback during the various phases of the dissertation.
I would also like to thank the members of my Ph.D. committee who enthusiastically accepted to monitor and read my dissertation.
I am very thankful to all my colleagues of SOCCERLab and Ptidej teams for their feed-back and the productive discussions. A special acknowledgment and thanks is given the members of all the software engineering groups, especially Ptidej and SOCCERLab teams, at Department of computing and software engineering at the ´Ecole Polytechnique de Mon-tr´eal who participated in the experiments of my ideas. I am truly indebted to them for their extra work during their studies.
Last but not the least, I am deeply grateful for the support my parents and siblings pro-vided during every phase of this dissertation. The time they gave of their own personal lives to come here from across the world was a big help in my effort to complete the dissertation. A special thanks to my 10 years old nephew Harris Yaseen who always prayed that I become as intelligent as he is.
R´ESUM´E
La tra¸cabilit´e est le seul moyen de s’assurer que le code source d’un syst`eme est conforme aux exigences et que toutes ces exigences et uniquement celles-ci ont ´et´e implant´ees par les d´eveloppeurs. Lors de la maintenance et de l’´evolution, les d´eveloppeurs ajoutent, suppriment ou modifient des fonctionnalit´es (y compris les fautes) dans le code source. Les liens de tra¸ca-bilit´e deviennent alors obsol`etes car les d´eveloppeurs n’ont pas ou ne peuvent pas consacrer les efforts n´ecessaires pour les mettre `a jour. Pourtant, la r´ecup´eration de liens de tra¸cabilit´e est une tˆache ardue et coˆuteuse pour les d´eveloppeurs. Par cons´equent, nous trouvons dans la litt´erature des m´ethodes, des techniques et des outils pour r´ecup´erer ces liens de tra¸cabilit´e automatiquement ou semi-automatiquement. Parmi les techniques propos´ees, la litt´erature montre que les techniques de recherche d’information (RI) peuvent r´ecup´erer automatique-ment des liens de tra¸cabilit´e entre les exigences ´ecrites sous forme textuelle et le code source. Toutefois, la pr´ecision et le rappel des techniques RI sont affect´es par certains facteurs qui influencent les entr´ees du processus de tra¸cabilit´e des exigences. En raison de la faible pr´ e-cision et du faible rappel de ces techniques, la confiance des d´eveloppeurs en l’efficacit´e des techniques de r´ecup´eration des liens de tra¸cabilit´e est affect´ee n´egativement.
Dans cette th`ese, notre proposition est que l’ajout de nouvelles sources d’information et l’int´egration des connaissances des d´eveloppeurs `a l’aide d’un mod`ele de confiance pourrait att´enuer l’impact de ces facteurs et am´eliorer la pr´ecision et le rappel des techniques RI. Notre hypoth`ese est que la pr´ecision et le rappel des techniques RI pourraient ˆetre am´elior´es si deux (ou plus) sources d’information confirment un lien de tra¸cabilit´e. Nous utilisons les donn´ees des r´ef´erentiels logiciels, les relations entre classes, le partitionnement du code source, et les connaissances des d´eveloppeurs comme sources d’informations suppl´ementaires pour confirmer un lien. Nous proposons quatre nouvelles approches de d´etection des liens de tra¸cabilit´e : Histrace, BCRTrace, Partrace et une derni`ere bas´ee sur les connaissances des d´eveloppeurs. Nous proposons un mod`ele de confiance, Trumo, inspir´e des mod`eles de confiance Web, pour combiner les votes des experts. Nous proposons alors quatre approche de recouvrement des liens de tra¸cabilit´e : Trustrace, LIBCROOS, COPARVO et une nouvelle m´ethode d’attribution de poids, qui utilisent les experts cr´e´es pr´ec´edemment et Trumo. Les approches propos´ees utilisent une technique de recherche d’information pour cr´eer des liens de r´ef´erence et utilisent l’opinion des experts pour r´e´evaluer ces liens de r´ef´erence.
Nous montrons que l’utilisation de plusieurs sources d’information am´eliore la pr´ecision et le rappel des techniques RI pour la tra¸cabilit´e des exigences. Les r´esultats obtenus dans cette th`ese montrent une am´elioration de jusqu’`a 22% de pr´ecision, 7% de rappel et 83% de
r´eduction d’effort des d´eveloppeurs pour la suppression manuelle de liens faux positifs. Les r´esultats obtenus dans cette th`ese sont prometteurs et nous esp´erons que d’autres recherches dans ce domaine pourraient am´eliorer notre pr´ecision et rappel encore plus.
ABSTRACT
Traceability is the only means to ensure that the source code of a system is consistent with its requirements and that all and only the specified requirements have been imple-mented. During software maintenance and evolution, as developers add, remove, or modify features (including bugs), requirement traceability links become obsolete because developers do not/cannot devote effort to update them. Yet, recovering these traceability links later is a daunting and costly task for developers. Consequently, the literature proposed methods, techniques, and tools to recover semi-automatically or automatically these traceability links. Among the proposed techniques, the literature showed that information retrieval (IR) tech-niques can automatically recover traceability links between free-text requirements and source code. However, precision and recall of IR techniques are impacted by some factors, which impact the input of requirements traceability process. Due to low precision and–or recall, developers’ confidence in the effectiveness of traceability link recovery technique is negatively affected.
In this dissertation, our thesis is that adding more sources of information using a trust-based model and integrating developers’ knowledge in automated IR-trust-based requirements traceability approaches could mitigate the impact of the factors and improve the precision and recall of IR techniques. Our conjecture is that the accuracy of information retrieval techniques could be improved if two (or more) sources of information vote for a link. We use software repositories’ data, binary class relationships, source code partitioning, and de-veloper’s knowledge as extra sources of information to confirm a link. We propose four approaches, Histrace, BCRTrace, Partrace, and developer’s knowledge, to create experts out of the available extra sources of information. We propose a trust-model, Trumo, inspired by Web trust-models of users, to combine the experts’ votes. We then propose four trace-ability link recovery approaches: Trustrace, LIBCROOS, COPARVO, and an improved term weighting scheme, which use the experts created by previous four techniques and Trumo. The proposed approaches use an IR technique to create the baseline links and use experts’ opinions to reevaluate baseline links.
We show that using more sources of information improve the accuracy of IR techniques for requirements traceability. The achieved results in this dissertation show up to 22% precision, 7% recall improvement and 83% reduction in developer’s effort for manually removing false-positive links. The results achieved in this dissertation are promising and we hope that further research in this field might improve the accuracy of IR techniques more.
TABLE OF CONTENTS
DEDICATION . . . iii
ACKNOWLEDGMENTS . . . iv
R´ESUM´E . . . v
ABSTRACT . . . vii
TABLE OF CONTENTS . . . viii
LIST OF TABLES . . . xiii
LIST OF FIGURES . . . xiv
LIST OF APPENDICES . . . xv
LIST OF ABBREVATIONS . . . xvi
CHAPTER 1 INTRODUCTION . . . 1
1.1 Problem and Motivation . . . 3
1.2 Creation of Experts from Each Source of Information . . . 5
1.3 Combining Experts’ Opinions . . . 6
1.4 Usage of Experts And Their Opinions . . . 6
1.5 Tool Support . . . 7
1.6 Organisation of the Dissertation . . . 9
I
Background
12
CHAPTER 2 INFORMATION RETRIEVAL PROCESS . . . 132.1 IR Process . . . 13
2.1.1 Pre-Processing . . . 14
2.1.2 Existing Term Weighting . . . 14
2.2 IR Techniques . . . 15
2.2.1 Vector Space Model . . . 16
2.2.3 Latent Dirichlet Allocation . . . 17
2.2.4 Jensen-Shannon Divergence Model . . . 18
2.3 Generation of Traceability Links’ Sets . . . 19
2.4 IR Performance Measures . . . 20
2.4.1 Precision and Recall . . . 20
2.4.2 F-Measure . . . 20
2.5 Statistical Hypothesis Testing . . . 21
2.5.1 Statistical Tests . . . 22
CHAPTER 3 RELATED WORK . . . 23
3.1 Traceability Approaches . . . 23
3.2 Feature Location . . . 26
3.3 Binary Class Relationships . . . 27
3.4 Web Trust Model . . . 28
3.5 Eye-Tracking . . . 29
3.6 Summary of Related Approaches . . . 30
II
Creation of Experts and Combining their Opinions
32
CHAPTER 4 CREATION OF EXPERTS . . . 334.1 Histrace . . . 33
4.2 BCRTrace . . . 35
4.3 Partrace . . . 37
4.4 Developer’s Knowledge . . . 38
4.5 Summary . . . 39
CHAPTER 5 COMBINING EXPERTS’ OPINIONS . . . 40
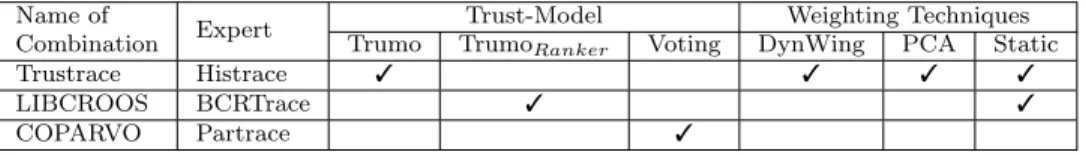
5.1 Definitions . . . 40 5.2 Trumo . . . 41 5.3 Voting . . . 42 5.4 Weighting Technique . . . 43 5.4.1 Static Weight . . . 43 5.4.2 DynWing . . . 44
5.4.3 Principal Component Analysis . . . 45
III
Usage of Experts and their Opinions
46
CHAPTER 6 ASSESSING TRUSTRACE AS A TRACEABILITY RECOVERY METHOD 47
6.1 Trustrace: Trust-based Traceability . . . 48
6.1.1 Usage of Histrace . . . 49
6.2 Empirical Evaluation . . . 49
6.2.1 Goal . . . 50
6.2.2 Research Questions . . . 50
6.2.3 Pre-Processing . . . 51
6.2.4 Building Sets of Traceability Links . . . 53
6.2.5 Experimental Settings . . . 53
6.2.6 Analysis Method . . . 54
6.3 Results . . . 55
6.4 Discussion . . . 58
6.4.1 Dataset Quality Analysis . . . 58
6.4.2 DynWing vs. MSW vs. PCA . . . 62
6.4.3 Number of Experts . . . 63
6.4.4 Other Observations . . . 64
6.4.5 Practical Applicability of Trustrace . . . 65
6.4.6 Revisiting the Conjectures . . . 65
6.4.7 Threats to Validity . . . 66
6.5 Summary . . . 66
CHAPTER 7 ASSESSING THE USEFULNESS OF TRUMO FOR BUG LOCATION 68 7.1 LIBCROOS . . . 69
7.1.1 LIBCROOS Abstract Model . . . 69
7.1.2 IR Engine . . . 70
7.1.3 Usage of BCRTrace . . . 71
7.1.4 T rumoRanker . . . 71
7.2 Empirical Study . . . 71
7.2.1 Research Questions, Hypothesis, and Variables . . . 72
7.2.2 Preparing Datasets for Experiments . . . 73
7.2.3 Linking Bugs Reports and Classes using VSM . . . 74
7.2.4 Linking Bugs Reports and Classes using LSI . . . 74
7.2.5 Linking Bugs Reports and Classes using LIBCROOS . . . 74
7.2.6 Analysis Methods . . . 75
7.3.1 Threats to Validity . . . 78
7.4 Summary . . . 80
CHAPTER 8 IMPLEMENTATION OF COPARVO-BASED REQUIREMENTS TRACE-ABILITY . . . 81 8.1 COPARVO . . . 82 8.1.1 Usage of Partrace . . . 82 8.2 Empirical Study . . . 83 8.2.1 Goal . . . 84 8.2.2 Research Questions . . . 84
8.2.3 Variables and Objects . . . 84
8.2.4 Usage of COPARVO . . . 85
8.2.5 Analysis Method . . . 86
8.3 Experiment Results . . . 87
8.4 Discussion & Qualitative Analysis . . . 90
8.4.1 Effort Reduction . . . 90 8.4.2 Ascertaining Experts . . . 90 8.4.3 Different Scenarios . . . 90 8.4.4 Role of Identifiers . . . 91 8.4.5 Threats to Validity . . . 92 8.5 Summary . . . 93
CHAPTER 9 USING DEVELOPERS’ KNOWLEDGE FOR IMPROVING TERM WEIGHT-ING SCHEME . . . 94
9.1 Empirical Study . . . 95
9.2 Experiment Design: Eye-Tracking . . . 96
9.2.1 Eye-tracking System . . . 97
9.2.2 Experiment Settings . . . 97
9.2.3 Subjects Selection . . . 97
9.2.4 Source Code Selection . . . 98
9.2.5 Links, Tasks, and Questionnaires . . . 99
9.2.6 Procedure . . . 99
9.2.7 Analysis And Result . . . 100
9.3 Experiment Design: SE/IDF and DOI/IDF . . . 103
9.3.1 Objects . . . 104
9.3.2 Procedure . . . 104
9.3.4 Results . . . 107 9.4 Discussion . . . 109 9.4.1 Identifiers’ Vocabulary . . . 110 9.4.2 Male vs. Female . . . 111 9.5 Threats to Validity . . . 111 9.6 Summary . . . 112
IV
Conclusion and Future Work
114
CHAPTER 10 CONCLUSION . . . 11510.0.1 Creation of Experts . . . 115
10.0.2 Combining Experts’ Opinion . . . 116
10.0.3 Usage of Experts and their Opinions . . . 116
10.1 Limitations . . . 118
10.2 Future Work . . . 119
REFERENCES . . . 121
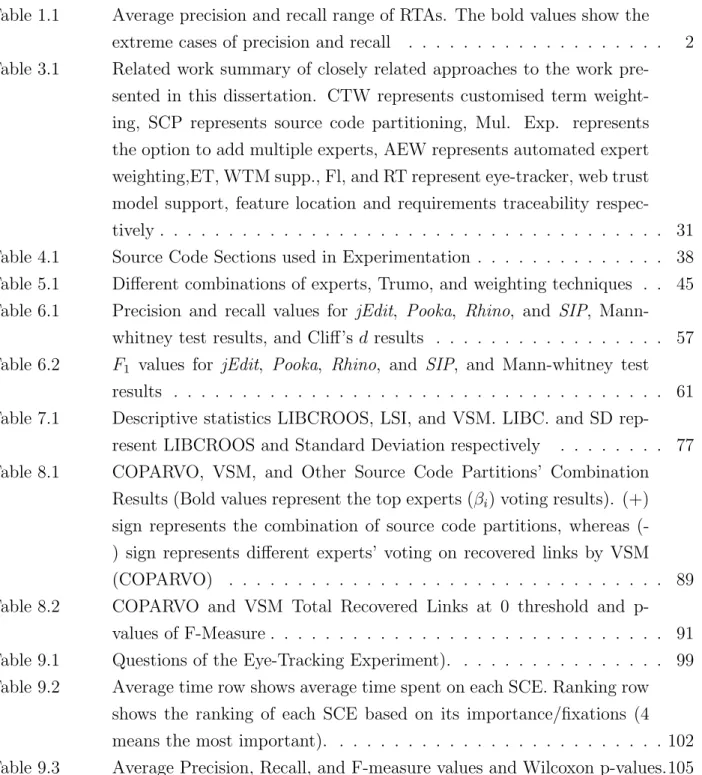
LIST OF TABLES
Table 1.1 Average precision and recall range of RTAs. The bold values show the extreme cases of precision and recall . . . 2 Table 3.1 Related work summary of closely related approaches to the work
pre-sented in this dissertation. CTW represents customised term weight-ing, SCP represents source code partitionweight-ing, Mul. Exp. represents the option to add multiple experts, AEW represents automated expert weighting,ET, WTM supp., Fl, and RT represent eye-tracker, web trust model support, feature location and requirements traceability respec-tively . . . 31 Table 4.1 Source Code Sections used in Experimentation . . . 38 Table 5.1 Different combinations of experts, Trumo, and weighting techniques . . 45 Table 6.1 Precision and recall values for jEdit, Pooka, Rhino, and SIP,
Mann-whitney test results, and Cliff’s d results . . . 57 Table 6.2 F1 values for jEdit, Pooka, Rhino, and SIP, and Mann-whitney test
results . . . 61 Table 7.1 Descriptive statistics LIBCROOS, LSI, and VSM. LIBC. and SD
rep-resent LIBCROOS and Standard Deviation respectively . . . 77 Table 8.1 COPARVO, VSM, and Other Source Code Partitions’ Combination
Results (Bold values represent the top experts (βi) voting results). (+)
sign represents the combination of source code partitions, whereas (-) sign represents different experts’ voting on recovered links by VSM (COPARVO) . . . 89 Table 8.2 COPARVO and VSM Total Recovered Links at 0 threshold and
p-values of F-Measure . . . 91 Table 9.1 Questions of the Eye-Tracking Experiment). . . 99 Table 9.2 Average time row shows average time spent on each SCE. Ranking row
shows the ranking of each SCE based on its importance/fixations (4 means the most important). . . 102 Table 9.3 Average Precision, Recall, and F-measure values and Wilcoxon p-values.105
LIST OF FIGURES
Figure 1.1 Inputs of traceability approach and impacting factors . . . 4
Figure 1.2 Excerpt of Factrace GUI . . . 9
Figure 2.1 IR-based RT Links Recovery Process . . . 13
Figure 5.1 Overlapping of R2C,R2CTi,rj,tk, and T r . . . 42
Figure 6.1 Trust-based requirement traceability process . . . 48
Figure 6.2 Excerpt of Pooka SVN Log . . . 53
Figure 6.3 Precision and recall values of JSM, Trustrace, and VSM, with the threshold t varying from 0.01 to 1 by step of 0.01. The X axis shows recall and Y axis shows precision. . . 56
Figure 6.4 Precision and recall values, with the thresholdt varying from 0.01 to 1 by steps of 0.01. The X axis shows precision values and Y axis recall values. DW represents the DynWing results. . . 59
Figure 6.5 Similarity between merged requirements and source code documents . . 60
Figure 6.6 Rhino precision and recall graph for T rustrace using one and two ex-perts. The X axis shows precision values and the Y axis recall values. . 63
Figure 7.1 High-level Diagram of LIBCROOS . . . 70
Figure 7.2 LIBCROOS, LSI, and VSM Results Boxplot Graph . . . 76
Figure 8.1 Top Experts for Traceability Link Recovery . . . 87
Figure 8.2 F-measure values at different level of threshold. These graphs only shows the highest F-measure results in different categories for the sake of simplicity. . . 88
Figure 9.1 FaceLAB eye-tracker excerpt . . . 98
Figure 9.2 Distribution of Average Correct Answers and Average Fixations . . . . 101
Figure 9.3 A heatmap showing the cumulative fixations of subjects. The colors red, orange, green and blue indicate the decrease in number of fixations from highest to lowest. . . 102
Figure 9.4 LSIT F/IDF, LSISE/IDF, and LSIDOI/IDF F-measure values of iTrust and Pooka . . . 108
LIST OF APPENDICES
Appendix A DATASETS STATISTICS . . . 131 Appendix B LIST OF PUBLICATIONS . . . 134
LIST OF ABBREVATIONS
AOI Area of Interest AST Abstract Syntax Tree BCR Binary Class Relationship BLT Bug Location Techniques BRCG Branch Reserving Call Graph Coparvo Code Partitioning and Voting
DOI/IDF Domain Or Implementation concepts/Inverse Document Frequency DynWing Dynamic Weighting
FacTrace Artefacts Traceability Tool Histrace Software Histories Traces IDF Inverse Document Frequency IR Information Retrieval
JSM Jensen-Shannon Divergence Model LDA Latent Dirichlet Allocation
LIBCROOS LInguistic (textual) and BCRs of Object-Oriented Systems
LOC Lines of Code
LSI Latent Semantic Indexing MSW Multiple Static Weights
OO Object-Oritented
PADL Patterns and Abstract-level Description Language
Ptidej Patterns Trace Identification, Detection, and Enhancement for Java RT Requirements Traceability
RTA Requirements Traceability Approach SCE Source Code Entity
SCP Source Code Partition
SE/IDF Source Code Entity/Inverse Document Frequency SVD Singular Value Decomposition
TF Term Frequency
Trumo Trust Model
Trustrace Trust-based Traceability TTP Trusted Third Party VSM Vector Space Model
CHAPTER 1
INTRODUCTION
Preliminary to any software evolution task, a developer must comprehend the project landscape (Dagenais et al. (2010)), in particular, the system architecture, design, imple-mentation, and the relations between the various artifacts using any available documenta-tion. Program comprehension occurs in a bottom-up manner (Pennington (1987)), a top-down manner (Brooks (1983)), or some combination thereof (Mayrhauser and Vans (1993)). Developers use different types of knowledge during program comprehension, ranging from domain-specific knowledge to general programming knowledge. Traceability links between source code and sections of the documentation, e.g., requirements, aid both top-down and bottom-up comprehension (De Lucia et al. (2006)).
Requirement traceability is defined as “the ability to describe and follow the life of a requirement, in both a forwards and backwards direction (i.e., from its origins, through its development and specification, to its subsequent deployment and use, and through all pe-riods of on-going refinement and iteration in any of these phases)” (Gotel and Finkelstein (1994)). Traceability links between the requirements of a system and its source code are helpful in reducing comprehension effort. This traceability information also helps in software maintenance and evolution tasks. For example, once a developer has traceability links, she can easily trace what software artifacts must be modified to implement a new requirement. Traceability links are also essential to ensure that a source code is consistent with its require-ments and that all and only the specified requirerequire-ments have been implemented by developers (Koo et al. (2005); Hayes et al. (2007)).
Despite the importance of traceability links, during software maintenance and evolution, as developers add, remove, or modify features, requirement traceability links become obsolete because developers do not/cannot devote effort to update them. This insufficient traceability information is one of the main factors that contributes to project over-runs, failure, and diffi-cult to maintain (Aliet al. (2011b); D¨omges and Pohl (1998); Leffingwell (1997)). Insufficient traceability information results in the need for costly and laborious tasks of manual recov-ery and maintenance of traceability links. These manual tasks may be required frequently depending on how frequently software systems evolve or are maintained.
Consequently, the literature proposed methods, techniques, and tools to recover semi-automatically or semi-automatically traceability links. Researchers used information retrieval (IR) techniques, e.g., (Abadi et al. (2008); Antoniol et al. (2002b); Marcus and Maletic (2003a)),
Table 1.1 Average precision and recall range of RTAs. The bold values show the extreme cases of precision and recall
VSM LSI JS LDA
Datasets Precision Recall Precision Recall Precision Recall Precision Recall
SCA Abadiet al. (2008) 20 – 43 51 – 76 14 – 26 41 – 78 23 – 41 57 – 78 – –
CORBA Abadiet al. (2008) 50 –80 68 – 89 11 – 50 14 – 61 43 – 65 55 – 81 – –
MODIS Sundaramet al. (2005) 7.9 75.6 4.2 – 6.3 63.4 – 92.6 – – – –
CM-1 Sundaramet al. (2005) 1.5 97.7 0.9 98.6 –98.8 – – – –
Easy Clinic Olivetoet al. (2010) 17 – 80 4 – 90 17 – 60 3 – 90 17 – 80 4 – 91 9 –40 20 –60
eTour Olivetoet al. (2010) 17 – 68 5 – 47 17 – 64 4 – 46 17 – 76 5 – 47 2– 16 1– 20
to recover traceability links between high-level documents, e.g., requirements, manual pages, and design documents, and low-level documents, e.g., source code and UML diagrams. IR techniques assume that all software artifacts are/can be put in some textual format. Then, they compute the textual similarity between each two software artifacts,e.g., the source code of a class and a requirement. A high textual similarity means that the two artifacts probably share several concepts and that, therefore, they are likely linked to one another.
The effectiveness of IR techniques is measured using IR metrics: recall, precision, or some average of both, e.g., F1 measure (Antoniol et al. (2002b); Hayes et al. (2004, 2008)).
For a given requirement, recall is the percentage of recovered links over the total number of pertinent, expected links, while precision is the percentage of correctly recovered links over the total number of recovered links. High recall could be achieved by linking each requirement to all source code entities, but precision would be close to zero. A high precision could be achieved by reporting only obvious links, but recall would be close to zero. Either extreme cases are undesirable because developers then would need to manually review numerous candidate links to remove false positive links and–or study the source code to recover missing links (Antoniol et al. (2002b)).
The tradeoff between precision and recall depends on the context in which IR technique is used. For example, search engines prefer precision over recall because a user usually only looks at the top 10 to 30 retrieved Web pages related to her query. A search engine user may not care if a Web page related to her query is missing. In contrast to search engines, a software engineer prefers recall over precision in requirements traceability (RT) because a high recall reduces error-prone manual search for missing traceability links. Empirical studies (Ali et al. (2012a)) on the precision and recall of automated traceability link recovery techniques have shown that when a high recall, e.g., 90%, is achieved then precision is usually less than 40% and in some cases is even less than 10%. Such low precision values in automated traceability-link recovery are a problem for developers. For example, 10% precision means that a software
engineer must look on average through ten candidate links to find a true positive link. The low precision is likely to negatively affect the software engineers’ trust in the accuracy of the automated traceability recovery approaches and increase manual effort.
1.1 Problem and Motivation
Table 1.1 summarises the precision and recall values of some requirements traceability approaches (RTAs) described in the literature are mainly: Vector Space Model (VSM), Latent Semantic Indexing (LSI), Rule-based, Jensen-Shannon similarity model (JSM), and Latent Dirichlet Allocation (LDA). It shows that, depending on the datasets, precision values vary from 0.9% to 95.9% and recall values vary from 3% to 99.8%. For example, Sundaramet al. (2005) achieved 1.5% to 7.9% precision with VSM whereas Abadiet al. (2008) achieved 50% to 80% precision with the same technique. Both group of researchers used standard VSM to obtain their results. The low precision and recall values are not only due to the use of one IR technique or another; the differences are due to the quality of RTAs’ inputs, i.e., requirements, source code, and developers’ programming knowledge (Ali et al. (2012a)).
In our previous study (Ali et al. (2012a)), we performed an incremental literature review (ILR) to understand the cause of the variations in precision and recall values for different RTAs. We observed that there exist some factors that impact RTAs’ inputs. We documented seven factors (see Figure 1.1), i.e., ambiguous requirement, vague requirement, conflicting requirement, granularity level, identifiers’ quality, domain knowledge, and programming lan-guage knowledge. We also showed that controlling, avoiding, and–or mitigating the impact of these factors could yield better RTAs accuracy. For each factor, we documented some preventive measures and–or techniques to improve the quality of RTA inputs.
Regardless the importance of controlling/avoiding RTAs’ input impacting factors, for some factors, e.g., identifiers’ quality, it would not be feasible to completely control/avoid their impact on RTAs’ inputs . Because the preventive measures and–or techniques (Aliet al. (2012a)) to improve the quality of RTA inputs are not 100% automated. A developer must manually verify the quality of all these inputs at the end of a RT process. For example, Dit et al. (2011a) performed an empirical study on feature location using different splitting algorithms. Their results showed that manually splitting identifiers could provide better results. However, manually splitting identifiers would require a lot of developer’s effort. The authors argued that adding execution trace information could yield better accuracy than manually splitting identifiers. Poshyvanyk et al. (2007) also showed that for feature location, combining execution traces’ information with IR techniques improves the accuracy of IR techniques. Many other researchers (Poshyvanyk et al. (2007); Dit et al. (2011a); Gethers
Figure 1.1 Inputs of traceability approach and impacting factors
et al. (2011)) also discussed the importance of adding more sources of information. However, their model to combine different experts was not generalised and they did not consider adding more than two unique sources of information. In addition, to the best of our knowledge, adding more sources of information in the field of requirements traceability has not been analysed yet. Thus, our thesis is:
Adding more sources of information and combining them with IR techniques could im-prove the accuracy, in terms of precision and recall, of IR techniques for requirements traceability.
To prove our thesis, we use each source of information as an expert to vote on some baseline links recovered by an IR technique. The higher the number of experts voting (Poshyvanyk et al. (2007); Ali et al. (2011b)) for a baseline link, the higher the confidence in the link. We get inspiration from Web models of users’ trust (Berg and Van (2001); McKnight et al. (2002); Palmer et al. (2000); Koufaris and Hampton-Sosa (2004)): the more users buy from a Web merchant and–or refer the Web merchant, the higher the users’ trust would be on the Web merchant. In other words, if more sources of information, e.g., friends, family, online reviews, third party guarantees, refund policies etc., are “positively” recommending a Web merchant the higher an online buyer’s trust would be. We apply the same idea to RTAs and use software repositories data, binary class relationship, source code entities, and developer’s knowledge as extra source of information to trust a link recovered by an IR technique.
Following, we describe the steps to create experts using available sources of information. Each expert has its own trust-value for each baseline link. We propose a trust-model to combine the trust-values of each expert to reevaluate a baseline link. We propose different approaches to use the opinion of these experts.
1.2 Creation of Experts from Each Source of Information
We define four main approaches, i.e., Histrace, LIBCROOS, COPARVO, and developer’s knowledge, to create experts with the extra source of information.
Histrace: While developers may not evolve requirements in synchronisation with source code, they frequently update software repositories, e.g., CVS/SVN, Bugzilla, mailing lists, forums, and blogs, to keep track and communicate about their changes. We conjecture that we can mine software repositories to build improved traceability link recovery techniques. We show that mining software repositories and combining the mined data with the results of some IR techniques allow recovering traceability links with better accuracy than when using IR techniques alone because of the multiple sources of information. To confirm our conjecture, we propose Histrace, a mining technique to create experts using CVS/SVN commits and bug reports and an IR-based technique. Histrace links, e.g., HistraceBugs, act as expert to
reevaluate baseline links recovered by IR technique.
BCRTrace: In some projects, software repositories are not available and–or not up-to-date. In this situation, Histrace may not be effective to create experts. Thus, we propose BCRTrace that uses Binary Class Relationships (BCRs) of Object-oriented (OO) systems, to create experts. Our conjecture behind BCRTrace is that when developers implement a feature, they usually use some BCRs among the classes playing role to implement a feature. BCRTrace uses BCR among the classes acts like an expert to reevaluate the baseline links. Partrace: It is quite possible that developers may not use all BCRs to implement a fea-ture. Thus, in this case BCRTrace may not be effective in creating experts. To handle such situation, we propose Partrace (Partitioning Source Code for Traceability). Our conjecture behind Partrace is that information extracted from different source code partition (e.g., class names, comments, class variables, or methods signatures) are different information sources; they may have different level of reliability in RT and each information source may act as a different expert recommending traceability links. Thus, using each partition as a separate expert to vote on baseline links could yield better accuracy. Partrace divides a source code file into different partitions and each partition acts as an independent expert. In this disser-tation, we divide source code into four parts, class name, method name, variable name, and comments. A developer could define the granularity of an expert. For example, if she wants to use each source code line as a separate partition/expert.
Developers’ Knowledge: IR-based RTAs are automatic to recover traceability links. How-ever, it does not free a developer to manually verify a link or recovery any missing link. It shows that developers’ knowledge is still required and better than the automated techniques.
Thus, the knowledge of a developer could be used as extra source of information. We con-jecture that understanding how developers verify RT links could help improve the accuracy of IR-based approaches to recover RT links. To confirm our conjecture, we use developers’ knowledge as an extra source of information to integrate into automated techniques. We use an eye-tracking system to capture developers’ eye movements while they verify traceability links. We observe which source code part has more importance than the other for a developer. We use an eye-tracker to capture developers’ eye movement while they perform RT task. We integrate their source code preferences into IR weighting scheme.
1.3 Combining Experts’ Opinions
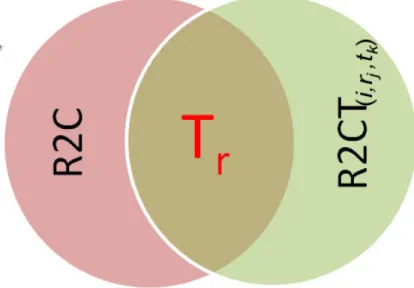
We must combine each expert’s opinion to reevaluate the similarity of baseline links recovered by an IR technique. To combine different experts’ opinion, we propose a trust model, i.e., Trumo. Trumo takes two inputs, i.e., baseline RT links recovered by an IR technique and RT links recovered by experts, to generate a new set of trustable links. First, Trumo takes a baseline link created by an IR technique as an initial trustable link. Second, RT links recovered by experts, e.g., CVS/SVN commits, vote on the baseline links. Each expert has its own trust-value for each baseline link. Trumo discards a link if no expert votes for it. Third, Trumo combines the opinions (trust-values) of all experts to generate a new trustable set of RT links. If more experts vote for a link then Trumo mark that link as more trustable than the others. Lastly, it uses a weighting scheme to assign weight to each expert and combine their opinions.
1.4 Usage of Experts And Their Opinions
Now that we have experts and trust-model to combine their opinions, we describe the usage of the experts and their opinions. Each approach is independent and use one expert, e.g., Histrace or Partrace, at a time.
– We propose Trustrace, a trust-based traceability recovery approach, in terms of experts and trust-model. Trustrace uses software repositories’ data as more sources of informa-tion to reevaluate a baseline link created by an IR technique. Trustrace uses experts created by Histrace and combine their opinion using Trumo. DynWing is a weight-ing technique to dynamically assign weights to each expert givweight-ing their opinions about the recovered links. The results of this contribution were published in Transactions in Software Engineering (Ali et al. (2012b)) and 19th IEEE International conference on Program Comprehension (ICPC’11) (Ali et al. (2011b)).
– LIBCROOS uses BCRTrace to reevaluate baseline traceability links recovered by an IR technique. To exploit the benefits and application of Trumo, we customise it to integrate BCRTrace for bug location. Trumo provides a model to combine various experts, e.g., software repositories. LIBCROOS helps to put culprit classes at the top in the ranked list. More BCRTrace expert vote for a link more Trumo puts that link at the top in the ranked list. The results of this contribution are published in 12th
IEEE International Working Conference on Source Code Analysis and Manipulation (SCAM’12) (Ali et al. (2012c)).
– COPARVO uses experts created by Partrace combined with an IR technique to create links between requirements and source code. Each expert created by Partrace, e.g., class name or method name, could vote on the links recovered by an IR technique to remove false positive links. In COPARVO, at least two experts must agree on a link to keep the link. COPARVO uses a technique to identify top two experts that must agree on a baseline link. The results of this contribution were published in 18th Working Conference on Reverse Engineering (WCRE’11) (Ali et al. (2011a)).
– We use developer’s knowledge observed during eye-tracking experiment as an extra source. We use this extra source of information to propose two new weighting schemes called SE/IDF (source code entity/inverse document frequency) and DOI/IDF (do-main or implementation/inverse document frequency) to recover RT links combined with an IR technique. SE/IDF is based on the developers preferred source code entities (SCEs) to verify RT links. DOI/IDF is an extension of SE/IDF distinguishing do-main and implementation concepts. We use LSI combined with SE/IDF,DOI/IDF, and T F/IDF to show, using two systems, iTrust and Pooka, that LSIDOI/IDF
statis-tically improves the accuracy of the recovered RT links over LSIT F /IDF. The results
of this contribution were published in 28th IEEE International Conference on Software
Maintenance (ICSM’12) (Ali et al. (2012d)). 1.5 Tool Support
The methods and techniques presented in this dissertation have been partially and–or fully implemented and integrated in FacTrace1, for artifact TRACEability (Ali et al. (2010,
2011a,b, 2012c,d)). Figure 1.2 shows an excerpt of Factrace user interface. FacTrace is an 1. http://www.factrace.net
IR-based RT link recovery tool. It supports several IR techniques, namely VSM, LSI, LDA, and JSM. FacTrace allows developers to select the source and target artifacts to recover traceability links between them. FacTrace uses an external Java parser to extract all the source code identifiers for further processing. A developer can set various parameters in FacTrace to achieve desired results. For example, she can select the weighting schemes for an IR technique, IR technique, and thresholds etc. Threshold selection helps to retrieve only a set of traceability links whose similarity is above than a certain level.
FacTrace provides several modules that help from traceability recovery to traceability links verification. FacTrace aids software engineers in different tasks, namely, requirement elicitation, requirement analysis, artifact traceability, and trust-based traceability (Ali et al. (2011b)). FacTrace has a graphical interface to perform different tasks. Following sections give you a brief description of different features of FacTrace.
Requirement Elicitation: FacTrace currently supports Limesurvey2 to gather require-ments. Customers’ requirements will automatically be stored in a database. Customers can write or upload their requirements in FacTrace specified XML format. FacTrace performs similarity analysis for all the elicited requirements. Similarity analysis helps developers to see if a single customer or multiple customers wrote the same requirement twice. It helps to remove the duplicated requirements. The similarity analysis is backed-up by clustering ap-proaches,i.e., agglomerative hierarchical clustering (Day and Edelsbrunner (1984)), to group similar requirements in a single cluster.
Requirement Analysis: FacTrace enables users to perform requirement analysis in few mouse clicks. A developer can see all similar requirements and label them. She can write a label or simply click on a specific requirement; it will automatically be placed in a text area to save time. In addition, she can also categorise each requirement as functional, non-functional, or an outlier. She can mark a requirement as duplicate if she thinks the current requirement is somehow semantically similar to another requirement. If any requirement has not been negotiated with a customer, developer can delete that requirement during requirement analysis.
Traceability Management: FacTrace helps in recovering traceability links between differ-ent software artifacts. For example, traceability links among requiremdiffer-ents, source code, and CVS/SVN change logs. FacTrace allows experts to create new manual traceability links as well. It supports different level of granularity for creating traceability links. A developer can write a description for each link and other identifiers specifications as well.
Traceability Links Verification: To avoid bias when recovering traceability links, Fac-2. https://www.limesurvey.org
Figure 1.2 Excerpt of Factrace GUI
Trace allows developers to vote on the recovered link by an IR technique and–or proposed approaches. It allows adding up to five developers for voting on each link. If three or more than three developers accept a link, then a link will be considered as a valid link by Fac-Trace. A developer can change their voting option at any time. All other developers’ voting is hidden to avoid bias. She can see source code files in the source code viewer of FacTrace to verify each link.
Requirement Elicitation / Traceability Reports: FacTrace provides easy to understand tabular reports for requirement elicitation and traceability links. Reports can be exported in XML and CSV format. Reports are dynamically generate. All reports are updated as soon as a developer makes a change in a project.
1.6 Organisation of the Dissertation
The rest of this dissertation is organised as follows.
Chapter 2 – Background: This chapter presents the techniques and concepts that we use in this dissertation. The chapter starts by briefly describing the IR-based RT links recovery process. We explain the IR techniques that we use in this dissertation. The chapter continues with introducing different IR accuracy measurement to compare our proposed approaches
with the state-of-the-art approaches. Next, it explains the statistical tests that we use to compare the accuracy of two given approaches.
Chapter 3 – Related Work: This chapter presents the concepts and research areas that are related to our research. The chapter starts by briefly presenting state-of-the-art traceabil-ity recovery approaches, Web trust model, document zoning, and the usage of eye-tracking system in software maintenance.
Chapter 4 – Creation of Experts: This chapter starts by describing how we could create multiple experts using existing sources of information. This chapter describes four more main approaches, i.e., Histrace, LIBCROOS, COPARVO, and developer’s knowledge, to create experts.
Chapter 5 – Combining Experts’ Opinions: This chapter described a trust model, i.e., Trumo, to combine different experts’ opinion to reevaluate the trustworthiness of a link created by an IR technique.
Chapter 6 – Assessing Trustrace as a Traceability Recovery Method: This chap-ter explains that mining software repositories and using them as experts could yield betchap-ter accuracy for RT. The chapter explains the mathematical model of the proposed solution for RT. It provides the details on experimental design and comparison of proposed approaches to the existing IR techniques.
Chapter 7 – Assessing the Usefulness of Trust Model: This chapter presents a different maintenance application, i.e., bug location, of the proposed Trumo model (see Chapter 5). The chapter starts by explaining the usage of binary class relationships as experts to improve the accuracy of IR techniques for bug location. The chapter details on the slightly modified version of Trustrace for bug location and presents empirical study. The chapter continues with a discussion on the results and proposed approach for bug location.
Chapter 8 – Implementation of Coparvo-based Requirements Traceability: This chapter presents the concept of partition source code and using them as experts to vote on the traceability links recovered by an IR technique. The chapter starts by presenting the proposed approach,i.e., COPARVO. It continues with the empirical experimental comparison of COPARVO with an IR technique. The chapter concludes with the discussion on results achieved with the COPARVO.
Chapter 9 – Using Developers’ Knowledge for Improving Term Weighting Scheme: This chapter presents an empirical study with two controlled experiment on RT. The first part of the chapter provides the details on the first experiment with human subject. It continues with the experiment design, results, and findings of the experiments. The second
part of the chapter explains a new weighting scheme based on the results achieved in first experiment. The chapter continues by providing details on second experiment. The chapter concludes based on the results and discussion of both experiments.
Chapter 10 – Conclusion and Future Work: This chapter revisits the main thesis and contributions of this dissertation. The chapter continues by describing potential opportunities for future research.
Appendix A: It provides the brief description of the data sets we used in this dissertation. It also provides the details on the procedure of creating manual oracles.
Part I
CHAPTER 2
INFORMATION RETRIEVAL PROCESS
This chapter provides the details of the three main techniques, i.e., IR techniques, IR performance measures, and statistical tests, which we used in this dissertation. First, we briefly explain IR-based RT recovery process and IR techniques, i.e., VSM, LSI, LDA, and JSM. Second, we explain the IR performance measures, i.e., precision, recall, and F-Measure, which we use to compare the accuracy of an approach with some existing IR techniques. Third, we explain the statistical tests that we use to assess the improvement of proposed approaches.
2.1 IR Process
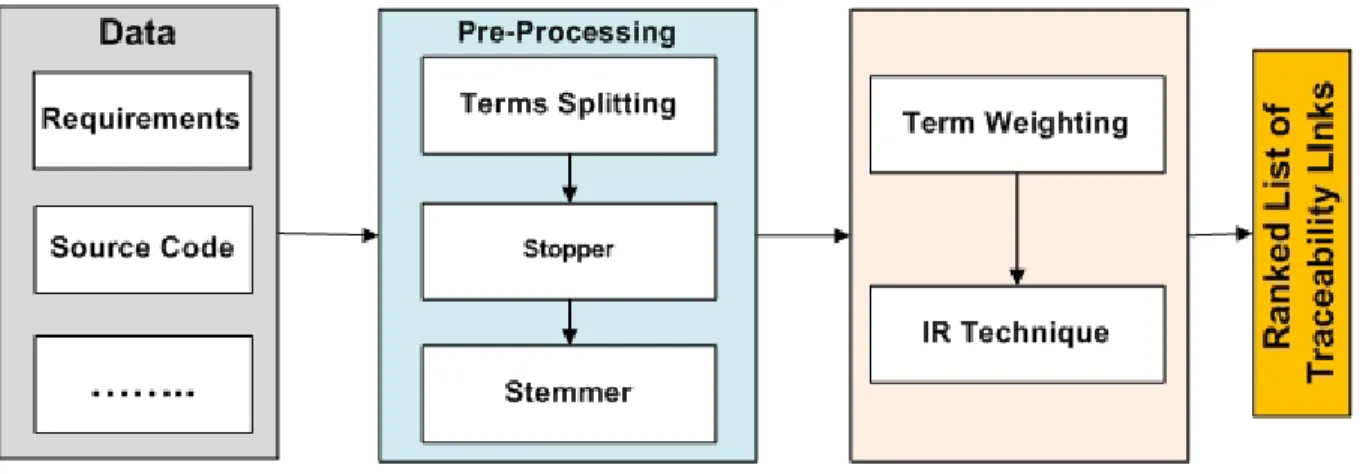
IR-based RTAs process is typically divided into three main steps (Antoniolet al. (2002b)). Figure 2.1 shows the high-level diagram of IR-based RT links recovery process. First, all the textual information contained in the requirements and source code is extracted and pre-processed by splitting terms, removing stop words and remaining words are then stemmed to its grammatical root. Second, all the stemmed terms are weighted using a term weighting scheme, e.g., term frequency and inverse document frequency. Last, an IR technique com-putes the similarity between requirements and source code documents. Lastly, it generates a ranked list of potential traceability links. A high similarity between two documents shows a potential semantic link between them. Below we will explain each step in details:
2.1.1 Pre-Processing
To create traceability links, we extract all the identifiers1 from source code and terms
from requirements. In this dissertation, we use some IR techniques as an engine to create links between requirements and source code. IR techniques assume that all documents are in textual format. To extract source code identifiers, we use a source code parser, e.g., a Java parser. The parser discards extra information, e.g., primitive data types and language specific keywords, from the source code (Aliet al. (2011a)) and provides only identifier names. The extraction of the identifiers and terms is followed by a filtering, stopper, and stemmer process.
First, a text normalisation step converts all upper-case letters into lower-case letters. This step removes non-textual, i.e., some numbers, mathematical symbols, brackets, etc., information and extra white spaces, from the documents. Some identifiers/terms could be combined with some special characters, e.g., under score, and–or CamelCase naming con-vention. Therefore, we split all the joined terms to make them separate terms. For example, SendMessage and send message are split into the terms “send message”.
Second, the input of this step is normalised text that could contain some common words, e.g., articles, punctuation, etc. These common words are considered as noise in the text because it does not represent semantics of a document. Thus, in this step, we use a stop word list to remove all the stop words. In this dissertation, we used English language stop words list as all our documents are in English.
The third step is stemming. An English stemmer, for example, would identify the terms “dog”, “dogs” and–or “doggy” as based on the root “dog”. In this dissertation, we use the Porter stemmer (Porter (1997)). An IR technique computes the similarity between two documents based on similar terms in both documents. However, due to different postfix, IR techniques would consider them,e.g., access, accessed, as two different terms and it would result into low similarity between two documents. Thus, it becomes important to perform morphological analysis to convert plural into singular and to bring back inflected forms to their morphemes. 2.1.2 Existing Term Weighting
An IR technique converts all the documents into vectors to compute the similarities among them. To convert documents terms into vectors, each term is assigned a weight. Various schemes for weighting terms have been proposed in literature (Abadi et al. (2008); Antoniol et al. (2002b); of Dayton Research Institute (1963)). Widely used weighting schemes are characterised in two main categories: probabilistic (of Dayton Research Institute (1963)) and 1. In the following, we use term identifiers to refer all source code entities,i.e., class name, method name, variable name, and comments.
algebraic models (Antoniol et al. (2002b)). Probabilistic weighting models heavily depends on probability estimations of terms and algebraic weighting models depends on terms distri-bution in a document and–or whole corpora. However, in both weighting schemes following two main factors are considered important:
– Term frequency (TF): TF is often called local frequency. If a term appears multiple times in a document then it would be assigned higher TF than the others.
– Global frequency (GF): If a word appears in multiple documents then the term is not considered representative of documents content. The global frequency is also called inverse document frequency (IDF).
Early IR techniques used TF to link two documents. If a term appears multiple times in a single or multiple documents then IR technique would recommend that document as relevant document to a query. However, multiple occurrences of a term do not show that it is important term. Jones (1972) proposed IDF to reduce the weight of a term if a term appears in multiple documents. TF is calculated as:
T F = Pni,j
knk,j
where ni,j is the occurrences of a term ti in document dj and Pknk,j is the sum of the
occurrences of all the terms in document dj.
The IDF of a term is computed as:
IDF = log
|
D| |d:ti ∈d|
where |D| is the total number of documents d in the corpus, and |d : ti ∈ d| is the number
of documents in which the term ti appears. In this dissertation, we use T F/IDF weighting
scheme.
2.2 IR Techniques
In this dissertation, to build sets of traceability links, we use some IR techniques, in particular VSM(Antoniol et al. (2002b)), LSI( Marcus et al. (2003)), and JSM (Abadi et al. (2008)). To identify concepts in the source code, we use LDA (Asuncionet al. (2010)). Abadi et al. (2008) performed experiments using different IR techniques to recover traceability links. Their results show that the VSM and the JSM outperform other IR techniques. In addition, these two techniques do not depend on any experimental value for tuning on some particular dataset. Thus, in this dissertation, we use JSM and VSM to recover traceability links in most of our experiments. Both techniques essentially use term-by-document matrices.
Consequently, we choose the well-knownT F/IDF weighting scheme (Antoniolet al. (2002b)) for the VSM and the normalised term frequency measure (Abadi et al. (2008)) for the JSM. These two measures and IR techniques are state-of-the-art for traceability. In the following, we explain all the techniques and weighting in details.
2.2.1 Vector Space Model
Many traceability links recovery techniques (Antoniol et al. (2002b); Baeza-Yates and Ribeiro-Neto (1999a); Lucia et al. (2007)) use VSM as baseline algorithm. In a VSM, docu-ments are represented as vector in the space of all the terms. Various term weighting schemes can be used to construct these vectors. If a term belongs to a document then it gets a non-zero value in the VSM along the dimension corresponding to the term. A document collection in VSM is represented by a term by document matrix, i.e., m ∈ n matrix, where m is the number of terms and n is the number of documents in the corpus.
Once documents are represented as vectors of terms in a VSM, traceability links are created between every two documents, e.g., a requirement and a source code class, with different similarity value depending on each pair of documents. The similarity value between two documents is measured by the cosine of the angle between their corresponding vectors. Cosine values are in [−1,1] but negative values are discarded and a link has thus a value in ]0,1] because similarity cannot be negative and zero between two documents. Finally, the ranked list of recovered links and a similarity threshold are used to create a set of candidate links to be manually verified (Antoniol et al. (2002b)). The angle between two vectors is used as a measure of divergence between the vectors. If R is a requirement vector and C is a source code vector, then the similarity of requirement to source code can be calculated as follows (Baeza-Yates and Ribeiro-Neto (1999a)):
sim(R, C) = R · C ||R|| · ||C|| = P ti∈RwtiR · P ti∈CwtiC q P ti∈Rw 2 tiR · q P ti∈Cw 2 tiC
where wtiR is the weight of the i
th term in the query vector R, and w
tiC is the weight of the
ith term in the query vector C. Smaller the vector angle is, higher is the similarity between
two documents.
2.2.2 Latent Semantic Indexing
VSM has a limitation, it does not address the synonymy and polysemy problems and relations between terms (Deerwester et al. (1990)). For example, having a term “home”
in one document and “house” in another document results in non-similar documents. LSI takes into account the association between terms and documents to overcome synonymy and polysemy problems. LSI assumes that there is an underlying latent structure in word usage for every document set (Deerwester et al. (1990)). The processed corpus is transformed into a term-by-document (m ∈ n) matrix A, where each document is represented as a vector of terms. The values of the matrix cells represent the weights of the terms, which could be computed using the traditional TF/IDF weighting schemes.
The matrix is then decomposed, usingSingular Value Decomposition (SVD) (Deerwester et al. (1990)), into the product of three other matrices:
A=U×S×V
where U is the m×r matrix of the terms (orthogonal columns) containing the left singular vectors, V is the r×n matrix of the documents (orthogonal columns) containing the right singular vectors, S is an r×r diagonal matrix of singular values, and r is the rank of A. To reduce the matrix size, all the singular values in S are ordered by size. All the values after the first largest k value could be set to zero. Thus, deleting the zero rows and columns of S
and corresponding columns ofU and rows ofV would produce the following reduced matrix:
Ak =Uk×Sk×Vk
where the matrix Ak is approximately equal to A and is of rank k < r. The choice of k
value, i.e., the SVD reduction of the latent structure, is critical and still an open issue in the natural language processing literature (Deerwester et al. (1990); Marcus et al. (2003)). We want a value of k that is large enough to fit all the real structures in the data but small enough so we do not also fit the sampling error or unimportant details in the data.
2.2.3 Latent Dirichlet Allocation
Automatically discovering the core concepts of data has stimulated the development of dimensionality reduction techniques,e.g., LSI. Hofmann proposed probabilistic version of LSI (Hofmann (1999)) (PLSI) that has a more solid statistical foundation than LSI, because it is based on the likelihood principle and defines a proper generative model of the data. Blei et al. (2003) proposed a fully generative Bayesian model known as LDA. LDA overcomes the PLSI issues, e.g., over-fitting, and achieves better results than PLSI (Hofmann (2001)). Thus, in this dissertation, we use LDA to discover the core concepts of the data.
LDA is an unsupervised machine learning technique that does not require any training data to train itself. The only required input to LDA is some tuning parameters. LDA
considers that documents are represented as a mixture of words acquired from different latent topics, where each topic T is characterised by a distribution of words W.
In particular, LDA takes the following inputs: – D, documents;
– k, number of topics;
– α, Dirichlet hyperparameter for topics’ proportions; – β, Dirichlet hyperparameter for topics’ multinomials;
A term-topic probability distribution (φ) is drawn from Dirichlet distribution with hyper-parameter β. A document D is associated with the topic-document probability distribution Θ drawn from a dirichlet with hyperparameter α. Hyperparameter values typically are set according to the de-facto standard heuristics: α = 50/kandβ = 0.01 orβ = 0.1 (Griffiths and Steyvers (2004); Wei and Croft (2006)). Biggers et al. (2012) performed an extensive study on feature location using LDA. They analysed the impact of different parameters of LDA on feature location. Their results show, which LDA parameters would be good for different size of datasets.
2.2.4 Jensen-Shannon Divergence Model
The JSM is an IR technique proposed by Abadiet al. (2008). It is driven by a probabilistic approach and hypothesis testing technique. JSM represents each document through a prob-ability distribution, i.e., normalised term-by-document matrix. The probability distribution of a document is:
pbi,j =
n(w, d)
Td
where n(w, d) is the number of times a word appears in a document d and Td is the total
number of words appearing in a document d. The empirical distribution can be modified to take into account the term’s global weight, e.g., IDF. After considering the global weight, each document distribution must be normalised as:
pi,j =
pbi,j·IDFi,j
Pn
i=0pbi,j ·IDFi,j
where pbj and IDFj is the probability distribution and inverse document frequency of ith
term in jth document, respectively.
Once the documents are represented as probability distribution, JSM computes the dis-tance between two documents’ probability distribution and returns a ranked list of traceability links. JSM ranks source documents,e.g., requirements, via the “distance” of their probability distributions to that of the target documents, e.g., source code:
J SM(q, d) = H pq+pd 2 − H(pq) +H(pd) 2 H(p) = Xh(p(w)) h(x) = −xlogx
whereH(p) is the entropy of the probability distributionp, andpq and pd are the probability
distributions of the two documents (a “query” and a “document”), respectively. By definition,
h(0) ≡ 0. We compute the similarity between two documents using 1−J SM(q, d). The similarity values are in ]0,1].
2.3 Generation of Traceability Links’ Sets
To evaluate the effectiveness of two RTAs, we generate various traceability links’ sets at different thresholds. We then use these sets to compute precision, recall, and–or F-Measure values. These sets help us to evaluate, which approach is better than the other at all the threshold values or some specific thresholds values. We perform several experiments with different threshold values on the recovered links, by two RTAs, to perform statistical tests. In literature following three main threshold strategies have been proposed by researchers: Scale threshold: It is computed as the percentage of the maximum similarity value between two software artifacts, where threshold t is 0 ≤t≤1 (Antoniol et al. (2002b)). In this case, the higher the value of the threshold t, the smaller the set of links returned by a query. Constant threshold: It (Marcus and Maletic (2003b)) has values between [0,1]; a good and widely used threshold is t = 0.7. However, if the maximum similarity between two software artifacts is less than 0.7 then this thresholdt = 0.7 would not be suitable.
Variable threshold: This is an extension of the constant threshold approach (De Lucia et al. (2004)). When using a variable threshold, the constant threshold is projected onto a particular interval, where the lower bound is the minimum similarity and upper bound is the maximum similarity between two software artifacts. Thus, the variable threshold has values between 0% to 100% and on the basis of this value the method determines a cosine threshold. In this dissertation, we use scale threshold. We use a threshold t to prune the set of traceability links, keeping only links whose similarities values are greater than or equal to
t ∈]0,1]. We use different values of tfrom 0.01 to 1 per step of 0.01 to obtain different sets of traceability links with varying precision, recall, and–or F-measure values, for all approaches.
2.4 IR Performance Measures
Now we describe the IR metrics that we use to compute the accuracy of each set using IR-based metrics.
2.4.1 Precision and Recall
We use two well-known IR metrics, precision and recall, to evaluate the accuracy of our experiment results. Both measures have values in the interval [0,1]. Precision and recall values are calculated for all the traceability links retrieved above a threshold. A developer could define threshold value based on the project scope and–or retrieved documents.
P recision = |{relevant documents} ∩ {retrieved documents}| |{retrieved documents}|
Precision is defined as the total number of relevant documents retrieved divided by the total number of retrieved documents by an approach. Precision considers all retrieved docu-ments above than the threshold value. This measure is called precision at n or P@n. If the value is 1 for precision it means that all the recovered documents are correct.
Recall = |{relevant documents} ∩ {retrieved documents}| |{relevant documents}|
Recall is defined as the relevant documents retrieved divided by the total number of rele-vant documents. Documents could be a query or result of query execution. It is ratio between the number of documents that are successfully retrieved and the number of documents that should be retrieved. If the value is 1 for recall, it means all relevant documents have been retrieved.
2.4.2 F-Measure
The precision and recall are two independent metrics to measure two different accuracy concepts. F-measure is the harmonic mean of precision and recall that is computed as:
F = 2×P ×R
P +R
where P is the precision, R is the recall of retrieved documents and F is the harmonic mean of P and R. This F-measure is also known as F1 measure. In F1 measure, precision and
The function F assumes values in the interval [0,1]. It is 0 when no relevant documents have been retrieved and is 1 when all retrieved documents are relevant. Further, the harmonic mean F assumes a high value only when both recall and precision are high. Therefore, determination of the maximum value for F can be interpreted as an attempt to find the best possible compromise between recall and precision (Baeza-Yates and Ribeiro-Neto (1999b)).
The generic formula of F-measure is:
Fβ = (1 +β)×
P ×R
β×P +R
where β is a parameter that can be tuned to weight more precision over recall or vice versa. For example,F2 weights recall twice as much as precision and F0.5 weights precision twice as
much as recall.
2.5 Statistical Hypothesis Testing
In this dissertation, to evaluate the effectiveness of an approach and measure the improve-ment brought by the approach, we perform empirical experiimprove-ments. We use the IR metrics, e.g., precision and recall, to measure any improvement. The results could be improved on an average at certain threshold points. However, average does not give much insight of the actual improvement. Statistical tests provide the in depth analysis of data points to measure the improvement.
To perform statistical test, first, we pose a null hypothesis, e.g., there is no difference in the recall of the recovered traceability links when using LSI or VSM, that we want to reject. To reject a null hypothesis, we define a significance level of a test, i.e., α. It is an upper bound of the probability for rejecting the null hypothesis. We reject a null hypothesis if the result value of a statistical test is below the significance level, e.g., 0.05. We accept alternate hypothesis, e.g., there is a difference in the recall of recovered links when using LSI or VSM, or provide an explanation if we do not reject null hypothesis. Second, to select an appropriate statistical test we analyse the distribution of data points. Lastly, we perform a statistical test to get a probability value, i.e., p-value, to verify our hypothesis. p-value is compared against the significance level. We reject null the hypothesis if the p-value is less than significance level.
In this dissertation, we perform paired-statistical tests to measure the improvements brought by an approach over an existing approach. In paired-statistical test, two chosen approaches must have the same number of data points on the same subjects. Therefore, we use the same thresholdtvalue for both approaches. For example, if we want to compare VSM and LSI then if VSM discards all traceability links whose textual similarity values are below
than the 0.83 threshold, then we also use the same 0.83 as upper threshold for LSI. Then, we assess whether the differences in precision, recall, and–or F-measure values, in function of t
(see Section 2.3), are statistically significant between the two approaches.
Following we provide the details on creating the traceability links sets and using them to evaluate the effectiveness of proposed approaches.
2.5.1 Statistical Tests
We perform appropriate statistical tests to analyse whether the improvement in accuracy with proposed approach is indeed an improvement or it is by chance. In the following, we discuss the statistical tests we use in this dissertation.
Shipro-Wilk Test:
There are two types of data,i.e., normally distributed and any other distribution, and two types of statistical analysis, i.e., parametric and non-parametric tests. Parametric tests are for normally distributed data and nonparametric tests are for any other data distribution. Pre-requisite to perform/select any statistical test is to assess the normality of the data distribution. In this dissertation, we use Shipro-Wilk test (Shapiro and Wilk (1965)) to analyse the distribution of the data. The Shapiro-Wilk test calculates whether a random sample, e.g.,S1, S2. . . Sn comes from a normal distribution.
Mann-Whitney Test:
The Mann-Whitney (Wohlinet al. (2000)) is also known as the Wilcoxon Rank sum test; because it is directly related to the sum of ranks. Mann-Whitney assesses how many times a set Y precedes a set X in two samples. It is a non-parametric test and an alternative to the two-sample student’s t-test. Mann-Whitney is a robust statistical test that could also be used for small sample sizes, e.g., 5 to 20 samples. It could also be used when the sample values are captured using an arbitrary scale which cannot be measured accurately.
Kruskal-Wallis Test:
The Kruskal-Wallis rank sum test (Wohlin et al. (2000)) is a non-parametric method for testing the equality of the population medians among different groups. It is performed on ranked data, so the measurement observations are converted to their ranks in ascending order. The loss of information involved in replacing original values with their ranks can make Kruskal-Wallis test a less powerful test than an ANOVA test (Wohlin et al. (2000)). Thus, if the data is normally distributed, a developer should use ANOVA test.
CHAPTER 3
RELATED WORK
Traceability recovery, feature location, trust models, and eye-tracker topics are related to this research work. At the end of the chapter, we provide a summary of all the exist-ing techniques and compare if they have any similar functionalities like proposed in this dissertation.
3.1 Traceability Approaches
Traceability approaches could be divided into three main categories,i.e., dynamic , static, and hybrid. Dynamic traceability approaches(Liu et al. (2007)) require a system to be compilable and executable to perform traceability creation tasks. It also requires pre-defined scenarios to execute the software system. Dynamic approaches collect and analyse execution traces (Wilde and Casey (1996)) to identify which methods a software system is executing for a specific scenario. However, it doesn’t help to distinguish between overlapping scenarios, because a single method could participate in several scenarios. More importantly, due to bugs and–or some other issues a legacy system may not be executable. Thus, it may not be possible to collect execution traces.
Static traceability approaches (Abadi et al. (2008); Antoniol et al. (2002a); Marcus and Maletic (2003c)) use source code structure and–or textual information to recover trace-ability links between high-level and low-level software artifacts. Static tracetrace-ability approaches have received much attention over the past decade in the scientific literature. Antoniol et al. (2002a) used IR-based probabilistic models and VSM to link textual documents. Antoniol et al. (2000b) discussed how a traceability recovery tool based on the probabilistic model can improve the retrieval performances by learning from user feedbacks. Marcus and Maletic (2003c) used LSI to perform the same case studies as in (Antoniol et al. (2002a)) and com-pared the performances of LSI with respect to the VSM and probabilistic models. Their results showed that LSI could provide better performance without the need of a stemmer that is required for the VSM and probabilistic models. Zou et al. (2010) performed empirical studies to investigate query term coverage, phrasing, and project glossary term-based en-hancement methods. These methods are designed to improve the performance of automated tracing tool based on a probabilistic model. The authors proposed a procedure to automat-ically extract critical keywords and phrases from a set of traceable artifacts to enhance the