©Institute for Global Environmental Strategies All rights reserved.
Article
A Comparative Study of Urban Environment
in East Asia: Stage Model of Urban
Environmental Evolution
Xuemei Bai
*aand Hidefumi Imura
bReceived October 31, 1999, accepted April 21, 2000
This article aims to present a theoretical and conceptual model of urban environmental evo-lution in East Asia that can serve as a common analytical framework for the comparative study of urban environment in this region. The model describes the division of the urban environ-mental evolution of this region into four sequential stages: the poverty stage, the industrial pollution stage, the mass consumption stage and the eco-city stage. The authors adopted a three-step approach in building this model. The first step defines certain types from the diverse urban environmental issues, focusing on different drives and impacts, and then examines their relationship to economic development. The next step explores the common dynamics of these urban environmental issues in East Asian cities. The last step builds a conceptual evolutionary model and discusses possible alternative scenarios of the evolutionary paths. The model is supported factually by a horizontal comparison of current urban environmental issues in East Asian countries, and also from the chronological changes of these issues in eight case study cities in the region. The article proposes possible applications to environmental and develop-ment policy of urban municipalities. As a whole, this comparative study aims to provide a better understanding of the region’s urban environmental status, evolution and mechanisms and thus contribute to the theoretical bases as well as practices of urban environmental man-agement.
Keywords: Urban environment, Stage model, Evolution scenario, Case study, East Asia.
1.
Introduction
Rapidly growing urban populations and the important roles cities play in national and global econo-mies have drawn much attention in recent years. Urban issues, including urban environmental problems, are becoming more immediate and are greatly affecting the lives of the majority of human beings, con-sidering that about 55% of world’s population will be urban dwellers by 2015 (United Nations 1996). In East Asian developing countries, a rapid urbanization process is often coupled with rapid industrializa-tion and economic development. Therefore, cities in this region, while acting as the economic growth
* Corresponding author. Tel: +81-468-55-3823, Fax: +81-468-55-3809, E-mail: [email protected].
a Research Fellow, Urban Environmental Management Project, Institute for Global Environmental Strategies (IGES), 1560-39 Kamiyamaguchi, Hayama, Kanagawa, 240-0198 Japan.
b Professor, Institute of Environmental Systems, Kyushu University, Japan / Project leader, Urban Environmental Management Project, Institute for Global Environmental Strategies (IGES).
centers of regions and countries, have become places where the most intensive and acute environmental problems occur. The diversity and complexity of urban environmental problems make it more difficult for municipalities to tackle effectively this situation.
One possible approach to deal with this diversity and complexity is to grasp the current status of the issues in the context of longitudinal dynamics (e.g., the historical process and future trends), and also in the context of horizontal varieties by carrying out a comparative study with other cities. It is the purpose of this study to examine the current status and process of urban environmental change in relation to economic development, to extract a common pattern of evolution, if any, and to find out what drives the process.
Many studies have been done on environmental problems in East Asia. Kojima (1993) analyzed the characteristics of the economic development stage in East Asia in relation to environmental problems. The conclusion drawn from this analysis was that all of the five examined factors—rapid economic growth, high industrialization ratio, rapid urbanization, mass consumption and energy efficiency—would lead the region to face more deterioration in its environment. O’Connor (1994) pointed out that the “telescoping of industrialization”, which characterizes the development path in this region, has brought a more complex and diverse set of environmental problems. While some suggest that this region may have the “advantage of latecomers” (Fujisaki 1994; Hayami 1995) in dealing with environmental prob-lems, others argue that lack of institutional capacity may in fact cause more disadvantage (Nogami 1998). These existing studies recognize the magnitude, scale and complexity of environmental issues confronting the region, and warn of a deteriorating trend.
While the region’s rapid economic growth is considered the driving force behind these deteriorating environmental conditions, there is also evidence showing that some of the environmental problems tend to become less serious as the economy develops. For example, Grossman and Kruger (1995) examined a broad set of environmental indicators to investigate the relationship between the scale of economic ac-tivity and environmental quality, and found little evidence that environmental quality deteriorates steadily with economic growth. Rather, they found for most indicators environmental degradation and income has an inverted U-shaped relationship, which is often referred to as the “Environmental Kuznets Curve”. This was originally derived by Kuznets to show the relationship between income disparity and economic development, and became very popular after the World Bank Development Report (1992) presented evidence on the same kind of relationship between environmental quality and levels of national GDP. Many other studies (Hilton and Hank 1998; Rock 1998; Sugiyama 1997) also provide positive evidence of this relationship.
Three observations are drawn from reviewing the existing research. First, most of the research is based on comparisons at the national level, not the city level. A more focused discussion and analysis is indispensable if the ultimate purpose is to find a solution for urban managers. Second, the environmental issues addressed are mainly pollution-related, ignoring other issues such as lifestyle-related issues, and most attention is paid to environmental problems within the city, while little attention is paid to their impacts outside. Types of issues should be defined based on common causes and similar impacts, and it might be necessary to examine further the issues caused by the pattern of consumption in cities. Third,
the actual evolution of environmental problems itself is seldom mentioned. While it is important to address the changes in a certain set of environmental problems in chronological order and in relation to economic development, recognition of the structural changes in major environmental issues occurring in cities is of equal or even greater importance. This is because with economic development, new types of environmental issues may occur while existing problems become less severe.
This article addresses the dynamics of structural change in urban environmental issues in accordance with economic development and tries to develop a theoretical stage model of urban environmental evo-lution for this region. With this overall goal in mind, the authors explore the following questions: (1) How many dimensions exist to the major environmental problems confronting cities in East Asia? (2) What is the behavior of each type of problem over time and in relation to economic development? (3) Is there a common pattern in the evolution of these problems, and if yes, what is it? The following Part introduces the methodology adopted in this study. Part 3 identifies dimensions within diverse and com-plex urban environmental issues, and examines their behavior over time. Part 4 compares the current urban environmental status in East Asia using selected indicators. Part 5 studies the stage model of urban environmental issues based on evidence from eight case studies in the region and discusses drives, evolving scenarios and policy implications of the proposed stage model. Part 6 discusses the features and limita-tions of the model and concludes with the major findings of the study.
2.
Methodological issues
The aim of this article is to present a theoretical model addressing the structural change or evolution of urban environmental issues, and to discuss the possible policy applications of this theoretical model. Though the model concept finds support from actual data indicated below, the presented model is not based on a rigorous data analysis at this time, but rather presents a theoretical basis for doing subsequent statistical data analysis. Applied to individual cities, this generalized theoretical model should take shape when based on actual data from cities.
The basic assumption underlying this approach is that development and structural changes in the economy may bring different sets of environmental problems. The methodological goal is to find evi-dence showing that structural changes do exist in urban environmental evolution in relation to economic development, and to present a model for this generalized trend. A three-step approach is adopted in developing this model. First, complex urban environmental issues are divided into different groups by defining dimensions of causes and effects behind the problems. Second, the behavior of each group of issues is studied in relation to economic development. By doing so, more focus is placed on the driving forces, effects and mechanisms of urban environmental issues, and they are analyzed separately rather than as a unit. Third, a current status overview of the environment is presented to show the relationship between economic development and changing environment issues; this is done by examining the cross-country differences in the urban environment during the same period of time. Chronological changes of urban environmental issues are also examined to show the dynamics of these problems within the same city; this is done through an analysis of the chronological change of issues within the case study cities.
Finally, a theoretical stage model of urban environmental evolution is presented by summarizing the findings of these approaches.
3.
Defining dimensions
3.1.
Types of urban environmental issues
Traditionally, urban environmental issues are divided into sectors, such as water pollution, air pollu-tion, waste treatment and noise. By focusing on sectors of phenomena, it is easier to understand and more convenient for taking countermeasures within each sector. Therefore, this classification system is widely accepted by urban municipalities. However, this approach focuses on environmental pollution, and thus may overlook some other environmental impacts cities may cause in addition to local pollution. In addi-tion, a sectoral approach misses opportunities for synergistic actions to reduce environmental impacts. A focus on air pollution may overlook greenhouse gas emission issues, but a focus on transportation and energy would recognize these two issues as interlinked. Focusing on the different driving forces behind these problems, the World Resources Institute et al. (1997) has divided urban environmental issues into two groups which often coexist within the same city: one associated with poverty and the other associ-ated with economic growth or wealth. Recently, the importance of addressing the impact from consump-tion activities as well as the impact from producconsump-tion-oriented environmental problems has been recog-nized, and relevant studies have examined the different features of these two kinds of issues (Rothman 1998; Duchin 1998). In an attempt to highlight how the nature and relative importance of environmental problems change in cities, David Satterthwaite (1997) divided urban environmental issues into five cat-egories: environmental hazards within the human environment, high use of those renewable resources that are only renewable within finite limits, high use of renewable resources, high levels of non-biodegradable waste generation and over-use of the renewable sink capacity.
In this study, urban environmental issues are divided into three groups by taking into consideration the driving forces behind the problems, major impacts and the spatial scale of the impacts (Table 1). This is
Table 1. Causes and impacts of major types of urban environmental issues.
Type Typical Issues Causes Major Impacts Spatial Extent of Impacts Type I:
Poverty-related issues
Low access to safe water, lack of sanitation facilities, organic pollution of water bodies.
Low infrastructure, rapid urbanization, income disparity.
Sanitation-related health impacts such as diarrhea, infections.
Local.
Type II: Rapid-growth related issues
Air pollution (SOx, particulates), water pollution (heavy metallic subjects, BOD, COD), industrial solid waste pollution.
Rapid industrialization, low rates of emission treatment, lack of effective management.
Typical industrial pollution disasters, Minamata disease, Onsan disease, deterioration of regional ecosystems. Local and regional. Type III: Wealthy lifestyle-related issues CO2 emissions, NOx concentration, municipal wastes, dioxin. High consumption lifestyles, low local incentives for improvement.
Global warming, chemical ingredient and dioxin-caused abnormalities in infants, over-extraction of resources.
Regional and global.
not an attempt to categorize every existing urban environmental issue into these three groups because some issues may fall within all three categories, and some of the grouped issues may have multiple drives or impacts that cut across categories. In these cases, categorization is based on a comprehensive judgement of the authors. For example, loss of biodiversity can be caused by different factors, and the group within which the problem should fall is difficult to identify accurately. It is categorized under Type III in this article, recognizing its major causes as rooted in urban consumption rather than urban poverty, and its impacts as indirect and global.
Type I includes poverty-related urban environmental issues such as low access to clean water supplies and sanitation facilities. Low per-capita income levels, income disparities and rapid migrations of the rural population into cities may result in city slums, where people live in small houses without proper access to water supplies and sanitation. These people are the most vulnerable to infectious diseases caused by poor environmental conditions. This type of environmental problem often occurs in cities within developing countries. The driving forces behind these types of issues are often associated with poverty, such as insufficient investment in basic urban infrastructure, rural-to-urban migrations which overwhelm the ability of cities to provide basic services and income disparities among residents in the city. Human health impacts are the most serious problem associated with this type of problem. The impacts of this type of problem are usually local and internal in nature, and often limited within the city or even to a particular section of the population within the city.
Type II includes industrial production-associated issues. Typical production oriented-environmental pollution such as air pollution by SOx and particulates, water pollution by heavy metallic substances and industrial solid waste pollution are categorized into this type. In East Asian countries, cities are acting as the engines of economic growth, with most of the countries’ industries located within cities. Therefore this type of urban environmental pollution is significant. The driving forces behind this type of issue can be identified as rapid industrialization and urbanization, inadequate treatment of emissions, outmoded or obsolete technology and lack of strict regulations and effective management. The most typical impact of this type of urban environment issue is the industrial pollution disaster. Minamata disease, which oc-curred in Minamata City in Japan, and Onsan disease in Onsan Industrial City in Korea are two typical examples. The spatial range of impacts of this type of problem (for example, river pollution by cities and acid precipitation and deposition) can be regional as well as local.
Type III includes consumption and lifestyle-related issues. Cities need significant amounts of input from outside in order to function on a daily basis, and, as a result, also create large outputs. Inputs consist of energy, food and other materials, and outputs include pollution, wastes, goods and services. Current lifestyles are characterized by mass production, mass consumption and mass disposal, which means that the amount of both inputs and outputs usually far exceeds the environmental capacity of the city. Be-cause of this metabolism, these environmental impacts are not restricted to the city itself, but become regional or even global. These impacts include overconsumption of resources, loss of biodiversity, in-creased amounts and treatment of municipal waste and inin-creased CO2 emissions. Unlike the two former types, this third type of problem is often invisible to local residents, and thus in many cases is not recognized as a problem. In wealthy cities of developed countries, the first two types of traditional
environmental issues are not significant any longer, but the third type of problem is much more signifi-cant in cities in developed countries than in developing countries. In addition to the high-consumption lifestyle, the driving forces behind this type of urban environmental issue include low local incentives for improvement because these problems are relatively easy to externalize and are often perceived as costly to control (Rothman 1998).
These three types of urban environmental issues occur at different stages of urban development, often sequentially, but not necessarily. Different types may occur simultaneously, for example Type I and Type II; Type II and Type III; or even Type I, Type II and Type III. The occurrence of different types of issues at different stages of urban development will be discussed in more detail later in this article.
3.2.
Behavior of typical issues in relation to economic development
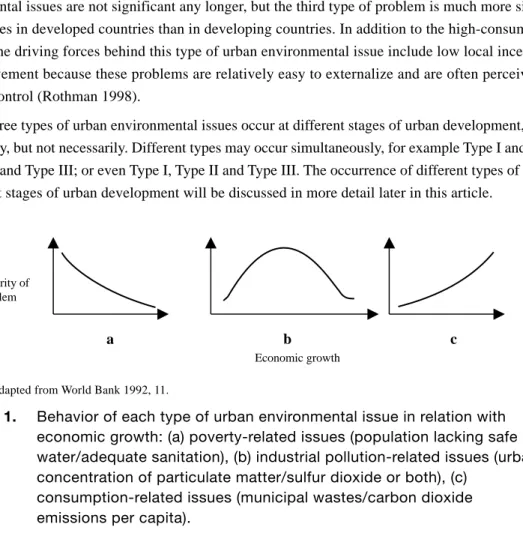
Evidence shows that poverty-related urban environmental issues (Type I) tend to improve as the economy develops and income grows (Figure 1.a). This trend continues until the levels reach a significant low. This positive synergy between economic growth and environmental quality is possible because growing incomes at any level may provide additional resources and capacity to improve public services; further, the nature of these problems displays greater visibility than other types of issues (World Bank 1992).
Most production-related pollution (Type II) follows the pattern of initially worsening but then improv-ing as incomes rise (Figure 1.b). This pattern is often referred to as the Environmental Kuznets Curve (EKC). Results from studies of urban air concentrations of sulfur dioxide, suspended particles, lead and carbon monoxide and water quality as indicated by biological oxygen demand (BOD), chemical oxygen demand (COD), pathogenic contamination and heavy metals contamination support this hypothesis (Grossman and Kruger 1995; Hilton 1998; World Bank 1992; Seldon and Song 1992). Grossman and Kruger’s (1995) study indicates that in most cases the turning points for the different pollutants occur before a country reaches a per capita GDP of U.S.$ 8000. Interpretation of this inverted-U shaped pattern
Figure 1. Behavior of each type of urban environmental issue in relation with economic growth: (a) poverty-related issues (population lacking safe water/adequate sanitation), (b) industrial pollution-related issues (urban concentration of particulate matter/sulfur dioxide or both), (c)
consumption-related issues (municipal wastes/carbon dioxide emissions per capita).
a b c
Economic growth Severity of
problem
varies, encompassing environmental regulation, structural changes in the economy, technological im-provement, energy efficiency and trade.
Consumption-related urban environmental issues (Type III) have a tendency to worsen, or at least not improve like production-related issues, as incomes grow (Figure 1.c). This trend is observed in cases of municipal waste per capita, carbon dioxide emissions per capita, energy demand, fuel and power use per capita and many other indicators for environmental impacts of consumption (World Bank 1992; Rothman 1998; Agras and Chapman 1999; de Bruyn and Opschoor 1997; Suri and Chapman 1998). Several rea-sons may exist for this worsening pattern, such as: (1) these problems usually cause no visible local harm, or their negative impacts are limited to a small group of people; (2) the impacts can easily be externalized and (3) municipal government and industries have few incentives to take countermeasures. The future trend of this type of issue is uncertain; it is unknown if it will continue increasing, stabilize at a certain level, or decrease after reaching a certain level. In the latter two cases, the income level corre-sponding to a stabilizing level or turning point is not clear. However, it seems far beyond the income level of today’s richest cities, considering the fact that there is no evidence showing a turn in growing consumption and lifestyle in any cities to date, despite various government initiatives to change con-sumption patterns (OECD 1998).
Table 2. Index and indicators grouped by type.
Name of Index Indicators Name of Index Indicators Background (country) Production-related
Population Population Economic growth rate GDP growth rate
Population growth ratio Industrial product growth rate
Urbanization level Population urbanization ratio Industrial composition Share of each industry Industrialization level Economic composition ratio Environmental pollution
Economic indices GNP per capita Air SOx concentration
Education level College and higher level ratio Suspended particulates concentration
Water BOD
Poverty-related COD
Income level GDP per capita Heavy metals
Average wage Solid waste Total amount of industrial solid waste
Income distribution Gini coefficient Pollution treatment SOx elimination facilities ratio
Health Calories per capita per day Industrial waste water treatment
Infant mortality Industrial solid waste treatment
Resource use by industries Water extraction by industries Incidence and death from
infectious diseases Energy use by industries
Welfare Per capita medical expense Material use by industries
Health impacts Incidence of pollution related diseases Amount and ratio of subsidies or
relief funds Incidence of pollution related disasters
Illiteracy ratio
Infrastructure Access ratio to water supply Consumption-related
Access ratio to sanitation Resource consumption Per capita energy consumption
Environmental Pollution Pathogenic contamination in water Per capita water consumption
Per capita food consumption
Ecological footprint
Waste discharge Per capita municipal waste Lifestyle index Automobile population ratio
Possession of electric devices
Pollution NOx concentration in air and water
bodies
Air, water and soil pollution by chemical substances such as dioxin
4.
Current urban environmental issues in East Asia
In order to identify the cross-country differences between major current environmental issues faced by East Asian cities, this study compares features of the urban environments in three countries: Japan, Korea and China. Four sets of indicators have been selected to describe three types of urban environmen-tal issues, including background information.
Data used for the following comparison consists of country-level data, average values for all or major cities in the country and individual city-level data. Some country-level data are used out of necessity to provide a general picture of the social economic situation of each city. Average values of cities are used partly because of lack of individual city data, and partly because the purpose of this part is to show the differences in general trends in the urban environment in the three mentioned countries rather than dif-ferences among individual cities. A major obstacle in conducting this cross-country comparison was lack of complete data at the city level and the comparability of the available data. Due to the limited availabil-ity of data, not all the listed indicators are compared.
4.1.
Selection of indicators
Four sets of indicators were defined to compare the characteristics of the current urban environmental situation. Table 2 shows the major items included in each set and their indicators.
The first set of indicators provides background information at the country level for this comparison. This background information is important because cities influence and are influenced by surrounding areas of the country. This set of indicators mainly consists of data on urbanization, industrialization, economic development and education. Indicators for each of these aspects are the urbanization ratio, economic composition and per capita income.
The second set mainly consists of indicators for poverty-associated urban environmental (Type I) issues. The following indices and indicators are included in this group: (1) Income level and its distribu-tion among urban dwellers, with detailed indicators such as per capita income, income distribudistribu-tion pat-terns and Gini coefficients; (2) nutrition, public health and welfare, with detailed indicators such as nutritional conditions, daily calorie intake per capita, drinking water quality indicators, infectious dis-ease incidence rates, infant mortality ratios and per capita medical expenses and (3) basic infrastructure, such as the percentage of the population with access to water supply and sanitation. This group of indi-cators reflects the basic living conditions and services available to citizens. A city facing typical poverty-associated environmental issues will have indicators showing low levels of income, welfare and basic infrastructure.
The third set of indicators mainly reflects urban environmental issues caused by rapid economic growth and industrialization (Type II). Indicators include: (1) the growth ratio of economy, such as incremental ratio of GDP and incremental ratio of industrial outcome; (2) the ambient environmental pollution, such as air pollution, water pollution and industrial solid waste pollution; (3) the pollution treatment, such as sewage water treatment ratio, municipal waste treatment ratio and industrial waste water and solid waste treatment ratio and (4) the health impact caused by pollution, such as the occurrence of environmental
accidents and typical environmental diseases. If indicators show a city has high economic growth, high industrial pollution and a low pollution treatment level, as well as significant environment-related health impacts, then it means the city is confronting typical industrial production-related environmental issues. The fourth set is the measure of consumption by urban dwellers (Type III). It mainly includes per capita resource and material consumption, such as per capita energy consumption, per capita water re-source consumption and per capita food consumption and associated emissions such as CO2 and munici-pal waste discharge. Indirect indicators such as car ownership ratios can also be used. Wealthy cities in developed countries show much higher levels for these indicators than cities in developing countries.
Table 3. Comparison of background indicators (World Bank 1998).
China Korea Japan
Urbanization Ratio 31.02% 82.28% 78.26%
Industrialization Ratio 19:48:33 7:43:50 2:41:57
Per capita GDP
(primary: secondary: tertiary)
U.S.$ 671 U.S.$ 10,644 U.S.$ 36,575
Per capita GDP (ppp) U.S.$ 2,546 U.S.$ 9,976 U.S.$ 17,519
Take-off Time of Economy early 1980s late 1960s middle of 1950s
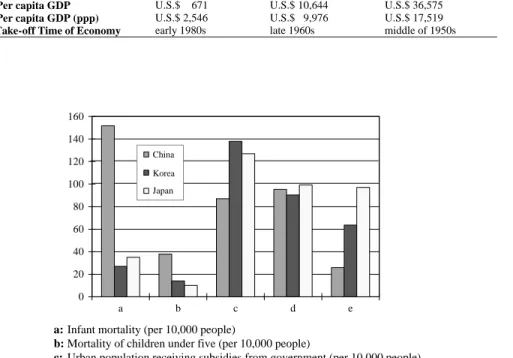
Figure 2. Comparison of poverty-related urban environmental indicators.
0 20 40 60 80 100 120 140 160 a b c d e
a: Infant mortality (per 10,000 people)
b: Mortality of children under five (per 10,000 people)
c: Urban population receiving subsidies from government (per 10,000 people) d: Access to water supply (%)
e: Sewage treatment ratio (%) China Korea Japan
Note: Data for China are mostly average values for 34 cities; data for Korea are average values of 6 to 7 major cities; data for Japan are average values for 13 major cities. Water supply and sewage treatment ratio data for China and Korea are average values for all cities (China State Statistical Bureau 1998a; China State Statistical Bureau 1998b; China State Statistical Bureau 1997b; Min-istry of Home Affairs of Korea 1997; Korea Statistical Yearbook 1997; Homepage of MinMin-istry of Construction in Japan <http://www.moc.go.jp/city/sewerage/information/h10fukyu990903.html> (19 June 2000); Comparative Statistics Yearbook of Large Cities in Japan 1998).
4.2.
Comparative study on current urban environmental status in
East Asia
Using the above indicators, current urban environmental situations in three East Asian countries— Japan, Korea and China—are compared as follows.
Table 3 shows a comparison of country-level background indicators. Both the urbanization ratio and per capita GDP of China are far below that of Korea and Japan, though the income disparity is reduced if measured in terms of purchasing power. The economic composition of Korea and Japan shows a similar pattern, while in China there is a large agriculture sector and a much smaller service sector. It should be noted that the production industry in China has a 48% share of the GDP, which is even higher than
Figure 3. Indicators show speed of economic growth and urbanization (World Bank 1998).
Figure 4. Ambient air pollution in typical cities (World Bank 1998).
0 2 4 6 8 10 12 14 16
GDP Growth Rate Urbanization Rate Industrial Value Added Growth Ratio
(%) China Korea Japan 0 5 0 1 0 0 1 5 0 2 0 0 2 5 0 3 0 0 3 5 0 4 0 0 a b c µ g/m 3 Beijing, China Seoul, Korea T o k y o , J a p a n
a:TSP concentration in typical cities b:SOx concentration in typical cities c:NOx concentration in typical cities
Korea’s 43% and Japan’s 41%. This indicates the importance of the production industry in the Chinese economy. The start of the high-growth era in these three countries vary: Japan in the middle of the 1950s, Korea in the end of 1960s and China in the beginning of 1980s. Through these comparisons it can be seen that Japan was the first to enter the high-growth era and has the most advanced economic structure and highest per capita income, while China comes last and Korea is located in between.
Figure 2 shows indicators of poverty-associated urban environmental issues. Compared to China, urban dwellers in Korea and Japan enjoy a much higher level of welfare and health care, as indicated by low infant mortality and young child mortality. The percentage of urban dwellers receiving subsidies and relief funds is much lower than that of Japan and Korea. Considering the much lower income level of cities in China than in Korea and Japan, this low ratio of subsidy should be interpreted as resulting from a lack of social welfare rather than a low ratio of urban population suffering from poverty. Regarding access to urban infrastructure, Chinese cities have relatively high rates of access to water supplies, but very low levels of sewage treatment. The actual water supply situation in Chinese cities may be not as good as the numbers indicate because periodic water shortages are very common. This happens because water is becoming a very scarce resource due to natural constraints, water pollution and, to some extent, mismanagement. Cities in China still have some poverty-associated problems, while there is hardly any evidence of this for cities in Korea and Japan.
Figure 3 compares indicators showing the speed of economic growth. Out of all three countries, China has the highest GDP growth rate of over 10.7%, an urbanization rate of 3.7% and an industrial produc-tion incremental rate of 14.1%. A relatively high rate of economic growth is also indicated for Korea with a GDP growth ratio of 8.98%, an urbanization rate of 2.4% and an industrial production incremental rate of 10%. Japan has a very slow growth rate compared with the other two, which may indicate that it has a relatively mature economy. A comparison of ambient air pollution in the capital cities of China, Korea and Japan (Figure 4) shows Beijing has the worst air quality among the three. The total suspended
particulates in Beijing is 370 µg/m3, which is 4.4 times higher than Seoul’s level and 7.7 times higher
than Tokyo’s level, far beyond the WHO Guidelines (60 to 90 µg/m3). Sulfur dioxide1 follows a similar
Chinaa South Koreab Japanc
SO2 (µg/m3) 126.6 41 15.6
NOx (µg/m3)d 69.6 51.66 48.2
TSP (µg/m3
) 410 75.6 35.9
Table 4. Average urban air quality in China, South Korea and Japan in 1997.
1 WHO guidelines for annual average sulfur dioxide are 40 to 60 µg/m3. Notes:
a. Data for China is the average of the values for 30 cities, and selection of cities may vary for each indicator (China State Statistical Bureau 1998a).
b. Data for South Korea is average of the values for 6 to 7 major cities (Korea Environment Agency 1998). c. Data for Japan is average of the values for 13 major cities (Council for Large City Statistics of Japan 1997). d. NOx data for China, and NO2 data for Korea and Japan.
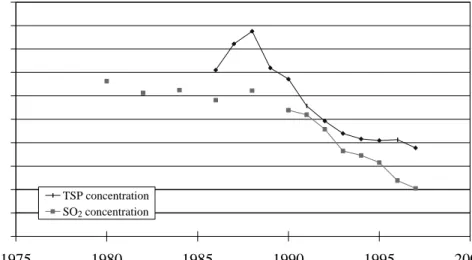
Figure 5. Average air pollution trends for 6 major Korean cities (Korea Environment Agency 1998). 0.0 20.0 40.0 60.0 80.0 100.0 120.0 140.0 160.0 180.0 200.0 1975 1980 1985 1990 1995 2000 Year µ g/m 3 TSP concentration SO2 concentration
Figure 6. Average consumption-related indicators in cities.
0 100 200 300 400 500 600 a b c China Korea Japan
a: Electricity consumption (10kwh/household) b: Municipal water consumption (l/day/capita)
c: Car possession in Beijing, Seoul and Tokyo (number of cars/1000 people)
Note: Data for China are average values of 45 major cities; data for Korea are average values of 6 major cities; and data for Japan are average values of 13 major cities (Council for Large City Statistics of Japan 1997; Ministry of Home Affairs of Ko-rea 1997; China State Statistical BuKo-reau 1998b; China State Statistical BuKo-reau 1997c).
pattern, with Beijing’s level at 94 µg/m3, Seoul’s at 48.6 µg/m3, and Tokyo’s at 20 µg/m3. Even NOx
concentrations are much higher in Beijing than in Seoul and Tokyo.
Table 4 shows the average air quality for cities in China, South Korea and Japan. From the table it can be seen that the average air quality in the three countries follows the pattern of that of their capital cities for two indicators out of three. NOx concentration is not directly comparable for all three countries, but Japan’s number is lower than that of Korea. According to Environmental Statistic Yearbook ’97, environ-mental pollution has become one of four major factors affecting health and mortality in China (China State Statistical Bureau 1997b). In 1996 alone, 65 pollution-related accidents occurred in China, causing typhoid, dysentery, viral hepatitis and other intestinal infectious diseases. Survey results on the causes of these accidents show that 41.5% are caused by municipal sewage discharge and 33.8% by industrial pollution (China State Statistical Bureau 1997b). Figure 5 shows the chronological changes in average SO2 and TSP concentrations in major Korean cities, which indicate that the air quality in Korean cities has greatly improved since the early 1990s. Through the comparison of these indicators, it can be pre-sumed that China is undergoing a high-growth and high pollution course of development, with signifi-cant environmental impacts. Korea maintained a high-growth ratio until the Asian crisis and is still in the course of economic development, but its urban environmental condition has improved greatly. At least from examined indicators, Japan has the best urban environmental status of the three countries, which may mean it has overcome production-related urban environmental pollution problems.
Consumption-related indicators are compared in Figure 6. All the three compared indicators show the lowest levels in the case of China, with the highest values recorded for Japan and Korea. Per capita electricity consumption in China is one-half that of Korea and one-fifth that of Japan. Per capita munici-pal water consumption in China is a little more than half that of Korea. Car ownership in China is growing quickly but is still very low. Major indicators for Korea are located in between China and Japan, and Korea still has some areas to grow in terms of consumption. Some coastal cities in China are also facing typical consumption-related issues, such as NOx concentration due to the rapid growth of private car ownership. Japan’s indicators have high values, showing that Japanese cities are facing typical con-sumption-related urban environmental issues.
Through the above comparison, the cities of the three compared East Asian countries face the follow-ing urban environmental issues:
(1) The major urban environmental issues confronting cities in China are industrial production-asso-ciated issues. Many indicators show that these problems show no signs of improvement; rather, they tend to be worsening (SEPA 1998). Chinese cities also have poverty-associated issues, and in some coastal cities, consumption-related problems have begun to occur.
(2) Cities in Korea have experienced and passed through the most serious period of production-associated urban environmental problems, with typical pollution being controlled. Urban envi-ronmental issues in Korean cities are transitioning from pollution-dominated production-associ-ated issues towards consumption-relproduction-associ-ated issues.
(3) Japanese cities are confronting typical consumption-related urban environmental issues, having overcome poverty-associated issues and most production-associated pollution problems. Recently,
many municipalities in Japan are making efforts to deal with consumption-related environmental issues and have started to explore the idea of a recycling-based eco-city (Kitakyushu Environ-mental Bureau 1996), though few signs show these efforts have led to concrete results.
Two points need attention concerning the above comparison. First, poverty-associated issues in Chi-nese cities are not significant considering its low per capita income, which is a phenomenon observed in other studies as well (Mathur 1994). The reasons for this are thought to be the following two: (1) under the socialist political system and planned economy, the Chinese government paid more attention to im-proving the basic living conditions of urban dwellers than rural dwellers and (2) there are still very large income gaps between cities and rural areas in China. A recent study shows that income in cities can be 3 times higher than income in rural areas, and that China’s strict registry system prevents the rural poor from pouring into cities, which in turn prevents poverty moving from rural areas to the cities (Yi 1999). Once this strict control is loosened, cities will face the tremendous pressure of migration from rural areas, and thus will face the challenge of increasing urban poverty-associated issues. Recent research shows that there is a large transient population in cities in China, but little is known about its current status (Huang 1999). Some of this transient population are registered and have a temporary residential cards, and others are unregistered. This unregistered urban transient population is the most vulnerable to poverty-associated urban environmental issues because these people usually live in substandard make-shift housing without water supplies and sanitation and have no access to social welfare.
Secondly, it can be observed that the current urban environmental issues facing cities in Japan have rather simple causes related to consumption, and they become more complicated in Korea and much more so in China. Though the most challenging issues in Chinese cities are worsening production-asso-ciated industrial pollution problems, some poverty-assoproduction-asso-ciated issues still remain and consumption-re-lated issues still continue to burgeon in some coastal cities. Thus, cities in China are facing much more complex environmental issues at a stage of low per-capita income, which makes it much more difficult to solve these problems.
5.
Chronological analysis: Stage model
This Part examines the chronological evolution of environmental issues in selected case study cities in East Asia. Based on these examinations, a stage model of urban environmental issues is proposed, and a possible future trend from this stage model is indicated.
5.1.
Evidence from case studies
As part of the ongoing case studies conducted by the Urban Environmental Management project at the Institute for Global Environmental Strategies, 8 case study cities—3 from China (Shenzhen, Jiangyin and Dalian), 2 from Korea (Ulsan and Ansan), 1 from Indonesia (Tangerang) and 2 from Japan (Kitakyushu and Ube)—were selected and examined in this study. The dynamics of urban environmental change in each of the cities were studied by local case study teams, and based on their findings, the phases of urban
environmental change in each city were defined.2 Some modifications to the definition of phases were
made after further personal communication with local case study team members.
Only three typical cities—one city each from China, Korea and Japan—are selected and described in detail. This is partly due to space limitations, and more importantly because of the similarities in the evolutionary process of major urban environmental issues among cities in the same country. For ex-ample, Ube City’s process of environmental change is similar to that of Kitakyushu, while Shenzhen and Dalian are more or less similar to Jiangyin. However, the observations drawn below are based on a comparison of all case studies. Further details can be found in case study reports presented by local case study teams (Wang et al. 1999; Shi et al. 1999; Xia et al. 1999; Soerjani et al. 1999; Kim et al. 1999; Katsuhara et al. 1999; Ukita et al. 1999). A comprehensive summary of findings from case studies will be presented in a forthcoming paper.
a. Kitakyushu City, Japan
Phase I (1955 to 1970).3 Driven by economic growth and heavy industrialization, the urban
environ-ment in Kitakyushu deteriorated rapidly. Coal dust and SO2 concentration in the air reached levels haz-ardous to health, while water pollution caused by industrial wastewater discharge earned the rivers and gulf water of Kitakyushu the nickname Sea of Death.
Phase II (1970 to 1985). During this phase, production-associated air pollution such as dust and SO2
concentration was reduced significantly, and water pollution was reduced owing to strict industrial dis-charge control and the construction of basic urban infrastructures like the sewage system. Also during this period, the number of cars in use increased, and associated problems such as NO2 concentration arose.
Phase III (1985 to 1990). Raw material industries, which were the engine of Kitakyushu’s economic
growth, tended to decline in this phase, while assembly industries and service industries increased. Car ownership continued to increase, and the municipal government drew up a Car Pollution Control Plan. Major urban environmental issues were living-environment related, such as noise, vibration, odor, ozone and NO2, which remained high. Attention was now directed towards deteriorating urban amenities and away from production-associated urban environmental issues.
Phase IV (1990 to present). While traditional pollution problems caused by industrial production and
lack of urban infrastructure are no longer significant, new kinds of environmental problems have emerged. A consumer lifestyle leading to increasing waste incineration has become the major source of toxic chemical substances such as dioxins. These chemicals pollute water and soil, and the effects on human health, such as endocrine disruption, have been observed. In order to tackle these new types of urban environmental problems, the Kitakyushu municipality is determined to achieve a recycling-based soci-ety, and among various efforts, started the construction of an eco-town project aimed at reducing munici-pal and industrial waste.
2 The definitions of phases for each city are based on the discussion materials presented by case study team leaders during the second project meeting, and are partly modified through subsequent personal communications with the authors. Contributors are as follows: Rusong Wang (Jiangyin City), Peijun Shi (Shenzhen City), Guang Xia (Dalian City), Hoesong Jeong (Ulsan and Ansan City), Ken Katsuhara (Kitakyushu City) and Masao Ukita (Ube City).
b. Ulsan and Ansan City, Korea
Phase I (before 1963). Until 1963, Korea was a traditional agricultural society with few industries. The
major target of society was combating poverty, and no severe environmental pollution occurred in cities.
Phase II (1963 to mid-1970s). An industrialization and urbanization process started during this period
with the introduction of polluting heavy industries in Ulsan City. Though the number of polluting heavy industries was still small at this stage, air and water pollution began to occur. Fisheries production de-creased partly because of sea pollution.
Phase III (mid-1970s to mid-1980s). A large number of heavy industries gathered in Ulsan, and due to
metropolitan industrial relocation implemented by Seoul, polluting industries were relocated to Ansan City. Worsening air and water pollution caused acute pollution-related diseases, and many fisheries were forced to close. Public awareness of urban environmental issues increased.
Phase IV (mid-1980s to mid-1990s). Pollution was still cumulating, and urban municipal waste
in-creased. The number of cars increased rapidly, with the construction of huge apartment complexes and development of urban sprawl. Ulsan dwellers close to industrial plants were relocated, and pollution-related acute diseases decreased. Stricter regulations on industrial pollutant discharge were introduced, which contributed to improvement of the environment.
Phase V (mid-1990s to present). Traditional environmental pollution has improved greatly, and along
with entering a mass consumption society, Ulsan and Ansan City faced new types of urban environmen-tal issues such as NO2 concentration and endocrine disruption by environmental hormones. Efforts such as eco-city construction have been made by municipalities to tackle these new types of urban environ-mental issues.
c. Jiangyin City, China
Phase I (1950 to 1965). Occurring shortly after the establishment of the People’s Republic of China,
this period was devoted to economic recovery. The industrialization level was very low, and the produc-tivity of the few existing industries was also low. The major environmental problem during this period was the degradation of the natural ecosystem, such as deforestation and soil erosion due to inadequate rural development. There was no significant pollution problem.
Phase II (1966 to 1978). This period corresponds to the Cultural Revolution in China. Major urban
environmental problems were poverty-related ones, such as a shortage of food, infrastructure and hous-ing. Urbanization was slow under a policy that strictly controlled the urban population. Small industries started to develop in the city.
Phase III (1978 to 1991). Jiangyin was upgraded from a county into a city during this period. The city
experienced a rapid growth of the Township and Village Enterprises (TVEs), including polluting heavy industries. While the prosperous TVEs improved living standards for those in the city, they also brought serious urban environmental problems such as water and air pollution. These production-related envi-ronmental issues caused many pollution accidents, and complaints from citizens rose. Ecosystem dete-rioration, acid rain and deforestation also occurred on a large scale.
Phase IV (1992 to 1996). With the accelerating economic development and rapid growth of the city,
large scale industrial development projects and infrastructure construction such as sewage treatment plants were carried out during this period. In addition to industrial discharge, municipal wastewater also became a source of water pollution. Other typical urban environmental issues, such as air, noise and solid waste pollution, were also worsening. A deteriorating urban environment resulted in eutrophication of lakes, related diseases and the weakening of ecosystem services. Various environment-related legislation and regulations were established, and efforts were made to introduce cleaner produc-tion technology into the city’s industry.
Phase V (1997 to present). Huge investments were put into the building of an environmental
infra-structure during this period. At the same time, various countermeasures were taken to improve the city’s environment, such as strict execution of environmental legislation, institutional reform of TVEs and the introduction and implementation of ISO 14000. As a result of these efforts, the city’s environmental quality has improved greatly and now meets national standards. The deteriorated ecosystem has been partly restored. The municipality is now eager to introduce environmentally sound eco-industries, and is determined to change the city into an eco-city. The city is cited by the central government as a model Eco-culture City.
The following are major observations made after comparing the urban environmental evolutionary process in the case study cities:
(1) There are great similarities between urban environmental evolutionary patterns among cities of the same country. For example, in all three Chinese cities—Shenzhen, Dalian and Jiangyin—the dominant urban environment issues before 1978 were poverty-associated issues, such as lack of urban infrastructure, housing and food supplies; while from 1980 to the present they are related to industrial urban environmental pollution, with the occurrence of consumption-related issues in some wealthy cities. In the two Korean case study cities, up to the mid-1960s the major problems were poverty-associated. From the mid-1960s to the mid-1990s production-related issues wors-ened, peaked and then improved; and from the mid-1990s both cities encountered consumption-related issues such as increasing car ownership and municipal waste problems. In the two Japa-nese case study cities, Kitakyushu and Ube, the only major urban environmental issues before 1955 were poverty-associated issues, which greatly improved by the 1970s, and from 1955 to 1985 the major issues were production-associated pollution problems. From 1985, both cities entered the mass consumption era and faced similar new types of urban environmental issues such as chemical toxins from municipal solid waste incineration. Since the mid-1990s, both Japa-nese case study cities started efforts to realize a recycling-based sustainable eco-city.
(2) Two chronological phenomena can be observed. The first one is that the same problems occurred in Japanese cities first, then in Korean cities, and lastly in Chinese cities. For instance, produc-tion-related pollution problem in cities of the three countries began in the 1950s, 1965 and 1980 respectively; while the time at which consumption-related issues became a major urban environ-mental problem is 1980 in Japan and the 1990s in Korea. This corresponds with observations made by researchers who record the same evidence of a “flying geese pattern” of industrial
devel-opment among these three countries (Ezaki 1994). Second, within the same city, different types of major urban environmental issues occur chronologically, following the pattern of poverty-associ-ated issues first, then production-associpoverty-associ-ated issues, and finally consumption-relpoverty-associ-ated issues. This sequential characteristic appears more clearly in the case of Japanese cities than in Chinese cities. (3) The dominant time period of production-related urban environmental issues tends to be shorten-ing, and problems confronting cities today tend to be more complex than in previous decades. For example, while Japanese cities are facing consumption-related urban environmental issues today, Chinese cities are facing lack of infrastructure, production-associated issues and some consump-tion-related issues simultaneously. This is partly because Chinese cities started their urbanization and industrialization process with a much weaker economic base compared with that of Japan, a phenomenon sometimes referred to as the “telescoping of industrialization” (O’Connor 1994). (4) Current major urban environmental problems confronting all three Chinese case study cities are
production-associated pollution problems, with some remaining poverty-associated issues and newer occurrence of consumption-related issues. Korean cities started to overcome major pro-duction-associated issues such as water and air pollution recently, and are now facing consump-tion-related issues. The Japanese cities are confronting typical consumpconsump-tion-related issues, and both municipalities are making efforts to overcome these problems by changing their society into a more recycling-based, zero-emissions urban society.
5.2.
Stage model of urban environmental evolution
As discussed above, major environmental problems confronting cities are different at different stages of urban development, and there exists some common features in the evolutionary pattern of these changes in East Asian cities. This Part presents a stage model representing current urban environmental evolu-tionary paths in East Asia and tries to indicate potential alternative scenarios in urban environmental evolution.
a. Description of stage model
As described in Section 3, urban environmental issues can be divided into three groups—poverty-associated issues, production-groups—poverty-associated issues and consumption-related issues—each of which presents different behavior in the course of economic development. Given a particular city and a particular time period, one of these three types of issues usually becomes the dominant problem, and shifts in order of prominence sequentially over time. Many cities experienced the evolution of urban environmental issues sequentially from poverty-associated issues to production-associated issues, and then to consumption-related issues. From the viewpoint of environmental impacts and sustainability, the final and ideal stage of a city is one that has neither poverty-related environmental problems nor production-related prob-lems, and with minimal external environmental impacts caused by consumption. According to the above discussions, four stages can be defined in urban environmental evolution:
Figure 7. Conceptual illustration of stage model in relation to major urban environmental problems.
Environmental impacts
Past and present Future Economic development
Stage I Stage II Stage III Stage IV
Poverty-related issues
Production-related issues Consumption-related issues
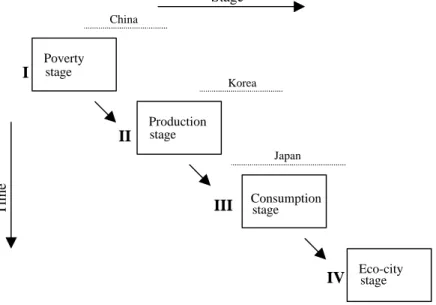
Figure 8. Current stages of urban environmental evolution in East Asia.
Stage Time Eco-city stage Consumption stage Production stage Poverty stage China Korea Japan I II III IV
Stage I: Poverty stage
Stage II: Industrial pollution stage Stage III: Consumption stage Stage IV: Sustainable eco-city stage
Figure 7 shows a typical stage model in relation to major urban environmental problems. This model conceptualizes the evolutionary process experienced by cities in developed countries such as Japan. As indicated in the figure, parts of Stage III and Stage IV are only predicted trends and assume that as eco-efficiency improves, citizens will change their lifestyles and develop greater environmental conscious-ness, and that currently growing environmental impacts of consumption-related issues will not surpass the limitations of the earth’s natural ecosystem.
Cities in China, Korea and Japan are at different economic development stages and are facing different urban environmental issues. This is illustrated by Figure 8, which shows the current stages of urban environmental evolution for cities in the three countries.
b. Driving forces of evolution and alternative evolutionary scenarios
Many cities in developing countries are at relatively early stages of evolution and so the possibility of taking a different evolutionary path from the one illustrated in Figure 7 is still open. Ideally, there could be four different scenarios of urban environmental evolution:
Scenario 1: Stage I —> Stage II —> Stage III —> Stage IV Scenario 2: Stage I —> Stage II —> Stage IV
Scenario 3: Stage I —> Stage III —> Stage IV Scenario 4: Stage I —> Stage IV
There is a possibility that all four evolutionary scenarios may stop at a certain stage or even retreat down the ladder. This may happen due to catastrophic events when the environmental impacts of cities exceeds the limit of the natural ecosystem, and the capacity of the ecosystem is reduced or even de-stroyed. Discussions hereafter are based on the assumption that at each stage, the environmental impact does not exceed this critical level and thus the evolutionary scenario may continue.
The overall vector of driving forces defines the actual choice of scenario, which is the sum of internal driving forces and external pressures. Internal driving forces can be the city’s ability and will to take a certain path of evolution, which may involve economic development, environmental consciousness and industrial and environmental policy. A strong internal driving force towards evolution may result in the shortening or avoidance of a certain stage, and subsequent direct entry into the next stage. Internal driv-ing forces make this kind of artificial choice possible. For example, a city can avoid the second stage, which is characterized by severe industrial pollution, and enter the third stage directly. This is equivalent to Scenario 3. The case of Shenzhen follows this scenario. Cited as the first open city and special eco-nomic zone in China, the city enjoyed rapid ecoeco-nomic growth and higher levels of income along with many other privileges. This relative predominance together with the strong will of the municipality to prevent industrial pollution made it possible for the city to eliminate polluting industries. Thus, the city was in Stage II for only a very short period of time. The city also established its long-term development strategies to prevent severe pollution problems within the city. These strategies include attracting more high technology industries and developing tertiary industries instead of developing polluting secondary industries. This suggests the importance of the institutional role in urban environmental management. Lessons from previous examples of cities in developed countries provided the choice of options for Shenzhen. For example, knowing that energy conversion from coal to oil and natural gas played an important role in combating air pollution in many developed country cities, Shenzhen municipalities decided to introduce natural gas instead of using coal. These choices of options therefore can be consid-ered advantages for latecomers.
On the other hand, pressures from outside the city may also influence which scenarios will occur next. These external pressures include constraints on natural conditions and resources of the city, and increas-ing environmental consciousness and international regulations concernincreas-ing the global environment. Strong external pressures can affect and even change the path of evolution. For example, the limited reserve of natural resources such as fossil fuel and fresh water means that not all cities can enjoy the same con-sumption level as today’s American cities do. Therefore, some cities at Stage I or Stage II cannot enter the third mass consumption stage as today’s wealthy cities have, and should seek the path to Stage IV directly, which follows Scenario 2. At least currently, this kind of choice is not a voluntary one, but rather a forced one, in the sense that it requires more effort for the improvement of environmental conditions while trying to improve living standards. From the viewpoint of resource constraints and global environ-mental regulations, cities in developing countries are facing a latecomer’s disadvantage.
5.3.
Policy implications of the stage model
What are the policy implications of the stage model? It addresses the need to evaluate current situa-tions and future trends for certain issues and to take policy measures to prevent their undesirable effects. It is not rare that an urban municipality is overwhelmed by the complexity and difficulty of the urban environmental issues it faces, and is busy dealing with problems in a haphazard way. The stage model can help municipalities identify their most important urban environmental issues and their current stage, based on a long-term perspective of urban environmental change, and take countermeasures as appropri-ate. For example, a city at Stage II must make more effort to control pollution, promote cleaner produc-tion, reduce negative health impacts and decouple the link between economic development and negative environmental impacts through legal, administrative, economic and technological measures. The stage model can also help predict upcoming urban environmental issues from the experiences of cities at higher stages of evolution and allow cities to take preventative measures. Municipalities can play a vital role in improving the urban environment. As described in Section 5.2, with strong leadership and plan-ning, a city can even take an alternative evolutionary path by skipping some stages that are harmful to its citizens, learning from previous evolutionary paths and identifying its relative strengths and constraints. This model provides a strong tool for municipalities, because it can help identify challenges to long-term urban environmental planning with a view towards economic development, which is often lacking but of vital importance for successful urban environmental management.
6.
Concluding remarks
This article examined the current status and historical change of urban environmental problems faced by East Asian cities and presented a stage model of urban environmental evolution. The major conclu-sions are as follows: (1) Focusing on different driving forces and impacts, urban environmental prob-lems can be divided into three groups: poverty-associated issues, production-associated issues and con-sumption-related issues. Within each group, the problems show a similar pattern in relation to economic growth. (2) Current major environmental problems confronting East Asian cities are different depending on the country. Major urban environmental problems identified in cities in China are industrial-pollution
problems. In Korean cities they are a combination of industrial-pollution issues and consumption-related problems, and in Japanese cities they are typically consumption-related issues. (3) An examination of the urban environmental change processes in the case study cities determined that these types of environ-mental problems occur sequentially. The most common sequence of occurrence is poverty-associated issues followed by industrial pollution, and then by consumption-related problems. (4) A stage model of urban environmental evolution in East Asian cities was presented. The model consists of four stages: Poverty stage —> Industrial pollution stage —> Consumption stage —> Eco-city stage. The future scenarios for the evolutionary path of cities are defined by a combination of internal drives and external pressures, differing from city to city.
The stage model presented in this article is based on the analysis of East Asian cities. It sheds light on the different causes and drives of various urban environmental problems, and identifies a typical evolu-tionary path for these problems. It can also be used as an effective tool for urban policymakers as dis-cussed in Section 5.3.
The following points are limitations to this model at present, as well as areas for future improvement. First, in practice it is difficult to define quantitatively thresholds between stages. Typical events, such as government announcements and results and termination of certain environment-related trials, could be used to determine thresholds. To conduct a quantitative analysis, it is necessary to develop an environ-mental impact assessment methodology using the four sets of indicators presented in Section 3.1. Sec-ond, because this model was developed by analyzing a limited number of cities in the East Asian region only, more evidence must be gathered by examining more cities both within the region and in other regions. Future research topics will include rigorous data-based analyses, such as quantitative cross-country analyses and chronological analyses of more cities; the application of the model to actual cases, such as an application of the evolutionary mechanism to case studies; and the presentation of policy recommendations based on these analyses.
References
Akiyama, H. 1999. An introduction to economic development (in Japanese), 25-49. Tokyo: Toyo Keizai, Inc.
China State Statistical Bureau. 1997a. China environmental yearbook 1997 (in Chinese). Beijing: China Environmental Year-book Publisher.
———. 1997b. China population statistics yearbook 1997 (in Chinese). Beijing: China State Statistical Bulletin. ———. 1997c. Statistic yearbook of China 1997 (in Chinese). Beijing: China State Statistical Bulletin.
———. 1998a. China environmental yearbook 1998 (in Chinese). Beijing: China Environmental Yearbook Publisher. ———. 1998b. Urban statistical yearbook of China 1998 (in Chinese). Beijing: China State Statistical Bulletin.
Council for Large City Statistics of Japan. 1997. Comparative statistic yearbook of large cities 1998 (in Japanese). Fukuoka: Council for Large City Statistics of Japan.
de Bruyn, S. M. and J. B. Opschoor. 1997. Developments in the throughput-income relationship: theoretical and empirical obser-vations. Ecological Economics 20:255-70.
Ezaki, M. 1994. The growth of Asia and structural change. In Contemporary Asia series 2: Modernization and structural change
Fujisaki, N. 1994. Development and environment—Asia as growth center and the task of Japan. In Development and
environ-ment—The task of Asia as new growth center (in Japanese), edited by R. Kojima and N. Fujisaki. Tokyo: Institute of
Develop-ing Economies.
Grossman, M. G. and A. B. Krueger. 1995. Economic growth and the environment. Quarterly Journal of Economics, May:353-77.
Hayami, Y. 1995. Development economics: The poverty and wealth of people (in Japanese). Tokyo: Sobun-Sha.
Hilton, F. and G. Hank. 1998. Factoring the environmental Kuznet’s Curve: Evidence from automotive lead emissions. Journal of
Environmental Economics and Management 35:126-41.
Huang, R. 1999. The floating population in megacity, China—Facts and problems. In Abstracts of 1999 Open Meeting of the
Human Dimensions of Global Environmental Change Research Community, 108. Hayama: Institute for Global Environmental
Strategies.
Japan Environment Agency. 1994. White paper on Japan’s environment 1994 (in Japanese). Tokyo: Printing Bureau, Ministry of Finance, Japan. Tokyo: Printing Bureau, Ministry of Finance, Japan.
———. 1998. White paper on Japan’s environment 1998 (in Japanese). Tokyo: Printing Bureau, Ministry of Finance, Japan. Japan Environment Council. 1997. White paper on Asian environment 1997/1998 (in Japanese). Tokyo: Toyo Keizai, Inc. Katsuhara, T., T. Matsumoto and H. Nakayama. 2000. Development of urban environmental governance at Kitakyushu City and
its evaluation. Report for the Institute for Global Environmental Strategies.
Kim, C., H. Jeong, D. Cho and S. Youn. 2000. Urbanization, industrialization and sustainable development in Korea case study on Ulsan and Ansan. Report for the Institute for Global Environmental Strategies.
Kitakyushu Environmental Bureau. 1996. Local Agenda 21 Kitakyushu: Challenge of Kitakyushu toward a sustainable future. Kitakyushu: Department for General Affairs, Kitakyushu Environmental Bureau.
Kojima, R. and N. Fujisaki. 1993. Development and environment: Lessons of East Asia (in Japanese), 27-44. Tokyo: Institute of Developing Economies.
Korea Environment Agency. 1998. Environmental white paper of Korea 1998 (in Korean). Seoul: Korea Environmental Agency. Mathur, O. P. 1994. The dual challenge of poverty and mega-cities: An assessment of issues and strategies. In Mega-city growth
and the future, edited by R. J. Fuchs, E. Brennan, J. Chamie, F. Lo and J. I. Uitto. Tokyo: United Nations University Press.
Matsuoka, S., R. Matsumoto and I. Kawauchi. 1998. Economic development and environmental problems in developing coun-tries: Does the environmental Kuznet’s curve exist? (in Japanese). Environmental Science 11, no. 4:349-62.
Ministry of Construction of Japan. Web page of the Ministry of Construction of Japan (in Japanese). <http://www.moc.go.jp/city/ sewerage/information/h10fukyu990903.html> (19 June 2000).
Ministry of Home Affairs of Korea. 1997. Municipal yearbook of Korea 1997 (in Korean). Seoul: Regional Development Divi-sion, Ministry of Government Administration and Home Affairs.
Nogami, H. and T. Terao. 1998. Industrial pollution in East Asia and advantage of latecomers. In Environmental problems in Asia
(in Japanese). Japan Society of Environmental Economics and Policy. Tokyo: Toyo Keizai Inc.
O’Connor, D. 1994. Managing the environment with rapid industrialization: Lessons from the East Asian experience. Paris: OECD.
OECD. 1998. Towards sustainable consumption patterns: A progress report on member country initiatives. Paris:OECD. Rock, M. T. 1998. Freshwater use, freshwater scarcity, and socioeconomic development. Journal of Environment & Development
7, no. 3:278-301.
Rothman, D. S. 1998. Environmental Kuznets curves—real progress or passing the buck?—A case for consumption-based ap-proaches. Ecological Economics 25:177-94.
Satterthwaite, D. 1997. Environmental transformations in cities as they get larger, wealthier and better managed. The