AMPHIBIANS DO NOT FOLLOW
BERGMANN’S RULE
Dean C. Adams1,2,3and James O. Church1,4
1Department of Ecology, Evolution, and Organismal Biology, Iowa State University, Ames, Iowa 50011 2E-mail: [email protected]
3Department of Statistics, Iowa State University, Ames, Iowa 50011 4E-mail: [email protected]
Received July 31, 2007 Accepted October 29, 2007
The tendency for organisms to be larger in cooler climates (Bergmann’s rule) is widely observed in endotherms, and has been reputed to apply to some ectotherms including amphibians. However, recent reports provide conflicting support for the pattern, questioning whether Bergmann’s clines are generally present in amphibians. In this study, we measured 96,996 adultPlethodon
from 3974 populations to test for the presence of Bergmann’s clines in these salamanders. Only threePlethodonspecies exhibited a significant negative correlation between body size and temperature consistent with Bergmann’s rule, whereas 37 of 40 species did not display a pattern consistent with this prediction. Further, a phylogenetic comparative analysis found no relationship between body size and temperature among species. A meta-analysis combining our data with the available data for other amphibian species revealed no support for Bergmann’s rule at the genus (Plethodon), order (Caudata), or class (Amphibia) levels. Our findings strongly suggest that negative thermal body size clines are not common in amphibians, and we conclude that Bergmann’s rule is not generally applicable to these taxa. Thus, evolutionary explanations of Bergmann’s clines in other tetrapods need not account for unique life-history attributes of amphibians.
K E Y W O R D S : Bergmann’s rule, body size, kernel density estimation, meta-analysis, Plethodon, thermal clines.
One of the most intensively studied ecogeographic trends is body size variation across environmental gradients (Angilletta and Dun-ham 2003). It has been observed that organisms tend to be larger in cooler climates (Bergmann 1847; Mayr 1956), a pattern termed Bergmann’s rule. Since first described (Bergmann 1847), body size clines along environmental gradients have been examined at multiple taxonomic scales and in a wide variety of taxa (Black-burn et al. 1999; Millien et al. 2006). Among endothermic ver-tebrates, the majority of mammal species studied appear to ex-hibit Bergmann’s clines (Ashton et al. 2000; Meiri and Dayan 2003; Blackburn and Hawkins 2004; but see Meiri et al. 2004), as do the majority of bird species studied (Ashton 2002a; Meiri and Dayan 2003). Typically, these patterns are explained as an evolutionary response to minimize heat loss in colder climates (Bergmann 1847; Walters and Hassall 2006; Olalla-T´arraga and
Rodr´ıguez 2007). In addition, this heat conservation hypothesis may also apply to ectotherms that behaviorally regulate their body temperature, such as reptiles. However, the relationship of body size to temperature in reptiles is more complex. Among reptiles, Bergmann’s clines are relatively common in turtles, but the con-verse to Bergmann’s rule is found in lizards and snakes (Ashton and Feldman 2003; see also Angilletta et al. 2004). Further, al-though evidence of Bergmann’s clines has been found in Liolae-muslizards (Cruz et al. 2005), increased taxon sampling found that the trend was not general for the genus (Pincheira-Donoso et al. 2007). Thus, broad empirical support for the pattern across reptiles is lacking.
Although potential explanations exist for the evolution of Bergmann’s clines in endotherms, there is considerable contro-versy as to whether such clines are even expected to evolve in
ectothermic groups. As a general explanation, the heat conser-vation hypothesis is unlikely to explain body size clines in ec-totherms (Cushman et al. 1993) particularly those that do not behaviorally thermoregulate (Olalla-T´arraga et al. 2006; but see Olalla-T´arraga and Rodr´ıguez 2007). Fasting endurance has also been proposed to explain why larger organisms are found in cooler climates, because larger organisms tend to have larger fat reserves and can therefore better survive lean times (Cushman et al. 1993; Ashton and Feldman 2003). However, although this may be the case for endotherms, increased seasonality implies a shorter grow-ing season for ectotherms, so attainment of a larger body size under these conditions is less likely (Olalla-T´arraga et al. 2006). Finally, although several other hypotheses have been proposed for the evolution of body size clines (reviewed in Blackburn et al. 1999; Olalla-T´arraga et al. 2006), none provide a clear mechanis-tic explanation for why Bergmann’s clines should be expected to evolve in ectothermic vertebrates.
Empirically, evidence for the prevalence of Bergmann’s clines in ectotherms is conflicting. Fish appear to adhere to Bergmann’s rule at the interspecific level (Ray 1960), although within species there is little support for the trend (Belk and Hous-ton 2002). For amphibians, there is both support for (Ray 1960; Lindsey 1966) and against (Feder et al. 1982) the generality of Bergmann’s clines at the interspecific level (see also Olalla-T´arraga and Rodr´ıguez 2007). The most comprehensive study of within-species trends in amphibians suggested that Bergmann’s clines were common in this group (Ashton 2002b). However, recent studies contest the claim that amphibians generally ad-here to Bergmann’s rule, with some species exhibiting body size clines consistent with Bergmann’s rule, whereas other species not showing the expected pattern (Sch¨auble 2004; Krizmanic et al. 2005; Laugen et al. 2005; Measley and Van Dongen 2006). Thus, from both empirical and theoretical perspectives, the question of whether Bergmann’s clines should be generally present in am-phibians remains unanswered.
Understanding the evolution of vertebrate body size depends critically on an accurate assessment of the empirical support for Bergmann’s clines in amphibians. Because of this, we generated a large and geographically expansive dataset for 45 species of
Plethodonsalamanders in the eastern United States to rigorously test whether there was evidence of Bergmann’s clines in these species. This allowed us to assess the prevalence of Bergmann’s clines in a group of species for which many geographic local-ities were available, and whose taxonomy was well established (Highton 1995, 1999; Highton and Peabody 2000; Wiens et al. 2006). In addition, we combined our data with the available data on body size clines in amphibians to examine predominance of Bergmann’s rule at several taxonomic scales within the Amphibia (genus, order, and class). This enabled us to determine whether Bergmann’s clines were generally present in amphibian taxa.
Materials and Methods
We measured body size (snout-vent length: SVL) ofPlethodon
specimens from the collections of the National Museum of Nat-ural History, Washington D.C., USA. From this collection, we excluded obvious juveniles (based on minimum adult body size records of species for which this information was available: e.g., Saylor 1966), and specimens of uncertain species designation, from unknown geographic localities, and from hybrid populations (see Adams 2007). Specimens from sites with fewer than three adult individuals were also eliminated. Our final dataset included 96,996 individuals from 3974 populations for 3213 geographic locations from 45 species (Fig. 1). For each specimen we mea-sured SVL to the nearest 0.1 mm using Brown & Sharpe Mark IV digital calipers.
To obtain estimates of the typical adult body size for each species and for each population (species×locality combination) we determined the maximum modal adult body size using ker-nel density estimation (Silverman 1986; Manly 1996). This ap-proach was used because unlike the mean, the maximum modal value is insensitive to the presence of any juvenile specimens still contained in the dataset. Kernel density estimation (KDE) fits a continuous, nonparametric density curve to the observed data (see Silverman 1986). Peaks in the kernel density distribution corre-sponded to values found in higher frequency in the dataset (Fig. 2). The body size corresponding to the maximal peak of the density curve was treated as the modal adult body size, and was found us-ing the “density” function in R (R Development Core Team 2006). In addition, for each population we obtained the annual mean tem-perature by cross-referencing our geographic localities with the WORLDCLIM database (Hijmans et al. 2005) using DIVA-GIS (Hijmans et al. 2004). The overall mean annual temperature for each species was also determined.
Because Bergmann’s clines have been described at multi-ple taxonomic scales (see Blackburn et al. 1999; Millien et al. 2006), we assessed their prevalence among Plethodon species at both the interspecific and intraspecific levels. For the inter-specific comparisons, we calculated the modal adult body size and overall mean annual temperature for each species, and de-termined whether there was a statistical relationship between the two. We also used phylogenetically independent contrasts to ex-amine the association of body size and temperature while taking phylogeny into account (Felsenstein 1985). For this approach, we used the phylogenetic relationships forPlethodonas determined by Wiens et al. (2006). For both analyses, 44Plethodonspecies were used, becauseP. sherandowas not included in Wiens et al. (2006). All analyses were performed in R (R Development Core Team 2006).
To assess the prevalence of Bergmann’s clines within
Figure 1.Map of the 3213 geographic locations used in this study. Localities correspond to sites in the USNM collections from which one or morePlethodonsalamander species are known.
temperature and adult body size for all species represented by three or more geographic localities (40 species). We then performed a meta-analysis of these data to determine whether there was general support for Bergmann’s rule at the genus level. With this approach,
Figure 2. Body size data for a single population ofP. glutinosus
(N =500), represented as a histogram. The density curve ob-tained from kernel density estimation is superimposed. The peak of this curve represents the nonparametric estimate of the maxi-mum modal adult body size. The typical adult body size is shown as an arrow corresponding to the peak in the curve.
correlation coefficients for species represented by four or more ge-ographic localities (38 species) were transformed to Fisher’sZr
(Hedges and Olkin 1985; Rosenthal 1991), and were combined to obtain the weighted cumulative effect size for all species us-ing MetaWin 2.0 (Rosenberg et al. 2000). Because some effect sizes were based on few geographic localities, and because there was substantial variation in effect sizes, we used nonparametric bootstrap confidence intervals with 9999 iterations to evaluate the significance of the cumulative effect size (Adams et al. 1997).
In addition, we determined the extent to which Bergmann’s clines were generally common within higher taxonomic cate-gories using meta-analysis. This analysis included our estimates of Bergmann’s clines within 38Plethodonspecies, as well as body size clines obtained from previous reviews of amphibians (Ashton 2002b, 2004), and recently published data for several salamanders (Krizmanic et al. 2005), several anurans (Sch¨auble 2004; Laugen et al. 2005), and a caecilian (Measley and Van Dongen 2006). The combined dataset contained a total of 59 effect sizes, each repre-senting the within-species correlation of body size to temperature, latitude, or elevation. Because the expected direction of the corre-lation of body size with temperature (negative) was opposite of that expected from the correlation of body size with latitude or eleva-tion (positive), body size correlaeleva-tions based on elevaeleva-tion or latitude were multiplied by−1 so that they were directly comparable to those obtained using temperature (see Gurevitch et al. 1992). All correlations were then transformed to Fisher’sZr, and cumulative
effect sizes were obtained for all salamanders (Caudata) and for all amphibians (Amphibia) using standard meta-analytic tech-niques. Cumulative effect sizes were statistically evaluated us-ing bootstrap confidence intervals with 9999 iterations. We also examined the extent to which these trends were influenced by species represented by a large number of populations by eliminat-ing species with>100 geographic localities and recalculating the cumulative effect sizes forPlethodon,for salamanders, and for amphibians.
Finally, a funnel plot of effect size (correlation) versus the number of geographic localities was generated. From this, we per-formed regressions of effect size versus sample size forPlethodon,
for salamanders, and for amphibians to detect possible biases due to sample sizes (see Palmer 1999). In addition, we examined the variation of effect sizes across the range of sample size (the number of geographic localities). Large sample and meta-analytic theory predict that for robust estimates of central tendency (e.g., cumu-lative effect sizes), the variation of estimates should decrease as sample sizes increase (Palmer 1999; Gotelli and Ellison 2004).
Results
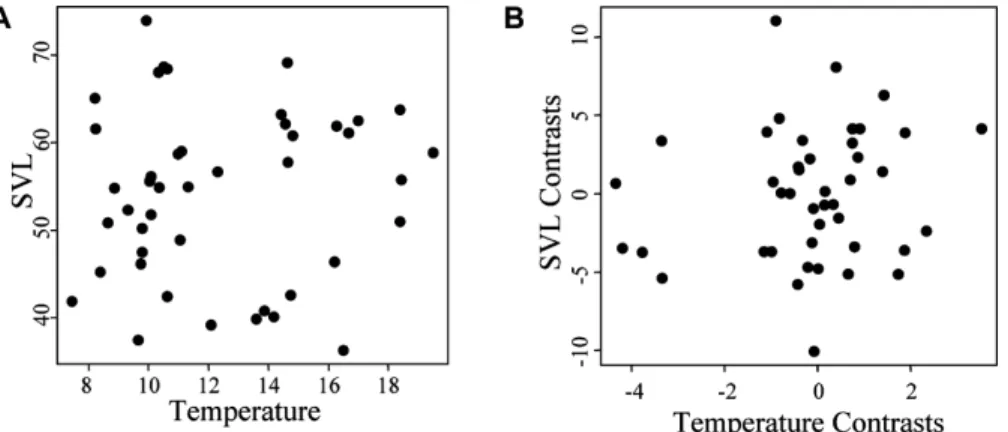
We found little empirical support for the presence of Bergmann’s clines inPlethodon.At the interspecific level, there was no rela-tionship between body size and temperature (F=0.2014,P=
0.6559; Fig. 3), even when phylogeny was taken into account (F=0.9026,P=0.3475; Fig. 3). Within species comparisons revealed that only three species exhibited a significant negative correlation between body size and temperature in the direction consistent with Bergmann’s rule whereas seven species exhib-ited a significant positive correlation in the direction converse to Bergmann’s rule (Table 1; Fig. 4). The remaining 30 species dis-played no relationship between body size and temperature. Three species in our study (P. cinereus,P. glutinosus, andP. jordani) were examined previously (Ashton 2002b). In all cases, we found
Figure 3.Among species relationship for modal body size and mean temperature for 44 species of easternPlethodonusing (A) uncorrected data (F=0.2014, df=1, 42,P=0.6559), and (B) phylogenetically independent contrasts (F=0.9026, df=1, 42,P=0.3475).
a significant correlation in the opposite direction of what was pre-viously reported. However, our estimates for each of these species were obtained from many geographic localities (1618, 523, and 278 localities, respectively), and are therefore considered to be robust.
When species-level patterns were combined, we found that the overall cumulative effect size of temperature versus body size forPlethodonwas slightly positive, but was not significantly dif-ferent from zero (Table 2). This further suggested that Bergmann’s clines were not prevalent in this group. Additionally, when our data were combined with data from previous studies, the cumula-tive effect sizes for salamanders and for amphibians were slightly positive, in the direction converse to Bergmann’s rule. However, neither of these values were significant (Table 2), implying that there was little evidence for thermal body size clines in any of these taxonomic groups. These results were also insensitive to species represented by a large number of geographic localities, as none of the cumulative effect sizes were significant when these species were removed (Table 2). We note that these findings were in contrast to previous studies that found support for Bergmann’s rule in both salamanders and amphibians.
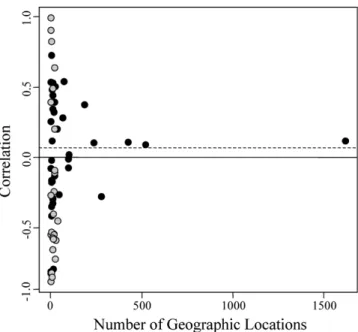
Using funnel plots, we found no relationship between the number of geographic localities and effect size for Plethodon,
for salamanders, or for amphibians (Table 2), indicating no sam-ple size biases in our datasets. In addition, the variance around the cumulative effect size decreased as sample size increased (Fig. 5), suggesting that our estimates of the overall correlation of body size and temperature were robust. We also found that most previous estimates of thermal body size clines were based on very few geographic localities, and many displayed a large variance in correlations as compared to species based on many geographic localities (Fig. 2). Thus, both extremely large positive and negative correlations between body size and climate were pre-viously identified, but were based on few geographic localities per species. These observations suggested that cumulative effect sizes
Table 1.Correlation between adult body size and temperature across populations (sites) for species of easternPlethodon.The number of populations, correlation, its significance, and the total number of specimens measured are shown. Bold values highlight significant correlations.
Species Number R Prob. Number of
of sites specimens P. albagula 20 −0.5445 0.0130 682 P. amplus 6 −0.1633 0.7572 120 P. angusticlavius 4 −0.0776 0.9224 142 P. aureolus 27 0.5032 0.0075 365 P. caddoensis 3 −0.8087 0.4003 228 P. chattahoochee 22 0.3927 0.0706 331 P. cheoah 11 0.5289 0.0944 525 P. chlorobryonis 46 −0.2639 0.0763 566 P. cinereus 1618 0.1180 <0.0001 50,126 P. cylindraceus 238 0.1031 0.1126 3209 P. dorsalis 8 −0.1721 0.6836 915 P. electromorphus 20 0.3206 0.1681 323 P. fourchensis 5 −0.1751 0.7781 130 P. glutinosus 523 0.0907 0.0382 7201 P. grobmani 8 0.1173 0.7820 578 P. hoffmani 99 −0.0725 0.4759 1123 P. hubrichti 4 0.5328 0.4672 1003 P. jordani 278 −0.2777 <0.0001 4173 P. kentucki 6 0.7227 0.1047 234 P. kiamichi 4 0.2551 0.7449 210 P. kisatchie 2 – – 21 P. meridianus 7 −0.0187 0.9683 282 P. metcalfi 187 0.3735 <0.0001 4016 P. mississippi 15 −0.7912 0.0004 1009 P. montanus 99 −0.0112 0.9122 4947 P. nettingi 7 −0.4149 0.3546 430 P. ocmulgee 3 −0.8224 0.3852 101 P. ouachitae 12 0.4409 0.1168 759 P. petraeus 2 – – 129 P. punctatus 9 0.4805 0.1905 81 P. richmondi 75 0.5394 <0.0001 1895 P. savannah 1 – – 46 P. sequoyah 1 – – 110 P. serratus 102 0.0184 0.8540 2099 P. shenandoah 13 −0.2929 0.3313 470 P. sherando 1 – – 30 P. shermani 68 0.2831 0.0193 2333 P. teyahalee 425 0.1062 0.0286 3266 P. variolatus 7 −0.1619 0.7286 567 P. ventralis 22 −0.1310 0.5611 422 P. virginia 14 −0.2965 0.3032 153 P. websteri 14 0.3452 0.2267 536 P. wehrlei 12 −0.3244 0.3036 88 P. welleri 6 −0.3486 0.4982 504 P. yonahlossee 38 0.2004 0.2276 488
obtained by combining species estimates obtained from few ge-ographic localities were less reliable than those obtained from species that were more thoroughly sampled.
Discussion
The tendency for organisms to be larger in cooler climates (Bergmann’s rule) has long interested evolutionary biologists. However, before evolutionary explanations of Bergmann’s clines can be tested, accurate assessments of the empirical support for the pattern across different vertebrate groups must be made. In this study, we examined the extent to which amphibian taxa dis-play thermal body size clines consistent with Bergmann’s rule. We generated a large dataset of body size for Plethodon sala-mander species and found little support for Bergmann’s clines in this group. Further, independent contrasts analysis revealed that there was no relationship between body size and temperature when phylogeny was taken into consideration. Finally, when combined with available data for other amphibian taxa, we found no support for the overall presence of Bergmann’s clines in salamanders or in amphibians. From this we conclude that Bergmann’s rule is generally not applicable to amphibians.
Our conclusion runs counter to the consensus view that Bergmann’s clines are common in amphibians. However, support for this view is based largely on a previous meta-analysis (Ashton 2002b) whose limited geographic sampling may have affected its conclusions. For example, the body size cline forP. cinereuswas previously reported to be strongly consistent with Bergmann’s rule, whereas our estimate was significantly in the opposite direc-tion. However, the previous report was derived from just three ge-ographic localities. By contrast, our estimate was based on 1618 geographic localities that spanned nearly the entire geographic range of the species (8◦latitude and 1676 m elevation). Because the geographic range of this species is so vast, we consider our estimate to be more reflective of the true body size trend for the species. Second, we note that for a given number of localities, estimates of the correlation between body size and climate were more extreme for previous studies as compared to our estimates (Fig. 5). Although this may reflect actual differences in body size clines among taxa, it also suggests that estimates based on sub-samples of known localities have higher variance than estimates based on an exhaustive sampling of known geographic localities. Finally, previous estimates for some species (e.g.,P. glutinosus, P. jordani) were based on populations that are now known to be from multiple species. Thus, these estimates conflated intraspecific pat-terns of Bergmann’s clines with interspecific differences in overall body size. When combined with the fact that our meta-analysis found no substantiation of the generality of Bergmann’s clines in
Figure 4.Relationship between modal body size and annual mean temperature for threePlethodonspecies: (A)P. mississippi(Nsites=
15;r=−0.7912;P=0.0004), (B)P. aureolus(Nsites=27;r=0.5032;P=0.0075), and (C)P. serratus(Nsites=102;r=0.0184;P=0.854).
These relationships correspond to patterns that display: (A) Bergmann’s rule, (B) the converse of Bergmann’s rule, and (C) no clinal pattern of body size.
amphibians, we believe that the current empirical evidence does not support the consensus viewpoint.
There are several important evolutionary implications of our findings. First, previous studies have suggested that Bergmann’s clines were ancestral to tetrapods, based largely on their purported prevalence in salamanders (de Queiroz and Ashton 2004). From
Table 2.Results of meta-analyses at different taxonomic scales. Cumulative effect sizes ( ¯E) and bootstrap confidence intervals are shown. Positive effect sizes represent positive correlations of body size and temperature, and negative correlations with latitude or elevation. The number of species examined at each taxonomic level is included. Cumulative effect sizes ( ¯EN<100) and bootstrap confidence intervals
are also shown for analyses in which species represented by more than 100 geographic locations were eliminated. Results from regression of correlation versus the number of geographic localities (F, df,P) are also given.
Group Number of species E¯ CI F df P
Plethodon 38 0.0908 −0.0138 to 0.1598 0.2352 1,37 0.6305 Caudata 49 0.0738 −0.0509 to 0.1364 0.5907 1,48 0.4457 Amphibia 59 0.0665 −0.0521 to 0.1258 0.4399 1,58 0.5096 Group E¯N<100 CI Plethodon 0.0916 −0.0693 to 0.2595 Caudata −0.0008 −0.1671 to 0.1632 Amphibia −0.0340 −0.2122 to 0.1260
this, it was further concluded that the heat conservation hypothesis was an unlikely explanation of Bergmann’s clines, as salamanders are ectotherms (de Queiroz and Ashton 2004). Our findings con-tradict both of these conclusions. First, based on the available data, our study reveals that Bergmann’s clines are not generally exhib-ited in amphibians. Thus, the proliferation of body size clines in
Figure 5. The correlation of body size to annual mean temper-ature for individual species plotted against the number of geo-graphic localities sampled for that species. Correlations with lat-itude and elevation were multiplied by−1 so that they were in comparable units to those obtained using temperature. Data for all amphibian species from this study (black) and from previous literature accounts (white) are shown. The cumulative effect size is shown as a dashed line.
vertebrates did not correspond with the evolution of tetrapods. Rather, Bergmann’s clines are present in multiple groups of am-niotes (birds, mammals, turtles), and thus may have proliferated coincident with the evolution of these groups.
Second, because body size clines are not generally present in salamanders, evolutionary explanations of Bergmann’s clines in other tetrapod lineages need not account for the unique life-history attributes of amphibians. In particular, the heat conservation hy-pothesis can no longer be rejected on the basis that salamanders exhibit Bergmann’s rule, because Bergmann’s clines are not gen-erally present in salamanders. As such, hypotheses based upon thermal properties are still possible mechanistic explanations for the occurrence of these clines in other vertebrate groups, notably birds and mammals. In fact, our nonsignificant observations in amphibians would be consistent with thermal explanations for the evolution of Bergmann’s clines in these taxa. Thus, although the heat conservation hypothesis has recently been discounted (see de Queiroz and Ashton 2004), we believe it deserves reconsideration. Although the heat conservation hypothesis may explain the proliferation of Bergmann’s clines in mammals and birds, multi-ple explanations for the presence of thermal clines in amniotes are likely required, because the phylogenetic codistribution of these traits is unlikely to be explained by a single origination of these patterns. For instance, if ancestral to amniotes, the prevalence
of Bergmann’s clines must have been lost at least once, as they are typically not displayed in squamate reptiles (de Queiroz and Ashton 2004; Pincheira-Donoso et al. 2007). Additionally, che-lonians are not endotherms, but frequently display Bergmann’s clines (Ashton and Feldman 2003). Therefore, it is unlikely that a single event is responsible for the proliferation of Bergmann’s clines in amniotes, as the mechanisms that may have caused their origination in mammals may not explain their evolution-ary maintenance in turtles. Clearly, more emphasis should be placed on describing and testing possible mechanisms that under-lie Bergmann’s rule (e.g., Angilletta and Dunham 2003; Angilletta et al. 2004).
It is generally observed that vertebrates are larger in cooler climates, but evolutionary explanations for this pattern remain elu-sive. Our results conclusively demonstrate that Bergmann’s clines are not generally present in amphibians. Therefore, evolutionary explanations of Bergmann’s clines in other vertebrate groups need not be consistent with the life-history attributes of amphibians. Our results also suggest that explanations based on thermal prop-erties remain viable for their evolution in some vertebrate groups, although the presence of Bergmann’s clines in other vertebrate taxa (such as turtles) would remain unexplained. Despite the fact that our results are essentially negative, our findings significantly advance our understanding of thermal body size clines by pin-pointing where these clines do not occur. Through this, we can more accurately infer where they likely proliferated, providing a context for comparing evolutionary explanations with the avail-able empirical data.
ACKNOWLEDGMENTS
We thank S. Arif for assistance in data collection, J. Wiens for providing the phylogenetic tree ofPlethodon, and A. Wynn and the USNM staff for their continued support for our use of the museum’s repository of salamanders. N. Valenzuela made valuable comments on this manuscript. DCA thanks D. Rabosky for discussions of KDE and its utility for body size data. This work was sponsored in part by NSF grant DEB-0446758 to DCA.
LITERATURE CITED
Adams, D. C. 2007. Organization ofPlethodonsalamander communities: guild-based community assembly. Ecology 88:1292–1299.
Adams, D. C., J. Gurevitch, and M. S. Rosenberg. 1997. Resampling tests for meta-analysis of ecological data. Ecology 78:1277–1283.
Angilletta, M. J., and A. E. Dunham. 2003. The temperature-size rule in ec-totherms: simple evolutionary explanations may not be general. Am. Nat. 162:332–342.
Angilletta, M. J., P. H. Niewiarowski, A. E. Dunham, A. D. Leach´e, and W. D. Porter. 2004. Bergmann’s clines in ectotherms: illustrating a life-history perspective with sceloporine lizards. Am. Nat. 164:E168–E183. Ashton, K. G. 2002a. Patterns of within-species body size variation of birds:
strong evidence for Bergmann’s rule. Glob. Ecol. Biogeogr. 11:505– 523.
———. 2002b. Do amphibians follow Bergmann’s rule? Can. J. Zool. 80:708– 716.
———. 2004. Sensitivity of intraspecific latitudinal clines of body size for tetrapods to sampling, latitude and body size. Integ. Comp. Biol. 44:403– 412.
Ashton, K. G., and C. R. Feldman. 2003. Bergmann’s rule in nonavian rep-tiles: turtles follow it, lizards and snakes reverse it. Evolution 57:1151– 1163.
Ashton, K. G., M. C. Tracy, and A. de Queiroz. 2000. Is Bergmann’s rule valid for mammals? Am. Nat. 156:390–415.
Belk, M. C., and D. D. Houston. 2002. Bergmann’s rule in ectotherms: a test using freshwater fishes. Am. Nat. 160:803–808.
Bergmann, C. 1847. ¨Uber die verh¨altnisse der warme¨okonomie der thiere zuihrer grosse. Gott. Stud. 1:595–708.
Blackburn, T. M., and B. A. Hawkins. 2004. Bergmann’s rule and the mammal fauna of northern North America. Ecography 27:715–724.
Blackburn, T. M., K. J. Gaston, and N. Loder. 1999. Geographic gradients in body size: a clarification of Bergmann’s rule. Divers. Distrib. 5:165– 174.
Cruz, F. B., L. A. Fitzgerald, R. E. Espinoza, and J. A. S. II. 2005. The importance of phylogenetic scale in tests of Bergmann’s rule. J. Evol. Biol. 18:1559–1574.
Cushman, J. H., J. H. Lawton, and B. F. J. Manly. 1993. Latitudinal patterns in European ant assemblages: variation in species richness and body size. Oecologia 95:30–37.
de Queiroz, A., and K. G. Ashton. 2004. The phylogeny of a species-level tendency: species heritability and possible deep origins of Bergmann’s rule in tetrapods. Evolution 58:1674–1684.
Feder, M. E., T. J. Papenfuss, and D. B. Wake. 1982. Body size and elevation in neotropical salamanders. Copeia 1982:186–188.
Felsenstein, J. 1985. Phylogenies and the comparative method. Am. Nat. 125:1–15.
Gotelli, N. J., and A. M. Ellison. 2004. A primer of ecological statistics. Sinauer Associates, Sunderland, MA.
Gurevitch, J., L. Morrow, A. Wallace, and J. S. Walsh. 1992. A meta-analysis of competition in field experiments. Am. Nat. 140:539–572.
Hedges, L. V., and I. Olkin. 1985. Statistical methods for meta-analysis. Aca-demic Press, Orlando, FL.
Highton, R. 1995. Speciation in eastern North American salamanders of the genusPlethodon. Annu. Rev. Ecol. Syst. 26:579–600.
———. 1999. Geographic protein variation and speciation in the salamanders of thePlethodon cinereusgroup with the description of two new species. Herpetologica 55:43–90.
Highton, R., and R. B. Peabody. 2000. Geographic protein variation and speci-ation in salamanders of thePlethodon jordaniandPlethodon glutinosus complexes in the southern Appalachian Mountains with the description of four new species. Pp. 31–93inR. C. Bruce, R. G. Jaeger and L. D. Houck, eds. The biology of plethodontid salamanders. Kluwer Aca-demic/Plenum Publishers, New York, NY.
Hijmans, R. J., L. Guarino, C. Bussink, P. Mathur, M. Cruz, I. Barrentes, and E. Rojas. 2004. DIVA-GIS. Vsn. 5.0. A geographic information system for the analysis of species distribution data. Manual available at http://www.diva-gis.org.
Hijmans, R. J., S. E. Cameron, J. L. Parra, P. G. Jones, and A. Jarvis. 2005. Very high resolution interpolated climate surfaces for global land areas. Int. J. Climatol. 25:1965–1978.
Krizmanic, I., T. D. Vukov, and M. L. Kalezic. 2005. Bergmann’s rule is size-related in European newts (Triturus). Herpet. J. 15:205–206.
Laugen, A. T., A. Laurilla, K. I. Johnsson, F. Soderman, and J. Merila. 2005. Do common frogs (Rana temporaria) follow Bergmann’s rule? Evol. Ecol. Res. 7:717–731.
Lindsey, C. C. 1966. Body sizes of poikilotherm vertebrates at different lati-tudes. Evolution 20:456–465.
Manly, B. F. J. 1996. Are there clumps in body-size distributions? Ecology 77:81–86.
Mayr, E. 1956. Geographic character gradients and climatic adaptation. Evo-lution 10:105–108.
Measley, G. J., and S. Van Dongen. 2006. Bergmann’s rule and the terrestrial caecilianSchistometopum thomense(Amphibia: Gymnophiona: Caecili-idae). Evol. Ecol. Res. 8:1049–1059.
Meiri, S., and T. Dayan. 2003. On the validity of Bergmann’s rule. J. Biogeogr. 30:331–351.
Meiri, S., T. Dayan, and D. Simberloff. 2004. Carnivores, biases and Bergmann’s rule. Biol. J. Linn. Soc. 81:579–588.
Millien, V., S. K. Lyons, L. Olson, F. A. Smith, A. B. Wilson, and Y. Yom-Tov. 2006. Ecotypic variation in the context of global climate change: revisiting the rules. Ecol. Lett. 9:853–869.
Olalla-T´arraga, M. A., and M. A. Rodr´ıguez. 2007. Energy and interspecific body size patterns of amphibian faunas in Europe and North America: anurans follow Bergmann’s rule, urodeles its converse. Glob. Ecol. Bio-geogr. 16:606–617.
Olalla-T´arraga, M. A., M. A. Rodr´ıguez, and B. A. Hawkins. 2006. Broad-scale patterns of body size in squamate reptiles of Europe and North America. J. Biogeogr. 33:781–793.
Palmer, A. R. 1999. Detecting publication bias in meta-analyses: a case study of fluctuating asymmetry and sexual selection. Am. Nat. 154:220–233. Pincheira-Donoso, D., T. Tregenza, and D. J. Hodgson. 2007. Body size evo-lution in South AmericanLiolaemuslizards of theboulengericlade: a contrasting reassessment. J. Evol. Biol. 20:2067–2071.
R Development Core Team. 2006. R: a language and environment for statisti-cal computing. Version 2.50. http://cran.R-project.org. R Foundation for Statistical Computing, Vienna.
Ray, C. 1960. The application of Bergmann’s and Allen’s rules to the poikilo-therms. J. Morph. 106:85–108.
Rosenberg, M. S., D. C. Adams, and J. Gurevitch. 2000. MetaWin: statistical software for meta-analysis. Version 2.0. Sinauer Associates, Sunderland, MA.
Rosenthal, R. 1991. Meta-analytic procedures for social research. Sage. Berverly Hills, CA.
Saylor, A. 1966. The reproductive ecology of the red-backed salamander, Plethodon cinereus, in Maryland. Copeia 1966:183–193.
Sch¨auble, C. S. 2004. Variation in body size and sexual dimorphism across geographical and environmental space in the frogsLimnodynastes tas-maniensisandL. peronii. Biol. J. Linn. Soc. 82:39–56.
Silverman, B. W. 1986. Density estimation for statistics and data analysis. Chapman and Hall, London.
Walters, R. J., and M. Hassall. 2006. The temperature-size rule in ectotherms: may a general explanation exist after all? Am. Nat. 167:510–523. Wiens, J. J., T. N. Engstrom, and P. T. Chippendale. 2006. Rapid
diversifica-tion, incomplete isoladiversifica-tion, and the ’speciation clock’ in North American salamanders (genus:Plethodon): testing the hybrid swarm hypothesis of rapid radiation. Evolution 60:2585–2603.