Correcting Radar Rainfall Estimates Based on Ground Elevation Function
Roby Hambali1,2*, Djoko Legono1, Rachmad Jayadi1
1Department of Civil and Environmental Engineering, Universitas Gadjah Mada, Yogyakarta, INDONESIA
2Department of Civil Engineering, Bangka Belitung University, INDONESIA
*Corresponding authors: [email protected]
SUBMITTED 09 September 2019 REVISED 13 September 2019 ACCEPTED 16 September 2019
ABSTRACT X-band radar gives several advantages for quantitative rainfall estimation, involving higher spatial and temporal resolution, also the ability to reduce attenuation effects and hardware calibration errors. However, the estimates error due to attenuation in heavy rainfall condition cannot be avoided. In the mountainous region, the impact of topography is considered to contribute to radar rainfall estimates error. To have more reliable estimated radar rainfall to be used in various applications, a rainfall estimates correction needs to be applied. This paper discusses evaluation and correction techniques for radar rainfall estimates based on ground elevation function. The G/R ratio is used as a primary method in the correction process. The novel approach proposed in this study is the use of correction factor derived from the relationship between Log (G/R) parameter and elevation difference between radar and rain gauge stations. A total of 4590 pairs of rainfall data from X-band MP radar and 15 rain gauge stations in the Mt. Merapi region were used in evaluation and correction process. The results show the correction method based on the elevation function is relatively good in correcting radar rainfall depth with values of Log (G/R) decreased up to 81.1%, particularly for light rainfall (≤ 20 mm/hour) condition. Also, the method is simple to apply in a real-time system. KEYWORDSX-band MP radar; Evaluation and correction; Mountainous region; Elevation function
© The Author(s) 2019. This article is distributed under a Creative Commons Attribution-ShareAlike 4.0 International license.
1 INTRODUCTION
In the last few decades, the utilisation of ground radar for monitoring rainfall is quite intensive due to its advantages compared to rain gauges. Radar rainfall produces high spatial and temporal resolution rainfall data in a broader range. On the opposite, even though rain gauge has accuracy in measuring depth, but only represent a small area. Allegretti, M, et al., (2012) state that for the flood mitigation purpose, a large number of rainfall measuring networks are needed to be able to interpolate the amount of rainfall in an ungauged area. The design of this measuring network is more difficult in area with complex topography and convective conditions, where information provided through rain gauges measurement is very limited (Ozkaya, A & Akyurek, 2019; Yoon, S.-S. & Bae, D.-H, 2013; Burcea, S, et al., 2012). Contrary, rainfall radar provides better coverage both in time and space (Orellana-alvear et al., 2019). Even though the rainfall radar can be
enough due to various sources of error (Burcea, S, et al., 2012; Rossa, AM, et al., 2010; Delrieu, G, et al., 2009).
Sources of error that affect radar rainfall estimates including radar miscalibration, attenuation, ground clutter, anomalous propagation, beam blockage, variability of the Z–
R relationship, range degradation (beam broadening, beam overshooting of the low clouds), vertical variability of the precipitation system, vertical air motion and precipitation drift, and temporal sampling errors (Van De Beek, C.Z, et al., 2010; Villarini, G. & Krajewski, W.F, 2010).
In the mountainous region, radar rainfall estimates accuracy is limited by partial beam blockage and non-uniform beam filling due to topographic effect ( (Yu, N, et al., 2018; Young, C.B, et al., 1999; Shakti, P.C, et al., 2012; Germann, U, et al., 2006). The X-band radar is practically useful to overcome these limitations,
advantages compared to S and C band radars, involving higher spatial and temporal resolution, smaller antenna size, lower transmitted power for the same sensitivity, and lower costs (Orellana-alvear et al., 2019; Yu et al., 2018; Park
et al., 2005). However, X-band radar is still unable to avoid the attenuation caused by heavy rainfall, where the signal received by radar is lower than the noise level (Burcea, S, et al., 2012; Hirano, K, et al., 2014; Shi, Z, et al., 2017; Yoon, S.-S. & Bae, D.-H, 2013). Since not all types of errors can be avoided, the accuracy of radar rainfall estimates needs to be evaluated and corrected by particular techniques.
According to Germann, et al. (2006), Tabary, P, (2007), Uijlenhoet and Berne (2008) and Van De Beek et al. (2010), before radar data is used for application purposes, all kind of corrections should be applied first. Thus, a specific technique and method to evaluate and correcting radar rainfall estimate are needed. Through these corrections, the conformity between estimated radar rainfall and measured ground rainfall are expected to be high. This paper presents the X-band MP radar rainfall correction technique against ground rainfall based on the ground elevation function. The ground elevation function is represented by the elevation differences between radar and the rain gauge stations.
2 RADAR RAINFALL EVALUATION
TECHNIQUES
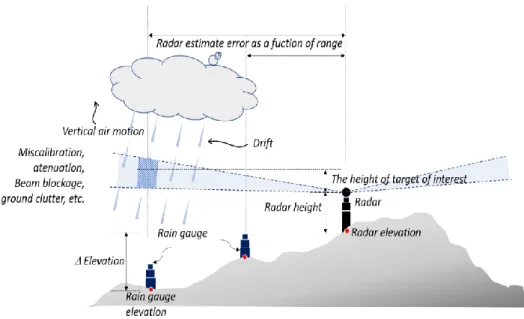
Several methods have been developed to improve the quality of radar rainfall estimates. Commonly, the radar rainfall correction methods are divided into two types, namely the ratio of ground rainfall to radar rainfall (G/R) and merging method. In the (G/R) ratio method, the accuracy of radar rainfall estimates traditionally assessed by comparing its values to the measured rainfall through a rain gauge (Hong, Y & Gourley, J.J, 2015). This method assumed that direct rainfall measurements using a rain gauge as a truth (Sebastianelli, S, 2012). In other words, estimated radar rainfall is evaluated and corrected based on the ground rainfall amount. Figure 1 illustrates some of the errors that arise from the comparison between radar rainfall estimates and ground rainfall measurements using a rain gauge. Indeed, evaluation of the radar rainfall estimates accuracy based on ground rainfall only account for all of the combined error factors and does not provide information about the individual sources of error (Yu, N, et al., 2018). Several previous studies that using G/R comparison methods in their analysis, including Burcea, S, et al., (2012) Krajewski, W.F, et al., (2010), Sebastianelli, S, et al., (2013).
The relationship between radar rainfall (R) and ground rainfall (G) depends on various factors, including climate, environment, and radar characteristics. Long-range radar such as S-band and C-band have different characteristics compare to short-range radar-like X-band, particularly those related to its range. The effect of range is one of the crucial factors that contribute to the radar rainfall estimates error (Villarini, G. & Krajewski, W.F, 2010). Evaluation of radar rainfall error as a function of range has been carried out by Burcea et al. (2012) and Sebastianelli, et al. (2013). Both of them compared radar rainfall with the ground rainfall from rain gauge measurement. Burcea, et al. (2012) evaluated daily rainfall data sourced from the WSR-98D radar, which is an S-band type. From the study, it was found that the radar rainfall error tended to increase beyond the range of 150 km. Sebastianelli et al. (2013) compared hourly rainfall data from Polar 55C radar (C-band radar) and found that radar rainfall estimates errors tended to increase in the range above 50 km. On short-range radar such as X-band, the radar range effect on radar rainfall error is difficult to detect due to it covers only a small range (Hambali, R, et al., 2018). Potential sources of radar rainfall error as a function of range are beam broadening and attenuation. Radar beams will broaden as the range increases. In the case studied by Burcea et al. (2012) and Sebastianelli et al. (2013), the ground elevation of measurement stations (radar and rain gauge) is assumed to be the same. In fact, this situation is found contrast in mountainous regions. The elevation differences between the devices placed in an area far from the top of the mountain and near the top of the mountain are quite significant.
The effect of a topographic factor on radar rainfall estimation errors in mountainous region has been revealed by (Gabella, M, et al., 2000; Gabella, M, et al., 2001) and (Orellana-alvear, J, et al., 2019). The topographic factor is one of three variables evaluated by Gabella et al. (2001) in their research. The three intended variables are the distance from the radar, the minimum
visible from the radar site, and the height of the ground at each pixel. The distance from the radar indicates the estimated error due to beam broadening and attenuation; the minimum height a meteorological target must reach to be visible from the radar site indicates an estimation error due to beam shielding; and finally the height of the ground indicates the depth of the layer where the rain growth occurs due to orographic activities. The characteristics of each pair of radar and rain gauge data affected by these three influencing variables are assessed using the Weighted Multiple Regression (WMR) method. However, Gabella et al. (2000) revealed that analyses involving three variables (distance, visibility, and orography) used in the assessment were more difficult considering the radar data influenced by the vertical reflectivity profile.
3 RADAR RAINFALL CORRECTION BASED ON
GROUND ELEVATION FUNCTION
Evaluation of radar rainfall errors is carried out for correcting the radar rainfall value. The ratio of ground rainfall amount (G) and radar rainfall amount (R) is used to calculate the average bias. Each component of the G/R ratio is calculated by Equation (1).
(
𝐺𝑅
)
𝑗=
∑𝐸𝑖=1𝐺𝑖∑𝐸𝑖=1𝑅𝑖
𝑗 = 1,2, . . . , 𝑛
(1)Gi and Ri are the total amounts of rainfall obtained by rain gauges and radar for i event, respectively. E is the total rainfall events during the time observed. The G/R ratio characteristic is evaluated based on the logarithmic value of each rain gauge correspond to its distance to the radar position. The G/R ratio is considered good if its logarithmic value is close to zero. In addition, the G/R ratio shows a more stable value at a more prolonged accumulated rainfall.
Because of the potential error for radar rainfall estimates in the mountainous region arise due to topographic effect, the evaluation of radar rainfall errors may consider such factor. The effect of topography can be represented through the elevation difference (H) between the radar station (HR) and the rain gauge station (HG). The
between rainfall object that is the target of the radar estimates and the ground rainfall measured by a rain gauge. Therefore, the evaluation of radar rainfall estimation error is carried out by considering the relationship between the Log (G/R) and H of the radar and all selected rain gauge. Mathematically, the relationship between Log (G/R) and H written as follows.
𝐿𝑜𝑔(
𝐺𝑅
) = 𝑓(𝛥𝐻)
(2)f(H) is a regression function between Log (G/R) and H. The equation of f(H) function is determined based on the best regression line, where the typical formula of polynomial regression can be written as follows.
𝑓(𝛥𝐻) = 𝑝
1𝛥𝐻
𝑛+ 𝑝
2
𝛥𝐻
𝑛−1+. . . +𝑝
𝑛𝛥𝐻 +
𝑝
𝑛+1 (3)Mathematical manipulation of Equation (2) is needed to find the formula for correcting rainfall radar depth. Equation (2) can be rewritten as follows.
𝐿𝑜𝑔(𝐺) − 𝐿𝑜𝑔(𝑅) = 𝑓(𝛥𝐻)
(4)𝐿𝑜𝑔(𝐺) = 𝑓(𝛥𝐻) + 𝐿𝑜𝑔(𝑅)
(5)The final goal of the correction of the radar rainfall estimates in order that value corresponds to the ground rainfall value (RkG). Therefore Equation (5) becomes:
𝑅
𝑐= 10
{𝑓(𝛥𝐻)+𝐿𝑜𝑔(𝑅)} (6)Rc is the corrected radar rain value. Equation (6) is more appropriately applied to correct the rainfall depth value because the equation is formed by the value of the G/R ratio, which is a function of rainfall amount.
4 METHOD
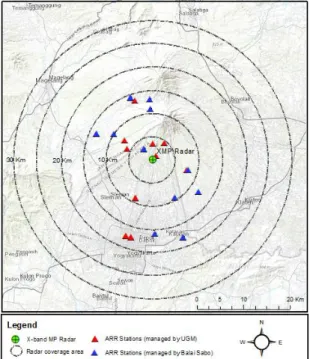
This study focuses on the Mt. Merapi region with a geographical boundary of 110o9'18"- 110o42'0" E and 7o21'30"-7o53'28" S. A map of the study area is presented in Figure 2. The southern flank of Mt. Merapi is the most dynamic sector, both for pyroclastic and lahar flows. Mt. Merapi has
fairly good topography and strong orographic influence. Based on ALOS PALSAR DEM data (2010) with a spatial resolution of 12.5m (DAAC, 2015), the ground elevation around the Mt. Merapi region ranges from 22m to 3152m above the mean sea level (MSL), with an average elevation of 1587m above the MSL.
Figure 2. The study area with a rainfall monitoring network in Mt. Merapi region
There are 21 units of an automatic rain gauge or automatic rainfall recorder (ARR) for monitoring ground rainfall in the Mt. Merapi region with a density of about 134.64 km2/station. Ten rain gauges are operated by the Hydraulic Laboratory of the Department of Civil and Environmental Engineering, Universitas Gadjah Mada through telemetry system, while the other 11 are operated by Balai Sabo, Ministry of Public Works and Housing of the Republic of Indonesia. The X-band MP radar used in this study is located in the Merapi Volcano Museum. This radar was installed through a collaboration program between the Japanese and Indonesian governments, namely SATREPS Project for integrated study on mitigation of multimodal disasters caused by ejection of volcanic product. This device was first operated since October 2015 at an altitude of +742 m MSL, at a frequency of 9470 MHz with a maximum range of 30 km. The outputs generated from the radar
acquisition are reflectivity factor (ZH), Doppler velocity (V), Doppler velocity spectrum width (W), cross-polarization difference phase (dp),
specific differential phase (KDP), corporal correlation coefficient (HV), differential
reflectivity (ZDR), and rainfall intensity (R). Evaluation of the X-band MP radar rainfall error against ground rainfall is carried out using G/R
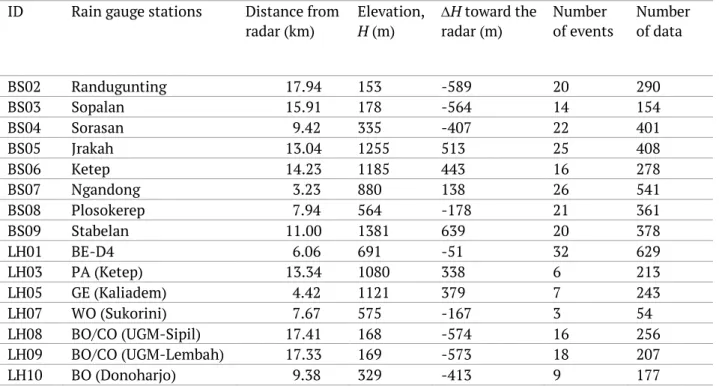
ratio method by considering the factor that affects its value, namely the elevation difference between the X-band MP radar and rain gauges. A total of 4590 pairs of 10-minute rainfall data from X-band MP radar and 15 selected rain gauges were used in this analysis. All rainfall data are selected from several events during 2016-2018. The number of rainfall events and data for each station can be seen in Table 1. To avoid misinterpretation in the comparison of radar and ground rainfall, we select rainfall data which depth >0 mm, both radar data and rain gauges data.
In this study, the radar rainfall values are derived from the area of one pixel that is parallel to the location of the rain gauge station. To specify ground elevation at each pixel, DEM data is also used in this study. The ground elevation data
will later be used in the evaluation and correction analysis of radar rainfall as a function of elevation. DEM data are ALOS PALSAR 2010 imagery with a resolution of 12.5 m (DAAC, 2015). DEM resolution will be resampling from 12.5 m to 150 m to conform to the radar data resolution.
The relationship characteristics between radar rainfall and ground rainfall are evaluated using the Log (G/R), correlation coefficient (CORR), fractional standard error (FSE), and root mean square error (RMSE) parameters. The best value of Log (G/R), FSE, and RMSE is 0, while the best value of CORR is 1. CORR = ∑ (𝑅𝑖−𝑅 ) ∑ (𝐺𝑖−𝐺 ) 𝑛 𝑖=1 𝑛 𝑖=1 √∑ (𝑅𝑖−𝑅 )2 ∑ (𝐺𝑖−𝐺 ) 2 𝑛 𝑖=1 𝑛 𝑖=1 (7) FSE = √∑𝑛𝑖=1(𝑅𝑖− 𝐺𝑖)2 𝑛 ∑𝑛𝑖=1𝐺𝑖 𝑛 RMSE = √∑𝑛𝑖=1(𝑅𝑖−𝐺𝑖)2 𝑛 (9)
Table 1. Selected rainfall events for analysis
ID Rain gauge stations Distance from
radar (km) Elevation, H (m)
H toward the
radar (m) Number of events Number of data
BS02 Randugunting 17.94 153 -589 20 290 BS03 Sopalan 15.91 178 -564 14 154 BS04 Sorasan 9.42 335 -407 22 401 BS05 Jrakah 13.04 1255 513 25 408 BS06 Ketep 14.23 1185 443 16 278 BS07 Ngandong 3.23 880 138 26 541 BS08 Plosokerep 7.94 564 -178 21 361 BS09 Stabelan 11.00 1381 639 20 378 LH01 BE-D4 6.06 691 -51 32 629 LH03 PA (Ketep) 13.34 1080 338 6 213 LH05 GE (Kaliadem) 4.42 1121 379 7 243 LH07 WO (Sukorini) 7.67 575 -167 3 54 LH08 BO/CO (UGM-Sipil) 17.41 168 -574 16 256 LH09 BO/CO (UGM-Lembah) 17.33 169 -573 18 207 (8)
The effect of elevation difference (H) on radar rainfall estimation error is analyzed using Equations (2) to (6). The Log (G/R) value is evaluated based on the elevation difference (H) function between the radar and the rain gauge stations. The relationship between H and Log (G/R) is examined through a regression line. Based on this relationship, a regression equation (Equation 3) is produced, which is then used to solve Equations (4) to (6). Equation (6) is a correction factor for the radar rainfall estimates. After the correction factor is applied to the radar rain forecast, the results will be re-compared to ground rainfall, and re-evaluated using the same parameters as the previous evaluation.
5 RESULT AND DISCUSSION
Based on the analysis of 4590 samples of 10-minute rainfall intensity in 15 rain gauge locations, the average intensity (µ) of 10-minute rainfall on the Mt. Merapi region is 7.40 mm/hour with a standard deviation () of 13.21 mm/hr. Light rainfall (≤20 mm/hour) with long
duration (> 2 hours) occurred more frequently than heavy rainfall. About 77.45% of 10-minute rainfall at Mt. Merapi region is rainfall with an intensity of 0.06 - 8.04 mm/hour. This also shows that there is a significant disparity between light and heavy rainfall. Considering the differences in characteristics between light and heavy rainfall, the evaluation of radar rainfall is carried out separately for light and heavy rainfall. In this analysis, the classification of light rainfall and heavy rainfall is determined based on the mean and standard deviation value. Since the standard deviation value is considerably higher than the mean value, as well as the mean value skewing to the left, the boundary between light and heavy rainfall is set by µ+ (= 20.6120 mm/hour). Thus, rainfall intensity ≤20 mm/hour is classified as light rainfall, while rainfall intensity >20 mm/hour as heavy rainfall. The bottom threshold for heavy rainfall intensity obtained in this analysis is practically the same as the minimum value of rainfall with a risk of lahar stated by Putra, S.S, et al., (2019). Figure 3 presents a scatter plot of the relationship between the radar rainfall and
ground rainfall depth which based on the rainfall classification.
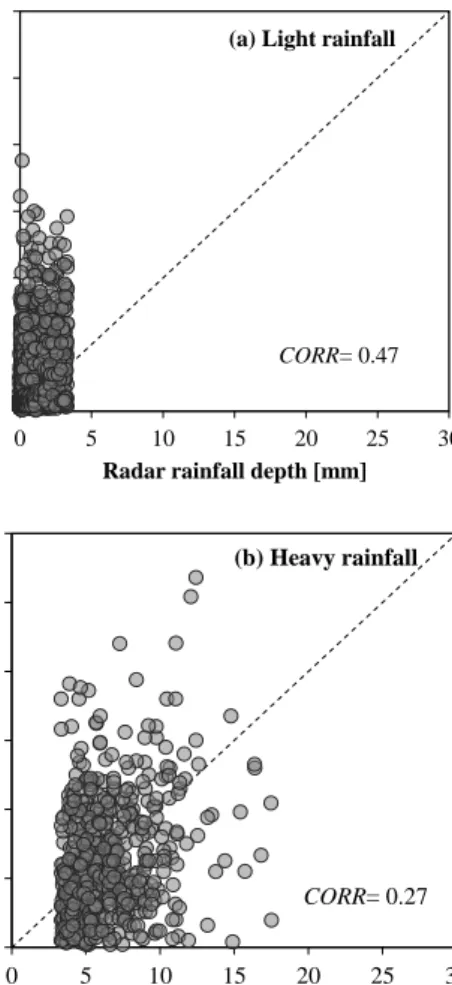
Figure 3. The scatter plots of the relationship between the radar rainfall and ground rainfall depth
Based on Figure 3, it appears that the relationship between radar rainfall and ground rainfall is not good enough. It is indicated by the deficient correlation coefficient. Those correlation coefficient values also showed the differences in the relationship character between radar rainfall and ground rainfall for light and heavy rainfall conditions. A CORR value of 0.47 for light rainfall represents a moderate relationship, while a CORR value of 0.27 for heavy rainfall represents a poor relationship. In light rainfall conditions, estimated radar rainfall tend to be smaller than ground rainfall.
Some estimated radar rainfall even give a value of less than one-third of ground rainfall. It is hard to define the relationship between radar rainfall and ground rainfall in heavy rainfall conditions due to the randomness of the pattern.
0 5 10 15 20 25 30 0 5 10 15 20 25 30 G rou n d r ain fall d ep th [m m ]
Radar rainfall depth [mm] (a) Light rainfall
CORR= 0.47 0 5 10 15 20 25 30 0 5 10 15 20 25 30 G rou n d r ain fall d ep th [m m ]
Radar rainfall depth [mm] (b) Heavy rainfall
The low CORR value also shows this randomness. Thus, it will be tougher to obtain a good correction result for radar rainfall estimates in heavy rainfall condition than in light rainfall condition. Based on those conditions, it suspected that the error of radar rainfall estimates in heavy rainfall condition might be caused by rainfall attenuation.
As mentioned in previous studies (Burcea, et al., 2012; Hirano et al., 2014; Shi et al., 2017; Yoon and Bae, 2013) that X-band radar cannot avoid attenuation caused by heavy rainfall. In this study, the relationship between Log (G/R) and
H in light rainfall condition is defined by a second-order polynomial regression, whereas for heavy rainfall, it is characterized by linear regression.
Determination of the regression types is simply based on the values distribution characteristics of Log (G/R) against H, which gives the least-square error. Mathematically, It is also less possible to derive non-linear equations which the minimum extreme point position (gradient value = 0) in the middle (elevation difference = 0), as a limitation of the procedure to show that the assumption of best correlation is if the elevation of the ground rain gauge equal to the radar elevation.
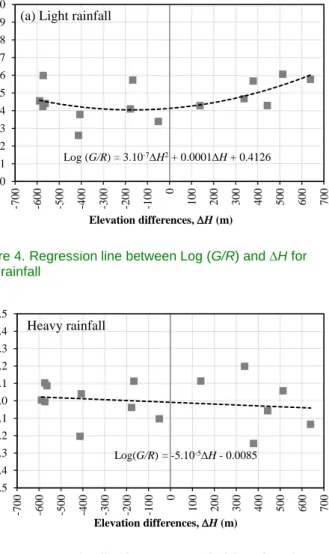
The regression graph of the relationship between Log (G/R) and H is shown in Figure 4 and Figure 5. The regression formula for light rainfall (RL) and heavy rainfall (RH) are as follows.
Light rainfall (RL):
Log(𝐺/𝑅) = 3.10
−7𝛥𝐻
2+ 0.0001𝛥𝐻 + 0.4126
Heavy rainfall (RH):Log(𝐺/𝑅) = −5.10
−5𝛥𝐻 − 0.0085
Based on the regression line in Figure 4 and Figure 5, the Log (G/R) value is seen to increase with increasing elevation difference between radar and rain gauge. The differences between the radar rainfall and ground rainfall depth are getting smaller with the smaller elevation
Figure 4. Regression line between Log (G/R) and H for light rainfall
Figure 5. Regression line between Log (G/R) and H for heavy rainfall
Based on the regression lines for both light rainfall and heavy rainfall conditions, the optimal Log (G/R) value is given at H = -178 m. The regression formula is used to calculate the value of f(H) for each station which is then applied for correcting radar rainfall estimates through Equation (6). The evaluation result of the radar rainfall correction is given through the Log (G/R)c, FSEc, and RMSEc values, as shown in Figure 6 and Table 2.
In general, the value of Log (G/R) decreased significantly after radar rainfall correction applied, except at the BO (Donoharjo) station. Averagely, Log (G/R) value decreased by 81.1%. An increasing of Log (G/R)c value at the BO
(Donoharjo) station is caused by the characteristics of correction factor and rainfall data. The characteristic of the correction factor for heavy rainfall increases the estimated rainfall
Log (G/R) = 3.10-7H2+ 0.0001H+ 0.4126 0.0 0.1 0.2 0.3 0.4 0.5 0.6 0.7 0.8 0.9 1.0 -70 0 -600 -50 0 -40 0 -30 0 -20 0 -10 0 0 100 200 300 400 500 600 700 L og ( G/R ) Elevation differences, H (m) (a) Light rainfall
Log(G/R) = -5.10-5H- 0.0085 -0.5 -0.4 -0.3 -0.2 -0.1 0.0 0.1 0.2 0.3 0.4 0.5 -700 -600 -500 -400 -300 -200 -100 0 100 200 300 400 500 600 700 L og ( G/R ) Elevation differences, H (m) Heavy rainfall
vice versa reduce the estimated rainfall depth for locations higher than the radar site. Since the elevation of BO (Donoharjo) station is lower than the radar station, rainfall depth is corrected to become higher, whereas the radar rainfall depth at this location is averagely higher than ground rainfall in heavy rainfall condition. Investigation regarding the characteristics of ground rainfall at BO (Donoharjo) station is needed to answer the problems that arise from this analysis. This action is considered crucial since the quality improvement of radar rainfall estimates based on ground rainfall depends on the quality of rain gauge data and the well-validated method, as stated by (Sahlaoui, Z & Mordane, S, 2019).
Figure 6. The relationship between Log (G/R) and H before and after applying the correction factor
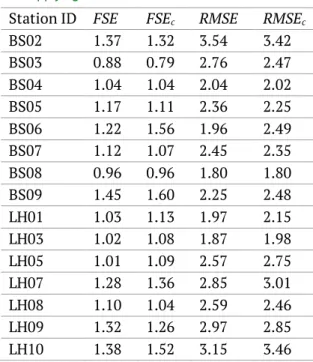
Table 2. Values of FSE and RMSE Index before and after applying the correction factor
Station ID FSE FSEc RMSE RMSEc
BS02 1.37 1.32 3.54 3.42 BS03 0.88 0.79 2.76 2.47 BS04 1.04 1.04 2.04 2.02 BS05 1.17 1.11 2.36 2.25 BS06 1.22 1.56 1.96 2.49 BS07 1.12 1.07 2.45 2.35 BS08 0.96 0.96 1.80 1.80 BS09 1.45 1.60 2.25 2.48 LH01 1.03 1.13 1.97 2.15 LH03 1.02 1.08 1.87 1.98 LH05 1.01 1.09 2.57 2.75 LH07 1.28 1.36 2.85 3.01 LH08 1.10 1.04 2.59 2.46 LH09 1.32 1.26 2.97 2.85 LH10 1.38 1.52 3.15 3.46
Dissimilar with the value of Log (G/R)c, the FSEc
and RMSEc index gives unsatisfied values. Only a portion of the FSE and RMSE index values decreased after the correction applied to radar rainfall, while others showed contrary. The FSEc index represents the relationship between the fractions of corrected radar rainfall and ground rainfall. The increase of FSE value indicates that the average deviation of radar rainfall and ground rainfall fractions increases relatively to the ground rainfall. The RMSEc index represents the average deviation of radar rainfall against ground rainfall. The characteristics of the RMSE
index can be seen through the scatter plots in Figure 7. Scatter plots in Figure 7 shows the relationship between radar rainfall before and after correction with ground rainfall for all rain gauges locations.
Figure 7. The scatter plots of the radar rainfall against ground rainfall (a) before correction (b) after correction
-1.0 -0.8 -0.6 -0.4 -0.2 0.0 0.2 0.4 0.6 0.8 1.0 -700 -600 -500 -400 -300 -200 -100 0 100 200 300 400 500 600 700 L og (G /R) Elevation differences, H (m)
before correction after correction
0 5 10 15 20 25 30 0 5 10 15 20 25 30 G roun d ra in fall depth [m m ]
Radar rainfall depth[mm]
(a) before correction
0 5 10 15 20 25 30 0 5 10 15 20 25 30 G rou n d r ain fall d ep th [m m ]
Radar rainfall depth [mm]
Based on Figure 7 (a), it is that a lot of values spread away from the diagonal line, especially for heavy rainfall. It indicates that the radar rainfall estimates error is considerable high, either underestimation or overestimation. After the correction was applied, most of the values clustered on the diagonal line as the radar rainfall error decreased (Figure 7b), particularly rainfall with a depth of ≤3.33 mm (equal 20
mm/hr). However, some values show an increase in radar rain estimates error. This case only occurs in some rain gauge locations.
6 CONCLUSIONS
The radar rainfall correction based on the elevation function is simple to apply. Besides, corrected rainfall information can be delivered in real-time. Generally, this method gives reasonably good results, particularly in the G/R
ratio. Since the G/R ratio parameter is based on the comparison of rainfall accumulation values, this method is better applied for correcting rainfall with longer time accumulation (30-minutes, hourly, and so on). The application of this method for correcting radar rainfall with 10-minute time accumulation is relatively good, yet it not been satisfied for some evaluation parameters. A factor that is allegedly contributing to the low-ability of this method in improving the estimated value of rainfall fraction is the limited number of rain gauges stations that represent the elevation of the study area comprehensively.
For further works, the use of more rainfall data with different characteristics is needed to evaluate the performance of the correction method. In line with that, additional rain gauge stations are required so that the elevation conditions of the study area can be represented better.
ACKNOWLEDGMENTS
The authors would like to express their gratitude to the Hydraulic Laboratory, Department of Civil and Environmental Engineering, Universitas Gadjah Mada, and Balai Sabo, Ministry of Public Works and Housing, Republic of Indonesia for the
JST/JICA – SATREPS Project for the supporting facilities that was given to the Civil Engineering Department Bangka Belitung University. At last, we want to thank the Indonesia Endowment Fund for Education (LPDP), Ministry of Finance Republic of Indonesia, which provides financial support for this study.
REFERENCES
Allegretti, M, et al., 2012. X-Band Mini Radar for Observing and Monitoring Rainfall Events..
Atmospheric and Climate Sciences, Volume 2, pp. 290-297.
Burcea, S, Cheval, S, Dumitrescu, A & Antonescu, 2012. Comparison between Radar Estimations and Rain Gauge Precipitations in the Moldavian Plateau (Romania). Environmental Engineering and Management Journal, p. 723–731.
DAAC, A., 2015. ALOS
PALSAR_Radiometric_Terrain_Corrected_high_res; Includes Material © JAXA/METI 2010. [Online] Available at: DOI: 10.5067/Z97HFCNKR6VA [Accessed 24 October 2017].
Delrieu, G, et al., 2009. Weather Radar and Hydrology.. Advances in Water Resources, 32(7), pp. 969-974.
Gabella, M, Joss, J & Perona, G, 2000. Optimizing Quantitative Precipitation Estimates Using a Noncoherent and a Coherent Radar Operating on the Same Area. Journal of Geophysical Research,
105(D2), p. 2237–2245.
Gabella, M, Joss, J, Perona, G & Galli, G, 2001. Accuracy of Rainfall Estimates by Two Radars in the Same Alpine Environment Using Gage Adjustment.. Journal of Geophysical Research,
106(D6), p. 5139–5150.
Germann, U, Galli, G, Boscacci, M & Bolliger, M, 2006. Radar Precipitation Measurement in a Mountainous Region.. Quarterly Journal of the Royal Meteorological Society, 132(618A), p. 1669– 1692.
Hambali, R, et al., 2018. Rain Behaviour at Mt. Merapi Area as Observed by XMPR and ARR..
Applied Mechanics and Materials, Volume 881, pp. 34-41.
Hirano, K, et al., 2014. Composite Rainfall Map from C-band Conventional and X-band Dual-polarimetric Radars for the Whole of Japan, Garmisch-Partenkirchen, Germany. 8th European Conference on Radar in Meteorology and Hidrology, pp. 1-5.
Hong, Y & Gourley, J.J, 2015. Radar Hydrology: Principles, Models, and Applications, s.l.: Boca Raton: CRC Press..
Krajewski, W.F, Villarini, G & Smith, J.A, 2010. Radar-Rainfall Uncertainties.. Bulletin of the American Meteorological Society, 91(1), pp. 87-94. Orellana-alvear, J, Rolando, C, Rollenbeck, R & Bendix, J, 2019. Optimization of X-Band Radar Rainfall Retrieval in the Southern Andes of Ecuador Using a Random Forest Model. Remote Sensing, 11(1632), pp. 1-20.
Ozkaya, A & Akyurek, 2019. Evaluating the Use of Bias - Corrected Radar Rainfall Data in Three Flood Events in Samsun, Turkey. Natural Hazards.
Putra, S.S, et al., 2019. Point-Based Rainfall Intensity Information System in Mt. Merapi Area by X-band Radar. Journal of Disaster Research,
14(1), pp. 80-89.
Rossa, AM, Cenzon, G & Monai, M, 2010. Quantitative Comparison of Radar QPE to Rain Gauges for the 26 September 2007 Venice Mestre Flood.. Natural Hazards and Earth System Science,
10(2), pp. 371-377.
Sahlaoui, Z & Mordane, S, 2019. Radar Rainfall Estimation in Morocco : Quality Control and Gauge Adjustment.. Hydrology, Volume 6, pp. 1-13.
Sebastianelli, S, 2012. Quantitative Precipitation Estimates from Dual-Polarization Weather Radar in Lazio Region. Roma, Sapienza Universita.
Sebastianelli, S, Russo, F, Napolitano, F & Baldini, L, 2013. On Precipitation Measurements Collected by a Weather Radar and a Rain Gauge Network. Natural Hazards and Earth System Science, 13(3), p. 605–623.
Shakti, P.C, et al., 2012. Rainfall Estimation in Mountainous Regions Using X-band Polarimetric Weather Radar.. s.l., The Seventh European Conference on Radar in Meteorology and Hydrology..
Shi, Z, Chen, H, Chandrasekar, V & He, J, 2017. Deployment and Performance of an X-band Dual-Polarization Radar during the Southern China Monsoon Rainfall Experiment..
Atmosphere, 9(4), pp. 1-20.
Tabary, P, 2007. The New French Operational Radar Rainfall Product, Part I : Methodology. American Meteorological Society, Volume 22, pp. 393-408.
Van De Beek, C.Z, et al., 2010. Performance of High-Resolution X-band Radar for Rainfall Measurement in The Netherlands. Hydrology and Earth System Sciences, 14(2), pp. 205-221.
Villarini, G. & Krajewski, W.F, 2010. Review of the Different Sources of Uncertainty in Single Polarization Radar-Based Estimates of Rainfall..
Surveys in Geophysics, 31(1), pp. 107-129.
Yoon, S.-S. & Bae, D.-H, 2013. Optimal Rainfall Estimation by Considering Elevation in the Han River Basin, South Korea. Journal of Applied Meteorology and Climatology, p. 802–818.
Young, C.B, et al., 1999. An Evaluation of NEXRAD Precipitation Estimates in Complex Terrain.. Journal of Geophysical Research,
104(D16), p. 19691–19703.
Yu, N, Gaussiat, N & Tabary, P , 2018. Polarimetric X‐band Weather Radars for Quantitative Precipitation Estimation in Mountainous Regions.. Quarterly Journal of the Royal Meteorological Society, 144(717), pp. 2603-2619.