KIEV
INTERNATIONAL
INSTITUTE
OF SOCIOLOGY
KYIV / 2015
CORRUPTION IN UKRAINE
COMPARATIVE
ANALYSIS OF NATIONAL
SURVEYS:
2007, 2009, 2011, AND 2015
EXECUTIVE SUMMARY
///3KEY FINDINGS
///8INTRODUCTION
Survey methodology ///13
The general characteristics
of the 2015 survey sample ///14
Opportunities and limitations ///14
1. PERCEPTIONS OF KEY PROBLEMS
///172. ATTITUDES TOWARD THE GOVERNMENT
Trust in government ///19
Responsibility for the fight against corruption ///21
The government’s willingness to fight corruption ///22
3. PERCEPTIONS OF CORRUPTION
Sources of information on cases of corruption ///24
Leading causes of corruption ///25
Can corruption be justified? ///26
Changes in the level of corruption ///27
Spread of corruption and the effectiveness
of the preventative measures ///32
Overall citizens’ corruption perception
index by region ///36
4. CITIZENS’ EXPERIENCES
WITH CORRUPTION
Citizens’ transactions with government
agencies and services ///38
Citizens’ experiences of corruption encounters ///40
Extortion, voluntary bribes and use
of personal connections (by sector) ///41
Citizen victimization by corruption ///46
Overall corruption experience indices by region ///50
Corruption within healthcare system ///53
Corruption in schools ///56
Corruption within the state auto
inspection (SAI) agency ///60
5. CITIZEN RESPONSES TO CORRUPTION
Filing complaints and standing up for one’s rights ///63
Corruption in Ukraine:
Comparative Analysis
of National Surveys:
2007, 2009, 2011,
and 2015
This report was prepared by the Kiev International Institute of Sociology in coordination with Lake Research Partners and Karakoyun Strategies in the framework of the USAID funded project «The Ukraine National Initiatives to Enhance Reforms (UNITER)» implemented by PACT, Inc. Ukraine. Presented in the report are comparative results of National sociological surveys on the state of corruption in Ukraine conducted in 2007, 2009, 2011, and 2015. The survey was targeted at measuring public perception of the problem of corruption and its experience with it. This report is intended to reach a wide readership.
EXECUTIVE SUMMARY
T
hanks to the UNITER project (TheUkraine National Initiatives to Enhance Reforms run by PACT, Inc. in Ukraine) and the USAID funding (the funds re -ceived from The United States Agency for International Development), in July – October 2015 we carried out a massive pan-Ukrainian sur-vey on the state of corruption in Ukraine. In our re -search, we used the methodology tried and tested in 2007–2009 in the three preceding survey waves aimed, in particular, at studying people’s percep -tion of corrup-tion and their experience of corrup -tion encounters.
The goal set for this research was to monitor the changes in citizens’ corruption perception and experiences in Ukraine over an extended period of time. The baseline research conducted in early 2007 formed the basis for further comparison of our findings of 2009 and 2011, as well as the latest data collected in 2015. All these studies were car -ried out by the Kiev International Institute of Sociol -ogy (KIIS), managed by the MSI (Management Sys -tems International) in 2007–2009 and conducted for the UNITER project in 2011 and 2015. The last wave was also conducted in coordination with Lake Research Partners and Karakoyun Strategies.
Over the researched period of time, reforms and various measures targeting corruption in Ukraine have been planned and partly introduced by various branches of power, the donor commu -nity, NGOs and other organizations. Besides, this period has brought many important political and economic events that could influence people’s perception of corruption and cause changes in cor -rupt behavior. In particular, there have been sev -eral reshuffles in governing teams. Multiple waves of financial crises also led to decreasing business activity and lowering life standards. Dramatic
events of Euromaidan raised the issue of corrup-tion to a new level and have affected citizens’ tol -erance and expectations to the fight against it. In many cases, the findings of 2015 support the con -clusions of the preceding years and prove the sta-bility of peoples’ ideas about corruption, but they also show some changes.
Corruption may include many forms of behav -ior. In this survey, we defined corruption as the mis -use of public office for private gain. Therefore, cor -ruption occurs when people who are paid from the state budget request or take bribes, gifts or favors; abuse their government position; use their influ -ence for their own personal benefit; show favorit -ism; or practice nepotism. Sometimes, corruption involves the transfer of money or gifts, but it always includes attempts to seek or use influence beyond what is legal. This definition was also proposed to the respondents.
This research of the situation with corruption in Ukraine lets us evaluate people’s actual experi-ence of corruption from several standpoints.
Firstly, the subjective perception of frequency corruption is encountered with was measured with the help of the question “How frequently do you encounter any form of corruption?” We can state that the general level of corruption in Ukraine re
-mains very high. Nearly two thirds of respondents (65.6%) indicate that they have encountered cor
-ruption over the past 12 months – and one fifth (20.5%) experience it at least once a month (Graph A). It should be noted that this may account for different sides of corrupt activities, such as per -sonal participation or reports by other people and media or witnessing due to one’s professional activ -ity as an investigation officer, a journalist etc.
Secondly, detailed questions about extortion, voluntary bribing, and using personal connections
to reach one’s goal let us calculate the share of citi -zens involved in acts of corruption one way or an-other over the year preceding the study. According to this detailed evaluation, we documented 72.4% respondents reporting their actual corruption ex -perience in 2011. In 2015, 70.7% reported corrup -tion experience in the observed sectors. This means that the share of people involved in corruption acts has somewhat decreased in the past 4 years (the difference being statistically significant on the level of р=0.01). Such a high level of involvement in cor -ruption could be explained by the fact that in the three sectors (healthcare services, secondary edu -cation and traffic police) it was studied with ques -tions about particular ac-tions, and not all suggested actions could be taken by some people as corrup -tion-related (for instance, collecting money to buy flowers or gifts for teachers or buying disposable instruments for a medical examination).
Keeping in mind the fact that corruption always has two parties, let us review the same figure in particular types of corruption. Analysis shows that its minor reduction was due to decreasing volun
-tary bribe offers from consumers of state services (Graph B). Naturally, the crisis in the country may have caused certain impoverishment of the popula-tion – and now the latter can afford spending less in unofficial extra payments to state officers. Howev -er, our research findings in other parts of the study also indicate that Ukrainian citizens have grown more conscientious too.
Thirdly, the same questions are used to esti -mate the spread of corruption in various sectors of state services. With this purpose, we traditionally use indicators of corruption experiences calculated as an average number of sectors where people have encountered corruption among the overall number of the sectors offered for evaluation.
The study of intensity of particular forms of corruption shows some decrease in all the stud -ied corruption manifestations. This refers to extor -tion (22.3% compared to 25.8% in 2011), voluntary bribes (7.0% compared to 10.0% in 2011), and using personal connections (12.8% compared to 15.3% in 2011). It is worth noting that voluntary bribing is the only form of corruption in the Ukrainian soci
-Graph A. How Frequently do You Encounter Any Form of Corruption?
18.0%
Difficult to say / Refusal4.7%
Daily4.2%
Weekly30.7%
A few times per year11.6%
Monthly16.5%
Never14.4%
YearlyEXECUTIVE SUMMARY
ety that has not been increasing during the stud
-ied period (Graph С). Even during the period of 2009–2011, when we documented growth in the other two forms of corruption (extortion and using personal connections), voluntary bribing remained on the same level.
Corruption is revealed unevenly in our soci -ety – its level indicators increase for some sectors and decrease for others, and this tendency is sta -ble from the first waves of research. Nevertheless, leading practitioners of corruption (in particular, of such infamous ones like extortion) are the same – these are state healthcare institutions, secondary schools and militsiya. We have documented no sta -tistically significant changes in the bribery levels in these sectors over the past period.
Along with the actual corruption experience, we also studied its perception by the whole pop -ulation, including the less active part that had no contact with certain or any state institutions. The comparative analysis of the 2007 and 2009 re -search findings revealed a decrease in the actual corruption experiences but an increase in percep
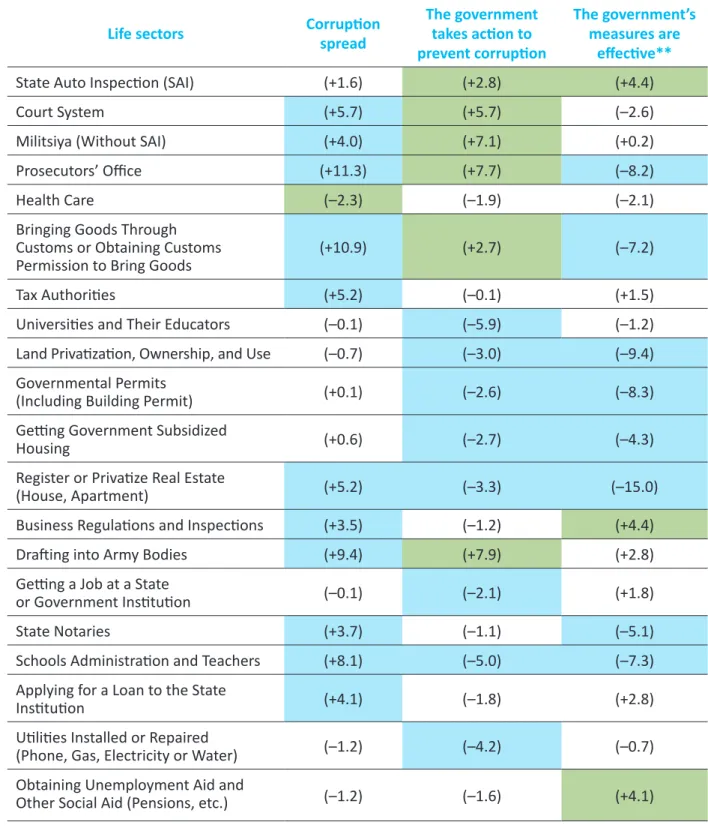
-tion of corrup-tion spread. In 2011, our study docu -mented certain changes in the situation: the level of citizens’ corruption perception was the same, while the actual corruption experiences grew more intense (though not more widespread). Foremost, it was caused by the growth in the number of state institutions where people were exposed to outspo -ken extortion practiced by state officials. The latest study of 2015 shows the return to the dynamics of the early stages: people perceive corruption in the state sector as growing, though this conclusion is not backed by actual experiences (Graph D). We can say that info-coverage of corruption disclosures in media contributes to this growth.
A good example of an effective information policy is the militsiya reform, i.e. creation of the new police. About half of respondents (48.6%) have not formed their opinion of this unit yet, and this uncertainty can be explained by the fact that new patrol has started working in few regions only by the data collection time. However, this led to 30.7% of respondent’s stating that there is no corruption at all among the policemen. Moreover, this rate is Graph B. Dynamics of Citizens’ Experience with Corruption
Experience
of extortion of voluntary bribesExperience Any experience
2011
2015
2011
2015
2011
2015
57.1%
56.8%
35.6%
70.7%
40.5%
72.4%
the highest among all the listed sectors; the near -est one is applying and receiving social benefits (22.5%). The proportion of those aware of anticor -ruption actions in the police is also one of the high -est (22.9%) and is smaller only compared to other legal and judicial system representatives (such poli -cies in the traffic police, militsiya, the court system and the public prosecutor’s office). Nevertheless, the efficiency of anticorruption actions is also con -sidered one of the highest – 71% regard it as effec -tive, which is the third result coming right after ap -plication for social benefits (81.0%) and providing communal services (73.8%).
The groups of people facing corruption most often remain the same as in the preceding years: these are representatives of younger age groups and people with high level of education and in -come. At the same time, representatives of these groups are usually also the most active fighters against corruption.
The study also reveals some progress on is
-sues related to civic activity. On the one hand, the actual behavior of citizens is still rather pas
-sive: the share of those who submit complaints against corrupt officials, does not exceed 2% of victims; still only one third of the population de
-clares their readiness to confront corrupt. How
-ever, on the other hand, the part of people plac
-ing major responsibility for address-ing corrup
-tion on usual citizens is steadily growing (from 15.8% in 2007 to 18.0% in 2011 and up to 24.0% in 2015), and, in addition, those who declare their willingness to stand for their rights in vari
-ous ways when facing extortion are becoming more active – and those unprepared to defend their rights in any way have become consider
-ably less numerous (Graph E).
Therefore, we observe some changes in the citizens’ minds, which, however, have not yet de
-veloped in their behavior. Graph C. Dynamics of the Indicators of Corruption in the Services
Experience of voluntary
bribes of extortionExperience personal connectionsExperience of using
9.9
22.1
13.7
10.0
25.8
15.3
7.0
22.3
12.8
2009
2011
2015
2009
2011
2015
2009
2011
2015
Note: Indices represent
mean values for corruption experience across entire sample for the sectors and institutions monitored in questionnaire
EXECUTIVE SUMMARY
Graph D. Citizens’ Corruption Perception Index
38.1
2009
39.4
2011
42.8
2015
Graph E. Measures You Would Take to Stand for Your Rights
* Changes significant at р=0,01 ** Changes significant at р=0,05 Demand rights from officials* Complain to supervisor* Do nothing* Come to agreement unofficially** Participate in demonstrations Seek help from NGO* Apply to enforcement bodies or court*
26.7%
22.3%
30.8%
6.9%
8.4%
7.2%
19.6%
26.7%
22.9%
32.9%
7.1%
6.8%
6.6%
17.6%
34.6%
30.7%
19.2%
4.1%
7.5%
10.4%
22.2%
2011
2015
2009
O
ther research findings concerning corruption trends are as follows:1. ATTITUDE
TO AUTHORITIES
1.1. After the events of 2014–2015, we can see decreasing levels of trust in authorities at all levels compared to 2011 which may be due to citizens’ unmet expectations of drastic changes in the coun -try. Similarly to all the preceding research stages, leading by the level of trust are local authorities that people usually have closer contact with (17.6% of respondents would rather trust local authorities compared to 20.1% in 2011). Next is the President with His Administration, though this governing in -stitution is trusted by little more than 10% of re -spondents (in 2011, President Yanukovych was trusted by 14.0%).
1.2. Despite the generally low level of trust in the governmental institutions, the population of Ukraine still views national authorities as the most responsible for addressing corruption. Like in all the preceding years of monitoring this issue, in 2015 most respondents place major responsi -bility for anticorruption activity on the President of Ukraine (60.6%), the Parliament, i.e. Verkhovna Rada (41.7%) and the Government, i.e. the Cabinet of Ministers (37.7%).
1.3. The part of people placing major respon -sibility for addressing corruption on usual citizens is steadily growing (from 15.8% in 2007 to 18.0% in 2011 and up to 24.0% in 2015). A higher level of civ -ic conscientiousness is seen in younger categories of the population (those under 45) and women are more conscientious even in the oldest age group, while aging men tend to place this responsibility on anyone but citizens themselves.
1.4. Not more than 14% of people believe that authority representatives are willing to fight cor
-ruption. Compared to 2011, this indicator is some -what lower for every level and branch of power. First of all, people believe in the willingness of local authorities (13.2%) and the President (12.3%).
1.5. The most thematic of all the issues suggest -ed for evaluation is the military operation in the east of Ukraine, which causes serious concern in 97% of respondents. Somewhat lower rated is the problem of high living costs (95%) traditionally seen as the most topical on the preceding stages of the study. The issue of corruption in everyday life is among the three leading ones (94.4%), though its particular case of corrupt authorities is nearly as serious (93.8%).
2.
CHANGES IN PERCEPTION
OF CORRUPTION
2.1. Traditional non-printed mass media are still leading in providing information on corrup -tion. Television and radio deliver such information to 28% of respondents. Print media go on losing their positions. Instead, the rate of people receiv -ing information on corruption via the internet has grown nearly three times bigger (from 4.4% in 2011 to 12.4% in 2015). Predictably, different media have different user structures. Thus, print media are mostly supported by older readers, while younger people tend to rely on the Internet.
2.2. People’s opinion about corruption main causes is rather deep-rooted. Corruption is seen as a result of joint influence of a number of factors. The major ones are officials willing to use their position for their own good (19.7%) supported by higher government’s unwillingness to address cor-ruption (12.9%) and people themselves being used to solving their problems this way (11.8%).
2.3. Half of the adult populations of Ukraine (49.8%) admit they may get involved in corrupt ac -tions when it is better for them, while 37.4% of respondents declare it to be totally unacceptable
KEY FINDINGS
KEY FINDINGS
for them. Unwillingness to accept corruption even for their own profit grows with age, but women are more tolerant to corruption compared to men. And, similarly to all the preceding years, young people are the most ready to use profitable cor -ruption connections.
2.4. Among those who tend to find an excuse for corruption, there are more people convinced that most Ukrainian residents will use corruption connec -tions when given the opportunity. They also believe more often that in Ukraine, one cannot get proper services without informal payment and they tend to explain their tolerance to corruption with striving to ‘equality’ among state officials and usual citizens – if the former may break the law, the latter should not be demanded that they stick to it. On the other hand, those who are strongly against corruption even for their own good agree more often than others that responsibility for corruption actions should be equal for both parties in such interactions and declare more willingness to uncover corruption actions.
2.5. The survey shows that 85.5% of the adult populations of Ukraine evaluate the general level of corruption in the society as above average. Only 1.8% of respondents believe that corruption is little spread or there is none at all.
2.6. This study confirms the tendency noticed on the preceding stages: supporters of political pow -ers that are currently in office (Petro Poroshen ko’s Bloc, ‘People’s Front’) tend to see positive changes in corruption levels and more rarely note that they are rising. At the same time, opposition supporters (the Opposition Bloc, left opposition powers) state that corruption is increasing much more often and they do not see any decrease in it.
2.7. Perception of corruption in all the branches of power and institutions of all levels has increased compared to 2011 but has not reached the level of 2009. And corruptors’ hierarchy also remains unchanged: still leading is Verkhovna Rada (60.6% of respondents have noted considerable spread of corruption there); the second is the Cabinet of Min -isters (54.8%); and the third is the President with his Administration (46.4%). Local authorities are tradi -tionally less corrupt in people’s perception (34.3%).
2.8. Similarly to earlier findings, top leaders in the rating of the most corrupt sectors (according to people’s perception) are the State Automobile In -spection and the judicial system – both are named to be very corrupt by two thirds of respondents (66.0%). The top five of the rating have not changed since the last time measure. Besides the abovemen -tioned SAI and the judicial system, militsiya (without the SAI), the state prosecutor’s office and the health -care system are also included in the top five.
2.9. In the basic monitoring year 2007, the me -dian index of citizens’ corruption perception was 33. The next year it reached 37 and remained on the same level in 2011. At this stage, our last survey reveals that this index has grown again and now it’s close to 41. Thus, 40.7% of all the major sectors and institutions in Ukraine are seen by its population as corrupt now.
2.10. According to people’s evaluation of the situation, the level of corruption perceived by the population has increased compared to 2011. This is shown by the growth of the total citizens’ corrup -tion percep-tion index for all popula-tion from 39.4 in 2011 to 42.8 in 2015.
3.
CHANGES IN THE ACTUAL
EXPERIENCES OF CORRUPTION
3.1. According to the survey findings, about 65.5% of respondents encounter corruption as par -ticipants or witnesses every year.
3.2. According to indirect estimates, over the past 12 months 70.7% of respondents have en -countered extortion, offered a bribe or looked for connections to be used in settling issues in at least one of the 20 analyzed sectors, which is not consid -erably lower than the findings of 2011 (72.4%, the difference being statistically significant at the level of р=0.01). This small decrease in the rate of the population involved in corruption relations over the past 4 years has become possible only due to the decrease of voluntary bribing initiated by state ser -vice consumers (from 40.5% to 35.6%).
3.3. Similarly to earlier findings, most frequently people are requested to pay unofficially when they turn to state healthcare institutions (69% of their us
-militsiya (50.7%), in institutions of higher education (48.7%), when receiving permissions from authori -ties (44.1%), when dealing with the SAI (42.7%).
3.4. Compared to 2011, we have documented a statistically significant decrease in extortion in such spheres as going through customs or receiving cus-toms papers (from 36.1% to 22.8%), getting connect -ed to communal services or getting them repair-ed (from 28.2% to 21.7%), dealing with levy authorities (from 26.0% to 15.5%), getting registered for or re -ceiving social aid (from 8.9% to 5.0%). Instead, more frequent are cases of extortion to receive a loan in a state institution (from 6.7% to 21.5%), when ad -dressing privatization issues or those connected with land ownership and use (from 32.0% to 39.4%), when turning to the court system (from 26.3% to 32.9%) and state notaries (from 11.1% to 16.4%).
3.5. Receiving most frequent bribe offers are representatives of institutions of secondary educa -tion (56.9%), state health care (32.3%) and the SAI (23.0%).
3.6. Over the years of our research, there has been a noticeable decrease in voluntary brib-ing frequency. Compared to 2011, it has generally decreased by 5%, which is from 40.5% in 2011 to 35.6% in 2015. We can assume that this is caused by people’s growing conscientiousness and not eco -nomic difficulties as the most noticeable decrease in voluntary bribing is demonstrated by non-pen-sioners (aged 18-59) with higher education and in -come that is above average.
3.7. The most significant decrease in voluntary bribing has been documented in attempts to receive lodging from the state (from 29.5% to 10.3%), in contacts with representatives of higher education in-stitutions (from 25.5% to 16.2%), tax services (from 14.0% to 5.6%), the SAI (from 30.4% to 23.0%) and militsiya (from 20.6% to 14.5%). Though population groups contacting some state institutions may be small, all these differences are statistically significant.
3.8. The rate of voluntary bribes in state sec -ondary schools, healthcare institutions, employ -ment in state institutions, contacts with levy au -thorities, connection to and repairs of communal
also decreased.
3.9. Compared to 2011, voluntary bribing has shown statistically significant growth in one sector only – that is getting a loan from a state institution
(from 2.2% to 7.9%).
3.10. The spread of using personal connec -tions as a ‘mild’ form of corruption is traditionally between extortion and voluntary bribing. Most of -ten people resort to personal connections to get employment with a state institution (32.7%), in the field of entrepreneurship regulation (26.1%), to receive all sorts of permissions from authorities (23.1%), to register or privatize real estate objects (21.3%), in issues of land privatization, ownership or use (20.2%), and trying to receive lodging from the state (20.1%).
3.11. The overall part of people used to re -sort to personal connections to settle their pri -vate issues has somewhat decreased over the past 4 years. Compared to 2011, the use of personal connections has significantly decreased in contacts with tax services (from 23.5% to 10.9), levy authori-ties (from 22.5% to 13.0%), militsiya (from 25.2% to 18.0%), when receiving permissions from state au-thorities (from 30.3% to 23.1%), and when dealing with representatives of institutions of higher educa-tion (from 20.5% to 15.4%).
3.12. Voluntary bribing is three times less fre -quent than extortion, while in 2009 the difference was 1 to 2. The change in this correlation has hap -pened with simultaneous spread of extortion and decrease in voluntary bribing. Real extortion expe -riences happen in every fifth contact with an official (22% of the cases), while only in 7% of the cases do people initiate bribery themselves. People use personal connections more often than offer bribes, that is in about 13% of the cases.
3.13. The highest of all the corruption encoun -ter indices in Ukraine is always the extortion index (CEI-E), while the lowest is the voluntary bribing in -dex (CEI-B), the personal connections in-dex (CEI-C) being between these two. Thus, most frequently a situation with corruption is provoked by a state of -ficial – and when there is no direct extortion, Ukrai
KEY FINDINGS
nians try to find a useful connection before offering a bribe directly.
3.14. Representatives of younger age groups and people with higher levels of education and in -come face extortion more often, but they resort to voluntary bribing more frequently too. Only pen -sioners enjoy lower extortion levels now.
3.15. More corruption of all the three forms is encountered by urban residents in comparison with villagers.
3.16. People with a higher index of extortion are more likely to believe that the state does not address corruption sufficiently.
4.
CHANGES IN THE ACTUAL
CORRUPTION EXPERIENCES
IN THE THREE SECTORS
4.1. Corruption in the healthcare system: • The state healthcare system has been leading
by the number of people turning to it: its insti -tutions are visited by over two thirds of adult Ukrainians or their family members. In the years of monitoring, the situation with bribery in health care has seen virtually no change: over a half of patients (57%) have to provide themselves with medicines and instruments at the doctor’s – and 22% consider it to be their obligation even without being forced to do so; also, half of people (55%) are forced to make donations to hospital funds – and 14% of pa -tients have done this voluntarily; one third (38%) were extorted unofficial payment for the provided services – and 13% offered such pay -ment to a medical worker themselves.
• Similarly to the preceding research findings, people largely support combining motivation and punishment steps to address corruption in the sector; but compared to the preced -ing years, preference for punishment is grow-ing stronger, while support for extra fundgrow-ing is decreasing. Thus, the first place is taken by placing greater responsibility for corruption ac -tions on healthcare personnel meaning firing disclosed corruptors (44%), which is followed by providing extra budget money to healthcare
(43%), enforcing greater administrative and criminal responsibility for corruption (40%), providing better healthcare funding and in -creasing healthcare worker salaries (39.1%). 4.2. Corruption in schools:
• Among the 22.5% of respondents with school-going children, significant parts are involved in various acts of corruption.
• The spread of corruption practices in this sec-tor has enjoyed virtually no change in the years of our research. The main form of corruption is still collecting money for class/school funds (56% extorted, 32% voluntary), paying for classroom repairs/remodeling (56% extorted, 31% voluntary) and collecting money to buy flowers or gifts for teachers (33% extorted, 44% voluntary). Some increase is seen in the rate of parents pushed towards dishonest means to get their children accepted to the school they have chosen, of those who agree to pay for better marks to be given to their kids, and those forced to buy tutor services in the school.
• Like in the healthcare sector, most parents con-sider raising teacher salaries (54%) and better funding of the educational sector (48%) as effec-tive means of addressing corruption in second-ary schools. However, similarly to the healthcare sector, compared to 2011, people have become more supportive of introducing punishment for educationists caught in the act of corruption: 44% of parents are for greater administrative and criminal responsibility for corruption and for firing those caught in corruption with further ban on their professional activity.
4.3. Corruption in the SAI:
• The situation with bribing in the SAI remains complicated. The rate of people who encoun-tered corruption in this sector has somewhat decreased compared to 2011 but it’s still signifi-cant: according to the findings of 2015, extorted or voluntarily bribing have been 60% (compared to 67% in 2011). And this decrease in corruption
extortion as with fewer offers from drivers. • The most widespread form of corruption acts
in contacts with SAI workers is still unofficial payment for violating traffic rules. The rate of people who faced extortion is 44%, while 19% initiated the process themselves.
• Compared to 2011, corruption has decreased in the cases of issuing driving licenses (extortion has fallen from 20% to 17% and voluntary brib -ing has dropped from 11% to 7%) and technical inspection of vehicles (extortion changing from 29% to 20%, voluntary bribing going down from 19% to 9%). We accepted evaluation from the re -spondents who went through such procedures. • Unlike representatives of health care and sec
-ondary education, SAI workers are not seen as ‘involuntary’ corruptors, so drivers recommend that punishment for corruption and abuse be made more severe to fight bribing on the road more efficiently.
5. REACTIONS TO CORRUPTION
5.1. Only 2% of people have tried to stand up for their rights before officials. The main reason for non-complaining about officials’ actions is still being convinced that such an attempt will be useless any -way. However, compared to the preceding years, the proportion of those who deem complaining about corruption useless has decreased by nearly 20%; in -stead, now there are more people who failed to ex -plain why they decided not to com-plain.
5.2. The rate of people declaring their readiness to counteract corruptors is about one third of the Ukrainian population: 33% in 2007, 36% in 2009, 34% in 2011 and 37% in 2015. On the other hand, the proportion of respondents confidently stating their unpreparedness to stand for their rights has decreased from 33%-34% in 2007–2011 to 22.8% in 2015. So, certain changes in people’s minds are tak -ing place, though it is happen-ing rather slowly. Still more active are mostly men, young people, those with higher levels of education and wellbeing. This means that this group is still formed mainly by cor -ruption victims. Readiness to stand up for one’s
a response to the growing feeling of corruption in social life, among other things.
5.3. Compared to the preceding years, signifi -cantly larger is the number of people who are ready to take certain action if a state official violates their rights in a big way. Thus, grown from 26.7% to 34.6% is the rate of people who are ready to demand in such cases that the official act according to their duties; increased from 22.9% to 30.7% is the rate of people who are ready to complain about the official to his/her superiors; grown from 17.6% to 22.2% is the rate of people who are ready to take this case to law enforce-ment or court; increased from 6.6% to 10.4% is the rate of people ready to seek protection at NGOs. The rate of people who are going to take no action when their rights are violated has decreased from 32.9% to 19.2%. Also, decreased from 7.1% to 4.1% is rate of people who are ready to ‘find a compromise’ with the official, that is initiate corruption in such cases. This means that compared to the preceding years, people are growing more conscious of the need to protect their rights and withstand officials’ corruption.
5.4. Over the past 12 months, the most heard of have been anticorruption actions and campaigns carried out by mass media (38%). Of the govern -ment actions, the most noticed have been the an -ticorruption activities of the Lustration Committee (32% have heard of certain actions) and the Presi -dent (32%). But like it was before, most people do not tend to see this activity as very effective. Ac -cording to people’s assessment, the most efficient are actions taken by mass media (27% say they are effective) and NGOs (28%). The efficiency of activi -ties of other organizations is evaluated similarly to the preceding years, which is from 5% (the Cabi -net of Ministers of Ukraine) to 12% (the Lustration Committee) of the informed citizens.
5.5. The survey findings indicate that the idea of making anticorruption measures more severe is growing more and more popular with Ukrainians. But people still insist that in the first place MPs should be deprived of immunity as they see legal equality as the necessary condition for effective implementation of any anticorruption measures.
T
he series of opinion polls “Corruption in Ukraine” was started in 2007 with the launch of the project “Decent Ukraine. Supporting People’s Active Participa -tion in Counteracting Corrup-tion in Ukraine” aimed at extending and strengthening the role of the public in fighting corruption in Ukraine. Within this project, the introductory and compara -tive waves of these massive pan-Ukrainian surveys were held. In 2011 the UNITER Project supported the third wave of such research, and in 2015 the same project initiated the fourth survey wave. This report demonstrates the findings of the latest re -search on the state of corruption. Where possible, current results are compared to preceding survey waves held in 2007–2011.The four pan-Ukrainian studies were conducted by the Kiev International Institute of Sociology funded by the United States Agency for International Develop -ment (USAID). The baseline research was held in Feb -ruary and March 2007 (n = 10 580) and the next one took place in February and March 2009 (n = 10 577). These studies were managed by the Management Systems International (MSI). The following two waves of the survey were carried out in March and April 2011 (n = 10 639) and August and September 2015 (n = 10 173) within the UNITER project (The Ukraine National Initiatives to Enhance Reforms) implemented in Ukraine by PACT, Inc. with the USAID support. The last wave was also conducted in coordination with Lake Research Partners and Karakoyun Strategies.
SURVEY METHODOLOGY
The main goal of the four surveys was to collect quantitative data on the following issues:
• attitudes of the adult population of Ukraine to the problem of corruption;
• people’s experiences of corruption;
• public evaluation of sufficiency and effective -ness of anti-corruption measures introduced by authorities and other participants;
• people’s willingness to join anticorruption activity.
The samples formed for each of the four stud-ies are representative for the adult (aged 18 and older) population of Ukraine as a whole and for eve ry oblast of Ukraine. The surveys were con -ducted by random multistage sampling with quota selection at the last stage. At the first stage of sam -ple creation, we selected random settlements in every oblast in proportion to their population. The second stage involved random selection of postal districts (voting precincts in 2015) in the selected settlements. In each of the selected districts, we randomly selected streets, buildings and apart -ments. Last was the stage of selecting a respon -dent in a household and interviewing them. The received data were compared to the information of the national census of 2001 with corrections considering migration figures reported by the State Migration Service (2015).
See Table 1 for the main characteristics of the studies.
The surveys were conducted via individual in-terviews. Overall, respondents were asked about 50 questions concerning their trust in authorities of various levels, the seriousness of issues faced by Ukraine, the spread of corruption in authorities, the key sectors and institutions, the actual experience of corruption encounters, the sources of informa -tion about corrup-tion, the effectiveness of different
ways the state reacts to corruption cases, people’s own readiness to address corruption and their eval -uation of a series of informational messages aiming to involve the public in corruption counteraction.
THE GENERAL CHARACTERISTICS
OF THE 2015 SURVEY SAMPLE
Survey respondent distribution by their main demographic characteristics corresponds to the population structure documented in the official sta -tistics. Among our respondents, 55.0% were female and 45.0% were male. About 32% of the surveyed people were of retirement age (women aged 55 and older and men aged 60 and older). Our respon -dents represented all educational levels. The aver -age household size of the interviewed individuals was three people. See Graphs 1–4 for the detailed respondent distribution by major demographic characteristics.
Working people comprised 44.9% of all the surveyed ones, including 3.0% of the self-employed and 1.7% of working pensioners. The structure of those employed according to their enterprise type is the following: 53.8% are involved in private com -panies, 27.1% are employed by state institutions, 9.0% have jobs with state enterprises, and 4.6% are working for mixed type enterprises. The unoc -cupied category (54.8% of the population overall) was formed by pensioners (30.5%), unemployed
people (9.9%), housewives (9.7%), students (3.5%) and those incapable of working (1.2%).
See Table 2 for respondent distribution by their total household income.
Table 2. Respondent distribution by their total household income Total household income, Hryvnias Total household income, % Below 1000 2.3 1001 – 2000 17.4 2001 – 3000 21.4 3001 – 4000 14.5 4001 – 5000 9.6 5001 – 6000 6.4 6001 – 7000 2.4 Over 7001 2.8
Difficult to say / Refusal 23.3
Graphs 5–6 show the respondent distribution by regions and types of settlements they reside in.
A map below shows the oblasts’ distribution among macroregions of Ukraine.
OPPORTUNITIES AND LIMITATIONS
“Corruption in Ukraine” has several character -istics that make this research unique among other corruption studies. Characteristics of the studies Baseline research (2007) Intermediate research (2009) Intermediate research (2011) Final research (2015)
Field stage February 21 –
March 21 February 19 – March 24 March 18 – April 26 August 15 – September 17
Sample size, individuals 10 580 10 577 10 639 10 173
Theoretical sample error
INTRODUCTION
Graph 1. Respondents’ Gender
55.0%
Females
45.0%
Males
Graph 2. Age Group of Respondents
22.2%
18-2927.4%
60+27.2%
30-4423.2%
45-59Graph 6. Type of Settlement
65.2%
Urban
34.8%
Rural
Graph 3. Education Level of Respondents
25.4%
University Graduate5.1%
Elementary or Some Secondary4.1%
University Undergraduate21.2%
High School29.1%
High Specialized15.1%
High School or Start-Up Professional Graph 5. Regions23.6%
Southern32.8%
Central18.5%
Eastern25.1%
WesternGraph 4. Size of Respondents’ Family
19.9%
4 People12.6%
5 or More People10.9%
1 Person27.3%
2 People27.5%
3 PeopleFirstly, the large sample size lets us study not only people’s perception of the corruption issue but also their actual experience of corruption encounters.
Secondly, our survey sample is created in the way that it allows us to analyze the data not only on the level of Ukraine as a whole but also on the level of every single oblast and Kyiv city.
Thirdly, the use of comparative methodology and instruments helps us follow the changes or
ten-dencies in Ukrainians’ perception or experience of corruption over the period of 2007–2015.
Considering the fact that in this research cor-ruption was defined as a phenomenon characteris -tic of the public sector only and the fact that state institutions of Ukraine cannot function on the tem -porarily occupied territories today, the 2015 survey was conducted only on the territories controlled by the government of Ukraine.
Oblasts’ Distribution among Macroregions of Ukraine
The Western Region: Volynska, Zakarpatska, Ivano-Frankivska, Lvivska, Rivnenska, Ternopilska, Khmelnytska and Chernivetska oblasts.
The Central Region: Kyiv city; Vinnytska, Zhytomyrska, Kyivska, Kirovohradska, Poltavska, Sumska, Cherkaska and Chernihivska oblasts.
The Southern Region: Dnipropetrovska, Zaporizka, Mykolayivska, Odeska and Khersonska oblasts. The Eastern Region: Donetska, Luhanska and Kharkivska oblasts.
1. PERCEPTIONS
OF KEY PROBLEMS
B
efore we analyze the corruption issue indetail, let us consider its place among other problems that Ukraine faces to-day. Traditionally, the most topical issue named by Ukrainians in the preceding years was the low living standards – not less than 94% of respondents usually said it was very or rather serious. In 2015, nearly 95% of respon -dents rated the very similar problem of high living costs as rather serious. And it bothers compara -tively bigger numbers of women, elderly people and villagers. But now the problem of high living costs has predictably ceded leadership to the war issue, which has touched almost everyone (97% of adults consider it serious) with no significant differences between socio-demographic groups (Graph 1.1). Taking into account the noticeable change in the environment compared to 2011, the list of suggested problems was also changed significantly, so we are not giving any compara -tive data here.
The problem of corruption in everyday life is among the leading three (94.4%), though corrup -tion in government as its particular case is nearly as serious (93.8%). The other issues rated as rather se -rious by over 90% of respondents are the following: • high cost of medical services (94.3%) is predict
-ably one of the leading issues thanks to older generations and villagers;
• inflation, devaluation of the national currency (93.4%) is ranked similarly in various popula -tion groups,
• unemployment (93.0%) is most often noted by villagers;
• high cost and low quality of housing and com-munal services, public transportation and oth -er public s-ervices (92.8%) both-er the whole country in the same way.
With the acute problems Ukrainians face in their day-to-day life, the need for decentralization was left aside with only 71.9% of respondents rank -ing it as serious.
Graph 1.1. Severity of Problems
Q: How serious are the following problems in Ukraine today?
Military action in the Donetsk and Lugansk regions
High cost of living Corruption in general High cost of medical services Corruption in government
Inflation, devaluation of national currency
Unemployment High cost and low quality of housing
and communal services, public transportation and other public services
Unfairness in the system of justice Low quality of medical services Crime Excessive bureaucracy Drug abuse / Drug trafficking Loss of control of Crimea Excessive centralization of power,
not enough local control
97.4%
94.9%
94.4%
94.3%
93.8%
93.4%
93.0%
92.8%
88.8%
88.2%
87.7%
83.5%
82.2%
81.0%
71.9%
I
n this section we are going to see how people evaluate the work of authorities of different levels, in particular the level of trust in them and expectations of their responsibility for combating corruption and their political will to overcome it.TRUST IN GOVERNMENT
Trust in authorities forms the basis for any re -forms. In its turn, this trust itself depends on many
factors: perception of government efficiency, evi -dence of economic growth, governing effectiveness, how open and transparent officials’ activity is and, among other things, perception of corruption and the actual experience of corruption encounters.
After the events of 2014–2015, we can see decreasing levels of trust in authorities at all levels compared to 2011 which may be due to citizens’ unmet expectations of drastic changes in the coun -try (Graph 2.1).
Graph 2.1. Trust in Government
2. ATTITUDES TOWARD
THE GOVERNMENT
City / Village government President and his Administration Oblast government Cabinet of Ministers of Ukraine
Verkhovna Rada of Ukraine Judicial system Security Service of Ukraine Lustration Committee National Anti-Corruption Bureau The Committee on the Prevention of Corruption
Public prosecutor’s office
20.1% 14.0% 10.0% 9.2% 7.7% 7.0% 17.6% 10.3% 6.4% 5.9% 5.0% 3.1% 7.7% 7.0% 6.9% 6.1% 3.5%
Q: To what extent do you trust the following government bodies and branches?
2011
The Ukrainian public does not tend to trust gov-ernment institutions. Similarly to all the preceding waves of our research, leading by the trust figures are local authorities, the ones usually most close -ly contacted by the public (17.6% of respondents rather trust local authorities compared to 20.1% in 2011). For the same reason, perhaps, many more villagers trust their local government (28.3% com -pared to 11.8% of urban residents) and more elder -ly women have trust in their local authorities.
Second is the President with his administration, but this power is trusted by little more than 10% of respondents (President Yanukovych was trusted by 14.0% in 2011). The President is supported by
people over 60 (12.5% have trust in him), who tend to trust all traditional bodies of power.
Also at the top is the Security Service of Ukraine (7.7% of trust), which has lead a more public activity over the past year. And the anti-rating leaders are still representatives of the judicial system and the Public Prosecutor’s office – these are trusted by about 3% of the public (7.0% in 2011). Top officials of Verkhovna Rada have not gone too far from them (5.0% compared to 7.7% in 2011) – and neither have those from the Cabinet of Ministers (5.9% compared to 9.2% in 2011).
Unfortunately, the newly made bodies like the Lustration Committee and the National Anti-Corrup -tion Bureau have not become leaders in this public Graph 2.2. Trust in Government (by region)
East City / Villag e Go vernmen t Cabine t of Minis ter s of Ukr aine Pr esiden t and His Adminis tr ation East East South South South Central Central Central West West West 15.9% 19.0% 18.0% 28.8% 14.0% 10.4% 7.4% 5.3% 21.6% 16.5% 10.5% 7.9% 10.4% 13.8% 18.8% 24.7% 3.3% 6.0% 6.6% 6.7% 5.4% 11.2% 11.7% 11.3%
2011
2015
ATTITUDES TOWARD THE GOVERNMENT
Graph 2.3. Most Responsible for Fighting Corruption trust rating (they are trusted by 7.0%). However, it is comforting that – unlike traditional bodies of power – all these new structures enjoy more trust from young -er gen-erations (those und-er 30). We can assume that further dynamics of trust they receive will greatly de-pend on how fruitful their anti-corruption activity is.
Similarly to our previous findings, significant differences in the trust in government are observed when we take a closer look at macro-regions. Local authorities invariably enjoy the most trust in western oblasts. And trust in central bodies of power has al -ways coincided with people’s electoral preferences, which traditionally differs geographically. So, today public trust in the President and the Cabinet of Minis -ters is the lowest in the eastern region – in contrast to 2011, when V. Yanukovych was President (Graph 2.2).
RESPONSIBILITY FOR THE FIGHT
AGAINST CORRUPTION
Graph 2.3 shows that, despite the generally low level of trust in governmental institutions, the
Ukrainian public still sees the highest bodies of power as the ones most responsible for addressing corruption. Like in all the monitoring years, most re -spondents of 2015 place the main responsibility for combating corruption on the President of Ukraine (60.6%), Verkhovna Rada (41.7%) and the Cabinet of Ministers (37.7%). Among the law enforcement bodies and specialized agencies, people name militsiya and special law enforcement structures (29.7%) placing much less responsibility on the Na -tional Anti-Corruption Bureau (16.0%), the Commit -tee for Prevention of Corruption (13.0%), the Public Prosecutor’s office (10.8%), the Security Service of Ukraine (9.7%), courts (8.3%) etc.
It is remarkable that the rate of the public placing the responsibility for combating corruption on simple people is steadily growing (from 15.8% in 2007 to 18.0% in 2011 and 24.0% in 2015) but this combat seems rather spontaneous as non-gov-ernmental and public organizations and volunteer movements popular nowadays are at the bottom of the list (1.4% and 0.5% respectively). Higher levels
President of Ukraine 60.6%
Verkhovna Rada of Ukraine 41.7%
Prime Minister and Cabinet of Ministers 37.7%
Militsiya and specialized law enforcement
agencies to fight corruption 29.7%
Ordinary citizens 24.0%
National Anti-Corruption Bureau 16.0%
The Committee
on the Prevention of Corruption 13.0% Public prosecutor’s office 10.8%
Security Service of Ukraine 9.7%
Courts 8.3%
Lustration Committee 4.5%
Local authorities 4.2%
Non-government and civic organizations 1.4%
Volunteer movements 0.5%
Graph 2.4. Citizens’ Responsibility to Fight against Corruption: Gender-Age Differences
Q: In your opinion, who is responsible for overcoming corruption in Ukraine?
18-29 30-44 Age groups 45-59 60+
22.7%
29.9%
22.0%
25.5%
25.7%
32.3%
22.0%
19.9%
Males
Females
of public awareness is seen in younger generations (under 45) and women show a more conscious po -sition even in the oldest age group, while aging men tend to place responsibility on someone else but not citizens themselves (Graph 2.4).
THE GOVERNMENT’S WILLINGNESS
TO FIGHT CORRUPTION
Considering the main branches of power in Ukraine, it is worth noting in the first place that not more than 14% of the population notice government representatives’ political will to overcome corrup -tion – and this propor-tion is somewhat smaller for each suggested level and branch of power than back in 2011. The strongest willingness to combat corrup -tion is demonstrated by local authorities (13.2%) and the President (12.3%). Such willingness of represen -tatives of Verkhovna Rada, the Cabinet of Ministers, and oblast government bodies is seen by 6–8% of people. Similarly to our earlier findings, the judicial system is trailing behind – its anti-corruption activity is visible only to 3.8% of respondents (Graph 2.5).
Besides the main government institutions, re -spondents were offered to estimate if representa -tives of budget institutions that are the most cor -rupt in their traditional perception are willing to combat corruption. As we can see, of the entire suggested list, the most willing to overcome corrup -tion are military privates – 59.4% of respondents observe such a will in them. Interestingly, only 10.2% of respondents see the willingness to change the situation in military authorities. It should be noted that the issue of corruption in the Ukrainian army is rather topical now due to the military op-eration in Donbas. Among the other sectors sug -gested for evaluation, people note the new police with 37.9% of adults believing in their willingness to combat corruption. And, as we see, little trusted is the willingness of representatives of the other sectors we named to overcome corruption in their fields – with education receiving 11.3%, health care getting 9.7%, the Public Prosecutor’s office trusted by 4.3% and the traditional militsiya left with 3.9% (Graph 2.6)
ATTITUDES TOWARD THE GOVERNMENT
Graph 2.5. Willingness to Overcome Corruption
Q: Do you think [NAME THE BODY OR BRANCH OF GOVERNMENT] is willing to overcome corruption in Ukraine?
City / Village government President and his Administration Cabinet of Ministers of Ukraine Oblast government Verkhovna Rada of Ukraine
Judicial system 13.5% 16.8% 11.0% 8.0% 7.9% 6.9% 13.2% 12.3% 7.8% 6.4% 6.0% 3.8%
Graph 2.6. Willingness to Overcome Corruption
Q: Do you think [NAME THE BODY OR BRANCH OF GOVERNMENT] is willing to overcome corruption in Ukraine?
Military representatives (ordinary soldiers) New Police representatives Educational system representatives
(teachers) Military representatives
(management) Health care system representatives
(doctors, nurses) Public prosecutor’s office Militsiya representatives 59.4% 37.9% 11.3% 10.2% 9.7% 4.3% 3.9%
2011
2015
T
he overwhelming majority of people have their own view on the situation in various sectors whether they per-sonally have contact with those sec-tors or not because their perception is formed not only by their own experience but also based on the information spread by the media or people’s family or friends. Thus, even with no factual proof, such information largely forms people’s perception of how serious the corruption issue is and how effectively the gov -ernment addresses it.SOURCES OF INFORMATION
ON CASES OF CORRUPTION
Over the years of our research, there have been stable trends in the structure of corruption-related information sources Ukrainians use. Similarly to our earlier findings, the leading supplier of information about corruption is mass media with traditional broadcast media leading in the sector – up to 30% of respondents receive information about corruption from television and radio. Another major source of such information is still informal communication –
3. PERCEPTIONS
OF CORRUPTION
Graph 3.1. Major Sources of Information about Corruption
Q: From what sources do you mostly receive information about cases of corruption?
Internet TV and radio Personal experience and experience of family members, friends, and acquaintances
Printed media Reports and statements
of state bodies officials Non-government organizations (public or professional) 4.4% 30.4% 25.4% 21.6% 7.7% 2.2% 12.4% 28.0% 23.8% 16.0% 7.9% 3.5%
2011
2015
PERCEPTIONS OF CORRUPTION
about one quarter of respondents (23.8%) learn about cases of bribery from their family or friends. Print media continue losing their impact – their au -dience comprising a quarter (25.2%) of the popula -tion in 2007 decreased to one fifth (21.6%) in 2011 and then to one sixth (16.0%) in 2015 (Graph 3.1).
The only source of information about corrup -tors’ activity that has significantly gained audi -ence over the period of our research is the Inter-net. Though the proportion of Ukrainians learning about corruption encounters from the worldwide web had been growing before, it has nearly tripled since 2011 increasing from 4.4% to 12.4% (of which 7.2% are readers of news sites and blogs and the remaining 5.2% are users of social networks like Vkontakte, Facebook, Twitter etc.). Predictably, dif -ferent media have dif-ferent user structures. Thus,
print media are mostly supported by older readers, while younger people tend to rely on the Internet.
Government representatives are failing to win more attention with speeches devoted directly to the problem of corruption. Their audience does not exceed 8% of adults.
LEADING CAUSES OF CORRUPTION
People’s views on the leading causes of corrup-tion have proved to be stable over the years. It is difficult to single out one deciding factor leading to corruption in Ukraine. Instead, it rather results from a cumulative influence of a series of factors – and the leading ones are shown in Graph 3.2.
Most often, rated as leading in corruption devel -opment was officials’ desire to use public office for personal gain (19.7%). There they are helped by the
Graph 3.2. Leading Causes of Corruption
Q: What are the three main causes of corruption in Ukraine? Name them starting with the most
important one
Desire of politics and public officials
to use public office for personal gain 18.1%19.7% Lack of the political will of the highest levels of
government (President, Prime Minister) to fight corruption 12.0%12.9% Citizen habits to solve their problems
using corruption including bribery 9.2%11.8% Poor internal controls in government, lack of transparency 7.1%11.7% Complicated legislation 10.4%9.8% Too much government bureaucracy 6.8%8.7% Low level of public awareness about procedures
and rules in governmental institutions 7.5%8.0% Absence of clear procedures in governmental institutions 4.5%6.8%
Lack of understanding what citizens should do
when somebody demand a bribe from them 6.7%
2011
dress corruption (12.9%) and people themselves being used to solving their problems in such a way (11.8%).
Insufficient inner control in the bodies of pow -er was noted by 11.7% of respondents and about 10% believe that corruption is caused by too com -plicated and imperfect legislation of Ukraine. The rest of the listed causes were named by less than 9% of respondents.
CAN CORRUPTION BE JUSTIFIED?
One half (49.8%) of adult Ukrainians admit that they may get involved in corrupt actions for their own gain, that is when it helps them solve their own problem. The proportion of those declaring that corruption practice is totally unacceptable for them equals 37.4% of respondents (Graph 3.3).
Let us take a closer look at the portraits of these two population groups. The tendency to reject cor -ruption even in one’s own interest strengthens with age. Women are relatively more tolerant to corrup
-females is seen in the oldest age group (aged 60 and older). In this group, corruption is seen as un -acceptable by 42.4% of men and 38.1% of women. Graph 3.4 shows that, similarly to the preceding years, young people tend to make use of corruption contacts for their gain more often.
Corruption is more often justified by those who encounter it most frequently: 55.8% of this year’s bribers admit the use of corruption, while among those who have not had such experience over the past year there are 45.3% of such people. Urban residents are more tolerant to corruption relations (51.3% compared to 46.9% of villagers), perhaps, due to wider possibilities of their use.
We also offered our respondents a series of questions helping describe their value orientations (Table 3.1). The most supported by the whole popu -lation was the statement about the need to fire cor -rupt officials from public offices – 94.3% of respon -dents agree with it.
Graph 3.3. Can Corruption be Justified If It is Necessary for Solving the Problem Which is Important for You?
Q: Do you believe that giving bribery, unofficial services, or gifts can be justified if it is necessary for solving the problem which is important for you?
27.5%
In most cases are not justified
12.8%
No answer19.1%
In most cases are justified3.2%
Always justified37.4%
Never justifiedPERCEPTIONS OF CORRUPTION
Graph 3.4. Believe that Corruption is Never Justified
It is worth noting that within different so-cio-demographic groups men are significantly more ready for active resistance to corruption. Thus, more men are ready to report corrup -tion encounters that they learn about (48.0% compared to 43.5% of women), and more men are prepared to join collective protests against local corruptors (47.8% compared to 42.1% of women). Similar differences are also seen with -in age groups: the oldest people are consider -ably less ready to act as mentioned above. Be -sides, they are less prone to believe that most people in Ukraine will use corruption contacts when they get a chance.
Let us also consider the abovementioned fac -tors in terms of tolerating corruption (Graph 3.5).
There are several questions that separate people who tolerate corruption practices from those who do not. Thus, among of people who tend to justify corruption, there are more people believing that most Ukrainians will use corrup-tion contacts if they get a chance. Secondly, they more often believe that one cannot get proper services without extra payment in Ukraine.
Thirdly, they tend to explain their tolerance to corruption by striving for “equality” among pub -lic officers and simple people: if the former may break the law, it should not be demanded that the latter observe it either.
In contrast, the ones who are strongly against corruption even for their own gain agree more of -ten than others that responsibility for corrupt ac-tions should be equal for both parties of the deal. They also declare better willingness to uncover cor -ruption actions.
Having compared the response to the last of the questions we mentioned with the actual prac -tice of reporting corruption encounters, we can see that overall only 1.8% of the whole population filed a complaint about corruption, while there are 1.5 times more appellants (2.7%) among those declar -ing their readiness to complain.
CHANGES IN THE LEVEL
OF CORRUPTION
The study of 2015 helps evaluate the general perception of how corrupt the society is because some factors and spheres of life may not be equally
18-29 30-44 Age groups 45-59 60+
Males
Females
All population
33.8% 38.1% 38.8% 42.4% 33.4% 36.6% 38.0% 38.1% 33.6% 37.3% 38.4% 39.6%important for different people and thus will have different influence on their perception of the situ -ation as a whole. The survey shows that 85.5% of adult Ukrainians estimate the spread of corruption in the society as above average. Only 1.8% of re -spondents believe that corruption is little spread or that there is none at all (Graph 3.6).
In every research wave, we asked our respon -dents to evaluate their subjective perception of how corruption spread in Ukraine had changed over the two years preceding the survey. Of course, analyz -ing their response we cannot claim that it indicates the efficiency of the government’s anti-corruption programs – especially considering the circumstanc
-Suggested statements Gender Age groups
male female 18–29 30–44 45–59 60+
If state employees’ wages are
signifi-cantly increased, they will not take bribes 36.3 38.5 40.1 37.8 36.1 36.2
Bribery is an integral part
of the Ukrainian mentality 67.9 65.6 65.4 67.0 69.3 65.1
All people must follow even
those laws that they consider unjust 69.0 69.5 69.2 68.8 68.2 70.6
If you can resolve the issue with the officials, most people in Ukraine try to take advantage of this
73.5 72.1 73.7 74.7 73.9 68.9
I am ready to report cases
of corruption that became known to me 48.0 43.5 49.2 49.9 44.8 38.8
Ordinary citizens also have a right not
to follow the law, as public officials do 32.3 31.7 31.3 33.0 32.9 30.6
Salaries of public sector employees are so low that they are forced to take informal payments for their services
43.3 43.4 44.6 44.1 44.4 41.0
Anyone who offers a bribe, must bear the same responsibility as the one who takes
68.0 68.0 67.8 69.2 66.5 68.3
I am ready to join collective protests against local people who involved in corruption
47.8 42.1 49.6 50.1 45.7 34.4
I will get nothing I want, like access to medical care or higher education, if I don’t pay a bribe for it
59.9 60.4 58.1 61.6 62.8 58.3
Corrupt officials should be voted out