Dehaeze, F., Barakos, G.N., Kusyumov, A.N., Kusyumov, S.A. and Mikhailov, S.A. (2018) Exploring the detached-eddy simulation for main rotor flows. Russian Aeronautics (Iz VUZ), 61(1), pp. 40-47.
(doi:10.3103/S1068799818010063).
This is the author’s final accepted version.
There may be differences between this version and the published version. You are advised to consult the publisher’s version if you wish to cite from it.
http://eprints.gla.ac.uk/165111/
Deposited on: 09 July 2018
Enlighten – Research publications by members of the University of Glasgow http://eprints.gla.ac.uk
1 F. Dehaeze, G. Barakos,
A.N. Kusyumov, S.A. Kusyumov, S.A. Mikhailov
Exploring DES for Rotor Flows
Key words: main rotor, numerical modeling, DES model, BVI conditions
Abstract
CFD predictions of rotor loads and vibration could be improved by resolving a larger part of the turbulent flow spectrum around the rotor. CFD methods, currently in use for rotors blades, employ the URANS approach that is inherently limited in terms of the sizes and frequencies of the resolved local flow structures. This paper attempts to apply hybrid (DES) method of turbulence modelling and simulation aiming to resolve a larger part of the spectrum around rotor blades in hover and forward flight. A comparison between DES and URANS was carried out for the case of a forward flying rotor suggesting that DES has potential for rotor applications. The limitations of the available experiments for CFD validation are also highlighted.
I. Introduction
Rotor CFD calculations are challenging. This stems from the associated flow unsteadiness, and the coupled aerodynamics, and elasticity of rotor blades, as well as the necessary rotor trimming. Within the rotor flow domain, wakes dominate as flow effects and their presence is characterized by a range of flow scales, both laminar and turbulent. Table 1 summarizes the turbulence models currently in use in rotorcraft CFD for solution of the Unsteady Reynolds Averaged Navier-Stokes (URANS) equations, and as shown these are dominated by the 2-equation k-ω [1] model and its derivatives. However, these models show deficiencies in several aspects of rotorcraft flows. In particular, the cutoff frequency of for local flow structures resolved in URANS solutions is at about 500 Hz, which could be too low
2 to predict all the phenomena occurring in rotorcraft flow, with blade rotational speed approaching 300 RPM. Other limitations come from the Boussinesq approximation. Boussinesq-based models tend to under predicted stall and over predicted eddy viscosity at the core of vortices [2]. These problems can be partly solved by adding non-linear terms in the stress tensor expansion, [3] however, the potential reduction of numerical stability of the CFD codes make them impractical in the case of rotorcraft flows.
Most of the above problems could be overcome using LES (Large Eddy Simulation) model, however, due to the high Reynolds number and therefore the range of scales to resolve, these models are currently unaffordable. An alternative could be hybrid RANS/LES models in the form of (DES) (Detached Eddy Simulation) or LNS (Limited Numerical Scales) [4]. These models resolve the largest structures in the flow while modelling the smaller ones. The filter is implicit and depends on the mesh coarseness, switching to the RANS equations to model the smaller turbulent scales.
Russian efforts to model rotor performance using CFD are mainly based on solutions of the RANS equations with different turbulence models (see, for example, papers [29–33]).
For the above reasons, the present study attempts to assess DES closures for rotor flows, as well as the coupling approach to model the blade structural deformation. After presenting the models DES turbulence model is then applied to the ONERA 7A rotor in forward flight, followed by the HART-II rotor in BVI conditions.
II. CFD Method
A. CFD Solver
The Helicopter Multi-Block (HMB) code, developed at Liverpool and Glasgow universities, is used as the CFD solver for the present work. It solves the Unsteady Reynolds Averaged Navier-Stokes (URANS) equations in integral form using the arbitrary Lagrangian Eulerian (ALE) formulation for time-dependent domains with moving boundaries:
3
∫ ( )w⃗𝑑𝑉 + ∫ ( ) 𝐹⃗ (w⃗) − 𝐹⃗ (w⃗) 𝑛⃗𝑑𝑆 = 𝑆⃗ (1)
where V(t)is the time dependent control volume, V(t)its boundary, w⃗ is the vector
of conserved variables [ρ, ρu, ρν, ρw, ρE]T. 𝐹⃗ and 𝐹⃗ are the inviscid and viscous
fluxes, including the effects of the time dependent domain. For forward flying rotor simulations, a moving grid approach is used and the source term is set to 𝑆⃗ =
0, 0⃗, 0 .
The Navier-Stokes equations are discretised using a cell-centred finite volume approach on a multi-block grid, leading to the following equations:
𝐰, , 𝑉, , = −𝐑 , , 𝐰, , , (2)
where w represents the vector of cell variables and R the flux residuals; i, j and k are the cell indices and 𝑉, , is the cell volume. Osher's [6] upwind scheme is used to discretise the convective terms and MUSCL variable interpolation is used to provide third order accuracy. The Van Albada limiter [7] is used to reduce the oscillations near steep gradients.
Temporal integration is performed using an implicit dual-time step method. The linearised system is solved using the generalised conjugate gradient method with a block incomplete lower-upper (BILU) preconditioned [8].
Multi-block structured meshes are used for HMB. These meshes are generated using ICEM-Hexa™ of Ansys. The multi-block topology allows for an easy sharing of the calculation load for parallel computing. For rotor flows, a typical multi-block topology used with HMB is described in [9]. A C-mesh is used around the blade and this is included in a larger H structure which fills up the rest of the computational domain.
The implementation of various turbulence models in HMB was presented in [10]. For this work, only the DES model, based on the Spalart-Allmaras (SA) [11] model, was applied.
4
A. DES applied to rotor flows 7A rotor in Forward Flight
7A rotor in forward flight was attempted with DES. Due to its popularity in CFD works and the availability of experimental data from several wind tunnel campaigns, the ONERA 7A rotor, described in Figure 1, was considered.
The collective and coning settings used in the CFD computations are shown in Table 2. Table 2 presents the following parameters: µ – the aspect ratio, M∞ – the
free stream Mach number, Ст – toque moment coefficient, as – the shaft angle
(positive for backward angle), θ0 – the collective angle, θ1c, θ1s – the cyclic
components (sinus and cosine), ß0 – the coning angle, ß1c, ß1s – the longitudinal and
lateral flapping angles.
Given that structured multi-block grids are used here, there was less flexibility to optimize the mesh for DES. Nevertheless, care has been taken to refine the mesh near the blades while maintaining some of the mesh orthogonality at the rotor disk plane where the blade vortex wake is expected to be concentrated. The mesh for the complete rotor was put together by copying the single-blade mesh and rotating it around the azimuth.
The computation was undertaken in parallel mode using 16.8 million nodes with good load balancing. Due to CPU time limitations only three rotor revolutions were attempted using an azimuthal step of 0.25 degrees. This time step appears to be close to what is used for URANS computations though further refinement would lead to overwhelmingly expensive computations.
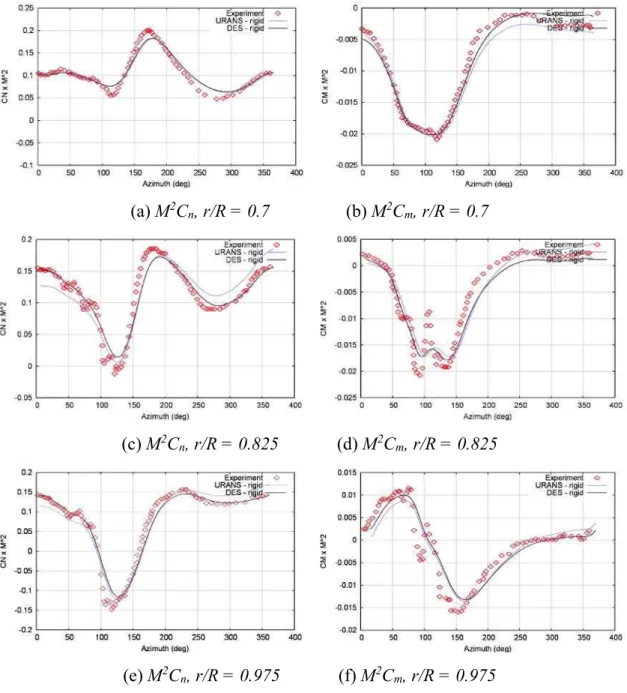
The results for Mach-scaled normal force and pitch moment coefficients obtained from the URANS (SA turbulence model) and the DES solutions are compared against experimental data in Figure 2. Three stations are shown corresponding to r/R
= 0.7, r/R = 0.825 and r/R = 0.9, where r is a local section radius and R is the rotor radius (some discrepancy of the CFD results for the azimuth angles 0 and 360 degrees during a one rotor revolution can be explained by unsteady formulation of CFD task). Inboards, the flow appears to be well-resolved by both the DES and the URANS solutions and the overall agreement for the Mach-scaled normal force
5 coefficient is good on the advancing side of the blade and the rear of the disk (near an azimuth angle 0 degrees). Some difference exists on the retreating side (270 degrees) and the DES solution fares somehow better in that region. This is especially true for the pitching moment coefficient. At the r/R = 0.825 station, the situation shows some of the DES benefits though these are mainly concentrated on the retreating side. For the considered test case, the experimental data show the presence of some blade-vortex-interaction near 100 degrees of azimuth. None of the employed models captured the BVI and this is apparently due to the lack of spanwise mesh resolution as well as the selected azimuthal step of 0.25 degrees. Furthermore, the exact trim state of the model rotor used in the experiments is not exactly known and the location of the blade may affect the predicted BVI. Interestingly, the depth of the normal force coefficient on the advancing side of the rotor is well-captured in terms of magnitude and phase by both models. For the third available station (r/R = 0.975) the URANS and DES results are fairly close for the pitching moment and normal force coefficients. Again, it is interesting to see that regardless of some minor differences near the advancing side, both models follow the trend of the experiments quite accurately. The only exception for the BVI is encountered at azimuth angles of about 100 degrees that does not appear to be resolved.
B. HART-II Rotor in Low-Speed Forward Flight
Comprehensive experimental measurements for the HART-II rotor were obtained by Van der Wall et al[13].The rotor was tested for a slow descending flight, on a 6 degrees slope with an advance ratio µ = 0.1508. The freestream Mach number was set at М∞ = 0.096. The shaft angle was corrected for the wind-tunnel effects and set
to αs = 4.5 degrees. These conditions were chosen to assess the prediction of BVI
events. The trim state was based on the work of Lim et al [14] and was θ 0 = 3.36
degrees, θ1c = -1.57 degrees and θ1s= 0.97 degrees. It was also found that an increase
of θ1s to 1.47 degrees (called trimmed solution thereafter) further improved the
results.
6 comparing the rigid and elastic blades. The blade deformation was extracted from the HART-II experiment database [15] and projected on the blade eigenmodes obtained through NASTRAN. The six first harmonics were extracted and used to prescribe the deformation of the rotor blades.
The obtained blade deformation at the tip is compared to experimental measurements in Figure 3. Figure 3 presents vertical oscillations (100z/R) and torsion angle for the blade tip part. The tip deformation matched well the experimental measurements apart from the down peak in torsion at the front of the rotor disk that is slightly under-predicted.
The main difference between the rigid and elastic blade results is visible in Figure 4 which represents the evolution of the Mach-scaled normal coefficient around a revolution at r/R = 0.87. While the elastic blade was able to capture some BVI, the rigid one did not. On the other hand, numerical dissipation in the grid resulted in low amplitudes of the predicted BVI. Therefore, a new finer grid was generated and was also used to compare the SA and DES turbulence models.
The new grid size was set at 34.8 million nodes. It was noticed during the simulation that an increase in amplitude of the sinus component of the cyclic allowed for a better rotor trimming and loading. This second simulation was termed
trimmed. The trim states used for the HART are summarised in Table 3. Due to the
higher DES requirements, the simulations were run with an azimuthal step ∆Ψ = 0.1 degrees.
Iso-surfaces of the λ2-criterion from the trimmed DES simulation are shown in
Figure 5, showing the location of the vortices. Due to the low thrust coupled with the backward shaft angle, the vortices generated by the blades at the front of the rotor disk pass over the rotor before moving downwards and crossing the rotor disk at the rear. Due to the low advance-ratio, the vortices are progressing very slowly along the rotor. The hub wake as well as the blade root vortices are also clearly visible and interact with the blade in the rear of the disk.
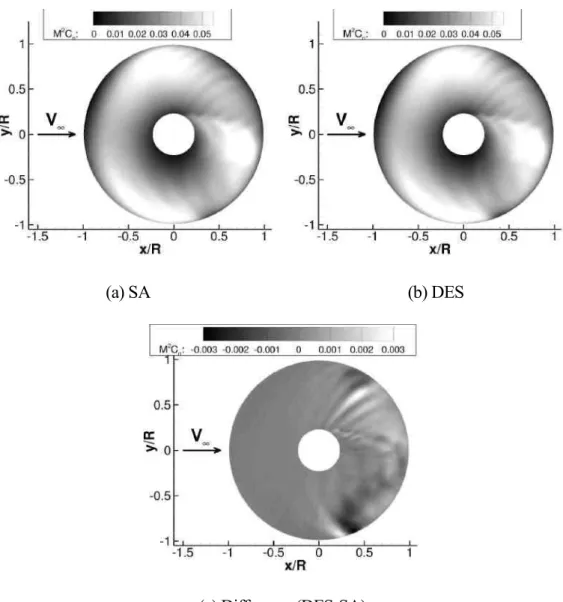
Figure 6 presents the computed Mach-scaled normal force coefficient along the span during the rotation of the HART-II rotor using both the DES and SA turbulence
7 models. Both simulations predicted BVIs around Ψ = 80 degrees and Ψ = 270 degrees, as the strong oscillations in the normal force coefficient indicate. The interaction of the blade with the wake of the hub is also clearly visible at the back of the disk. The predictions from the SA and DES turbulence models were very similar, and the main differences are located in the BVI areas where differences reached 5% of the peak-to-peak variation of the Mach-scaled normal force coefficient.
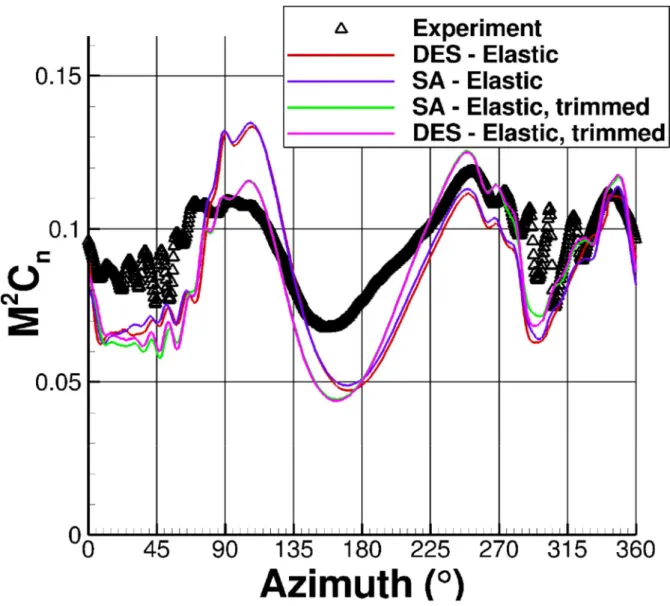
The loading at section r/R = 0.87 was then extracted and compared with experimental measurements in Figure 7. The BVIs are clearly visible around Ψ = 80 degrees and Ψ = 280 degrees, with large variations in amplitude. While the predictions followed the experimental trend, the down-peak at Ψ = 150 degrees tended to be over-predicted. The loads in the first quarter of a revolution were also under-predicted. The trimmed solution improved the predictions on the advancing side, with an upward peak around Ψ = 90 degrees following the experimental values instead of being higher. On the other hand, this improvement proved limited when focusing on the vibratory part of the loads. The BVIs from the CFD simulations tend to happen more forward in the rotor disk. This might be linked to the higher thrust from the rotor (CT = 0.0140 in the simulations, and CT= 0.00886 in the experiments)
which brought the vortices through the rotor disk earlier.
The amplitude of the loads variations was also smaller in the CFD simulations. This might come from the numerical dissipation of the vortex, despite the use of a fine mesh and the lack of vertex core resolution.
IV. Summary and Conclusions
DES was applied on the ONERA 7A rotor and compared with both the experiment and URANS models. Both turbulence models predicted quite well the lift and moment coefficients evolution along the rotor rotation. However, DES tended to slightly improve the predictions in the back of the disk and, more importantly, the results contained a broader frequency content. These results are encouraging for further studies, particularly when structural deformations are taken into account, causing higher frequency modes to be excited.
8 When applied to the HART-II test case, DES only showed limited improvements on the BVI predictions. The main effects were identified to be the mesh size in terms of wake and vortex core resolution, and the aeroelastic and trimming effects that are strong for this case. Even this case, however, lacks the highly resolved data that DES should be compared against. A further study of mesh and time step refinements effects would be required to fully assess the potential of DES for rotor flows. BVI still represents a very difficult flow problem and better understanding of this phenomenon should be combined with new experiments of high spatial and temporal resolutions.
References
1. Wilcox D. Multiscale Model for Turbulent Flows. // AIAA Journal, Vol. 26, No. 11, November 1988, pp. 1311–1320.
2. Barakos G. Study of Unsteady Aerodynamics Phenomena Using Advanced Turbulence Closure. Ph.D. thesis. University of Manchester Institute of Science and Technology, April 1999.
3. Barakos G. and Drikakis D. Investigation of Nonlinear Eddy-Viscosity Turbulence Models in Shock/Boundary-Layer Interaction. // AIAA Journal, Vol. 38, No. 3, March 2000, pp. 461–469.
4. Spalart P.R., Jou W.H., Strelets M., Allmaras S.R.: Comments on the feasibility of LES for wings, and on a hybrid RANS/LES approach, 1st AFOSR Int. Conf. on DNS/LES, Aug. 4-8, 1997, Ruston, LA. In: Advances in DNS/LES, C. Liu and Z. Liu Eds., Greyden Press, Columbus, OH, USA (1997).
5. Sitaraman J. and Roget B. Prediction of Helicopter Maneuver Loads Using a Fluid-Structure Analysis. // Journal of Aircraft, Vol. 46, No. 6, November–December 2009, pp. 1957–1964.
6. Osher S. and Chakravarthy S. Upwind Schemes and Boundary Conditions with Applications to Euler Equations in General Geometries. // Journal of Computational Physics, Vol. 50, January–February 1983, pp. 447–481.
9 7. van Albada G., van Leer B. and Roberts, W. A Comparative Study of Computational Methods in Cosmic Gas Dynamics. // Astronomy and Astrophysics, Vol. 108, No. 1, April 1982, pp. 76–84.
8. Axelsson O. Iterative Solution Methods. Cambridge University Press: Cambridge, MA, 1994.
9. Steijl R., Barakos G. and Badcock, K. A framework for CFD analysis of helicopter rotors in hover and forward flight. // International Journal for Numerical Methods in Fluids, Vol. 51, No. 8, 2006, pp. 819–847.
10.Dehaeze F., Barakos G., Batrakov A., Kusyumov A. and Mikhailov S. Simulation of flow around aerofoil with DES model of turbulence. // Trudy MAI, Vol. 59, 2012, pp. 533–536.
11.Spalart P. and Allmaras S. A One-Equation Turbulence Model for Aerodynamic Flows. // La Recherche Aerospatiale, No. 1, 1994, pp. 5–21. 12.Menter F. Two-Equation Eddy-Viscosity Turbulence Models for Engineering
Applications. // AIAA Journal, Vol. 32, No. 8, 1994, pp. 1598–1605.
13.van der Wall B., Burley C., Yu Y., Richard H., Pengel K., and Beaumier, P. The HART II test measurement of helicopter rotor wakes. // Aerospace Science and Technology, Vol. 8, No. 4, June 2004, pp. 273–284.
14.Lim J. and Strawn R. Computational Modeling of HART II Blade-Vortex Interaction Loading and Wake System. // Journal of Aircraft, Vol. 45, May–June 2008, pp. 923–933.
15.van der Wall B. Mode Identification and Data Synthesis of HART II Blade Deflection Data. // Tech. Rep. IB-111-2007/28, German Aerospace Center (DLR), 2007.
16.Pahlke K. and van der Wall B. Chimera Simulations of Multibladed Rotors in High-Speed Forward Flight with Weak Fluid-Structure-Coupling. // Aerospace Science and Technology, Vol. 9, No. 5, July 2005, pp. 379–389. 17.Rung T., Luebcke H., Franke M., Xue L., Thiele F. and Fu S. Assessment of
Explicit Algebraic Stress Models in Transonic Flows. // 4th International Symposium on Engineering Turbulence Modelling and Measurements,
10 Corsica, France, May 24–26 1999, pp. 659–668.
18.Dol H., Kok J. and Oskam B. Assessment of Explicit Algebraic Stress Models in Transonic Flows. // 40th AIAA Aerospace Sciences Meeting and Exhibit, Reno, Nevada, AIAA-2002-843, January 14–17 1999, pp. 659–668.
19.Renaud T., O’Brien D., Smith M. and Potsdam M. Evaluation of Isolated Fuselage and Rotor-Fuselage Interaction Using Computational Fluid Dynamics. // Journal of the American Helicopter Society, Vol. 53, No. 3, January 2008, pp. 3–17.
20.Dietz M. and Dieterich O. Toward Increased Industrial Application of Rotor Aeroelastic CFD. // 35th European Rotorcraft Forum, Hamburg, Germany, Paper No. 1185, September 22–25 2009.
21.Borie S., Mosca J., Sudre L., Benoit C. and Peron S. Influence of Rotor Wakes on Helicopter Aerodynamic Behaviour. // 35th European Rotorcraft Forum, Hamburg, Germany, Paper No. 1205, September 22–25 2009.
22.Potsdam M., Smith M. and Renaud T. Unsteady Computations of Rotor-Fuselage Interaction. // 35th European Rotorcraft Forum, Hamburg, Germany, Paper No. 1230, September 22–25 2009.
23.Khier W. Numerical Simulation of Air Flow Past a Full Helicopter Configuration. // 35th European Rotorcraft Forum, Hamburg, Germany, Paper No. 1207, September 22–25 2009.
24.Smith M., Koukol B., Quackenbush T. and Wachpress D. Reverse- and Cross-Flow Aerodynamics for High-Advance-Ratio Flight. // 35th European Rotorcraft Forum, Hamburg, Germany, Paper No. 1272, September 22–25 2009.
25.Fang Y. and Menon S. Kinetic Eddy Simulation of Static and Dynamic Stall. // 25th AIAA Applied Aerodynamics Conference, San Francisco, CA, September 22–25 2009.
26.Sanchez-Rocha M. Wall-Models for Large Eddy Simulation Based on a Generic Additive-Filter Formulation, Ph.D. thesis, Georgia Institute of Technology, May 2009.
11 27.Min B.-Y., Sankar L., Rajmohan N. and Prasad J. Computational Investigation of Gurney Flap Effects on Rotors in Forward Flight. // Journal of Aircraft, Vol. 46, No. 6, November–December 2009, pp. 1957–1964. 28.Steijl R. and Barakos G. Computational Study of Helicopter Rotor-Fuselage
Aerodynamics Interactions. // AIAA Journal, Vol. 47, No. 9, September 2009, pp. 2143–2157.
29. Kosheev A.V. Main rotor aerodynamics performances determination for hover and forward flights mode. // TsAGI transactions. 2007, vol. 2673, Pp. 92 - 104.
30. Ignatkin Yu. M., Konstantinov S.G.Main rotor aerodynamics performances investigation using CFD method. // Electronic journal «MAI transactions». Vol. № 57, 2012. – Pp. 1 – 22.
31. Garipova L.I., Batrakov A.S., Kusyumov A. N., Mikhailov S. A., Barakos G. N. Estimates of hover aerodynamics performance of rotor model. // Russian Aeronautics (Iz VUZ) July 2014, Volume 57, Issue 3. – Pp. 223–231.
32. Abalakin I.V., Anikin V.A., Bakhvalov P. A., Bobkov V.G. and Kozubskaya T. K. Numerical investigation of the aerodynamicand acoustical properties of a shrouded rotor. // Fluid Dynamics, 2016, Vol. 51, No. 3, pp. 419–433. 33. Kritskiy B.S., Makhnev M.S., Mirgazov R.M., Subbotina P.N., Trebunskikh
T.V. Aerodynamic characteristics calculation on single rotor blade using FloEFD, ANSYS Fluent and RC-VTOL. // Civil Aviation High Technologies. N 223, 2016. – Pp. 77 – 83.
Table 1: Comparison of the turbulence models used for rotor modeling.
Author CFD Solver Turbulence Model Test Case Institute
Pahlke et al.
[16], 2005 FLOWer
BL, k−ω [1],
k−ω LEA [17, 18] 7A/7AD DLR
Renaud et al.
[19], 2008 elsA SA, k−l, k−ω Dauphin 365N ONERA
Dietz et al. [20], 2009 FLOWer k−ω Винт BK-117 и полный вертолет Eurocopter Borie et al. [21], 2009 elsA k−ω NH 90 Eurocopter
12 Potsdam et al.
[22], 2009 OVERFLOW SA [11] (near body) and inviscid Dauphin 365N AMRDEC Khier et al. [23], 2009 FLOWer k−ω NH 90 DLR Smith et al. [24], 2009 OVERFLOW SA, k−ω SST [12], GTKES [25], HRLES-SGS [26] Yawed
NACA0012 Georgia Tech Sitaraman et al.
[5], 2009 UMTURNS SA and wake model UH 60A National Institute of Aerospace Min et al. [27],
2009 GENECAS SA DES [4] and wake model Винт Bo-105 Georgia Tech Steijl et al. [28], 2009 HMB k−ω Georgia Tech Teetering-Rotor, ROBIN, GOAHEAD University of Liverpool
Table 2. ONERA 7A flight conditions and trimming for the various simulations. The angles are given in degrees.
μ M∞ Ст as θ0 θ1c θ1s ßo ß1c ß1s
0.390 0.2399 0.005 11.0 14.0 −2.0 4.5 0.0 4.5 0.0 Table 5: Control angles for the HART-II rotor simulation, in degrees.
Case as θ0 θ1s θ1c
untrimmed 4.5 2.96 0.97 -1.57
trimmed 4.5 2.96 1.47 -1.57
Figure 1. Properties of the 7A/7AD rotors.
13 (a) M2C n, r/R = 0.7 (b) M2Cm, r/R = 0.7 (c) M2C n, r/R = 0.825 (d) M2Cm, r/R = 0.825 (e) M2C n, r/R = 0.975 (f) M2Cm, r/R = 0.975
Figure 2. Comparison of the Mach scaled normal and moment coefficients at three sections obtained with URANS and DES with experiments.
14 Figure 3. HART-II rotor blade tip deformation used in the CFD simulation compared to
experimental measurements [13].
Figure 4. Comparison of the Mach-scaled coefficient at r/R = 0.87 during a revolution of the HART-II rotor with experimental measurements [13], mean and first harmonics removed.
Figure 5. λ2-criterion iso-surfaces for the flow around the HART-II rotor, coloured with the pressure. View from the top of the rotor.
15
(a) SA (b) DES
(c) Difference (DES-SA)
Figure 6. Mach-scaled normal force coefficient for the HART-II rotor, using the SA and DES
(a) M2Cn
16 Figure 7. Comparison of the Mach-scaled normal force coefficient for the HART-II rotor at r/R=
![Figure 3. HART-II rotor blade tip deformation used in the CFD simulation compared to experimental measurements [13]](https://thumb-us.123doks.com/thumbv2/123dok_us/1877436.2774079/15.892.238.724.191.627/figure-hart-rotor-deformation-simulation-compared-experimental-measurements.webp)