Use of the Ames Check Standard Model for
the Validation of Wall Interference Corrections
N. Ulbrich
†Jacobs Technology Inc., Moffett Field, California 94035
M. Amaya
‡ andR. Flach
§NASA Ames Research Center, Moffett Field, California 94035
The new check standard model of the NASA Ames 11–ft Transonic Wind Tunnel was chosen for a future validation of the facility’s wall interference cor-rection system. The chosen validation approach takes advantage of the fact that test conditions experienced by a large model in the slotted part of the tunnel’s test section will change significantly if a subset of the slots is temporarily sealed. Therefore, the model’s aerodynamic coefficients have to be recorded, corrected, and compared for two different test section configurations in order to perform the validation. Test section configurations with highly accurate Mach number and dynamic pressure calibrations were selected for the validation. First, the model is tested with all test section slots in open configuration while keeping the model’s center of rotation on the tunnel centerline. In the next step, slots on the test section floor are sealed and the model is moved to a new center of rotation that is 33 inches below the tunnel centerline. Then, the original angle of attack sweeps are repeated. Afterwards, wall interference corrections are applied to both test data sets and response surface models of the resulting aerodynamic coefficients in interference–free flow are generated. Finally, the response surface models are used to predict the aerodynamic coefficients for a family of angles of attack while keeping dynamic pressure, Mach number, and Reynolds number constant. The validation is considered successful if the corrected aerodynamic coefficients obtained from the related response surface model pair show good agreement. Residual differences between the corrected coefficient sets will be analyzed as well because they are an indicator of the overall accuracy of the facility’s wall interference correction process.
Nomenclature
A = reference area used for the calculation of an aerodynamic coefficient
Aξ = geometric reference parameter of an aerodynamic coefficient
aξ1, aξ2, . . . = regression coefficients of the response surface model of an aerodynamic coefficient
cξ = aerodynamic coefficient of a force or moment with symbol ξ
l = reference length needed for the calculation of a moment coefficient
M = Mach number in free–air flow
Munc = Mach number, not corrected for wall interference effects
M0 = transformed Mach number in free–air flow
M◦ = constant reference Mach number
Q = dynamic pressure in free–air flow
† Aerodynamicist, Jacobs Technology Inc. ‡ Data Engineer, NASA Ames Research Center § Test Engineer, NASA Ames Research Center
Qunc = dynamic pressure, not corrected for wall interference effects
Q0 = transformed dimensionless dynamic pressure in free–air flow
Q◦ = constant reference dynamic pressure
Re = Reynolds number in free–air flow
Reunc = Reynolds number, not corrected for wall interference effects
Re0 = transformed Reynolds number in free–air flow
Re◦ = constant reference Reynolds number
α = angle of attack in free–air flow
αunc = angle of attack, not corrected for wall interference effects
α0 = transformed dimensionless angle of attack in free–air flow
α◦ = constant reference angle of attack
δα = angle of attack correction caused by wall interference effects
= blockage factor
ξ = load symbol (e.g., L≡lift force, D≡drag force, M≡pitching moment, etc.)
ψ = response surface model of an aerodynamic coefficient
I. Introduction
The NASA Ames 11–ft Transonic Wind Tunnel uses a modified version of the wall signature method to estimate wall interference corrections for a wind tunnel model that is tested in the facility from moderate to high subsonic Mach numbers (see Refs. [1] and [2] for a general description of wind tunnel wall interference calculations). The correction calculation itself is performed by using the TWICS software that was originally developed for the NASA Ames 12–ft Pressure Wind Tunnel. The TWICS software computes blockage, angle of attack, and a variety of higher order wall interference corrections in “real–time” by combining a singularity representation of the test article and precomputed solutions of the subsonic potential equation with lift, pitching moment, and wall pressure measurements (see, e.g., Refs. [3] and [4] for a description of the correction approach that the TWICS software uses).
The correction calculation algorithm of the TWICS software was indirectly validated during its initial development by using classical wall interference flow field solutions that are available for the closed–wall boundary condition. In addition, a limited amount of experimental data from a closed–wall wind tunnel test was analyzed to validate blockage corrections for highly separated flows (see Ref. [5]). Finally, a direct validation of the computed wall interference corrections in the NASA Ames 11–ft Transonic Wind Tunnel was performed in 2003 using data from the test of a large semi–span model (see Refs. [6] and [7]).
The direct validation of 2003 generated different uncorrected aerodynamic coefficient sets by changing the boundary conditions on the test section walls and ceiling (see Ref. [6], [7]). First, the model was tested using the default test section configuration for a floor–mounted semi–span model. In this case, slots on the test section floor are sealed to create the model’s image plane while slots on the side walls and ceiling remain in “open” configuration. Afterwards, all remaining slots were sealed and the original angle of attack sweeps were repeated. Then, wall interference corrections were computed for the two test section configurations by using the TWICS software. Finally, corrected coefficient sets were compared. Remaining differences between the corrected coefficient sets were small but not negligible. Further investigations indicated that the observed differences could have potentially been smaller if (i) a more accurate test section calibration would have been available for the closed wall configuration, (ii) the angle of attack sweeps would have been conducted using a smaller spacing of the uncorrected Mach numbers, and, (iii) response surface models of the corrected aerodynamic coefficients would have been used to generate data for the final comparison of the corrected coefficient sets from the two test section configurations. These three changes would have probably reduced numerical errors associated with the test data interpolation that was needed for the final comparison of the corrected coefficient sets (see Ref. [6], p. 15/16, for a discussion of the data interpolation).
The authors realized at the beginning of 2017 that the recently completed Ames Check Standard Model (ACSM) could be used for a future validation of the 11–ft Transonic Wind Tunnel’s wall interference correc-tion estimates. This new validacorrec-tion attempt would address the shortcomings of the original validacorrec-tion that was performed in 2003. Details of the new validation approach are described in the next section.
II. Correction Validation Approach
A. Description Of Validation Approach
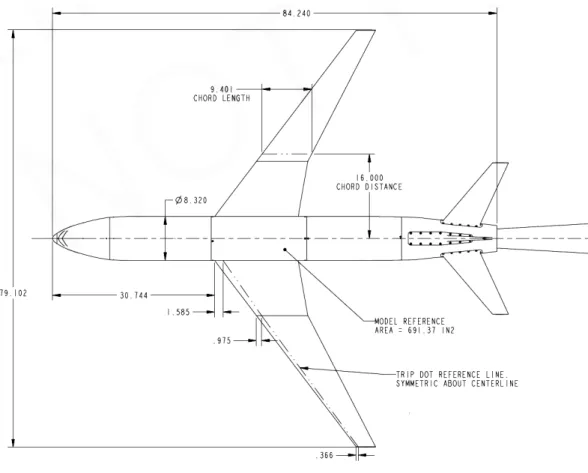
The ACSM was chosen for a direct validation of the wind tunnel wall interference correction system of the Ames 11–ft Transonic Wind Tunnel because (i) it will frequently be tested in the facility and (ii) it is expected to generate relatively large wall interference corrections. The ACSM is a full–span model that has the geometry of a generic commercial transport type aircraft. The ACSM’s layout is a close “variation” of NASA’s Common Research Model (CRM). It has the wing and fuselage of the CRM but no engine nacelles. In addition, it has a modified tail geometry to allow for aft sting entry. Figure 1 shows NASA’s CRM during a previous test in the 11–ft Transonic Wind Tunnel (see Ref. [8] for details about the CRM). The fabrication of the ACSM was completed in 2016 (Figures 2a and 2b show layout and principle dimensions of the ACSM; Figure 2c shows the final assembly of the ACSM). It is planned to test the ACSM in the 11–ft Transonic Wind Tunnel for the first time at the beginning of 2018. This test will establish a baseline database to track the stability of the overall test process using the principles of statistical process control.
The ACSM’s aerodynamic coefficients are expected to be significantly influenced by wall interference effects because the model has a relatively large wing span and fuselage volume. Therefore, the model’s aerodynamic coefficient set may be used to validate the facility’s wall interference correction estimates as long as the model is tested in at least two flow fields with significantly different test section boundary conditions. This approach is acceptable because wall interference corrections can be interpreted as an estimate of the bias error in the test data that is caused by the difference between the boundary conditions of the test section and the boundary conditions in “free–air.” This statement can be summarized as follows:
Wall Interference ≡ Test–Section Specific Bias Error in Test Data
Wall interference effects result in a test–section specific “bias” error in the test data that is caused by the fact that, in general, the boundary conditions of the tunnel’s test section do not match the “free–air” boundary conditions.
The interpretation of wall interference effects as a “test–section specific” bias error also highlights two important reasons why wall interference corrections should be estimated in a wind tunnel. First, tunnel–to– tunnel comparisons of the aerodynamic coefficients can only successfully be performed after wall interference effects are completely removed from the test data. In addition, the magnitude and variation of wall in-terference corrections on the model must not exceed certain limits so that the presence of the test section boundaries does not influence the detection of fundamental aerodynamic phenomena on the model. There-fore, for example, it is often recommended that the span of a wind tunnel model should not exceed 70 % to 75 % of the test section width so that wall interference induced stream–angle variations from the root to the tip of the wing do not change the wing’s flow separation characteristics.
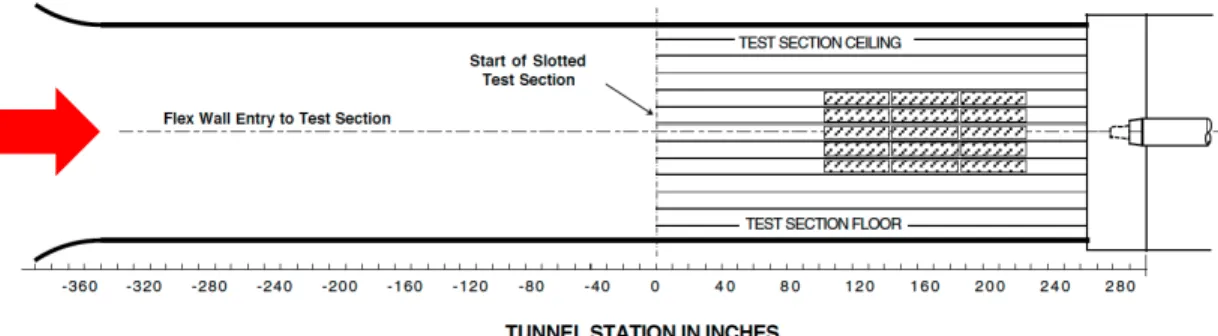
Basic elements of the authors’ improved wall interference correction validation approach can be sum-marized in a few sentences. In principle, their approach takes advantage of the fact that the uncorrected test data recorded for a large full–span model in a slotted wall test section will change substantially if the floor slots are temporarily sealed. Consequently, aerodynamic coefficients have to be recorded, corrected, and compared for two test section configurations in order to perform the validation. First, the model is tested using the default slot configuration of the test section for full–span model tests. In that case, all slots on the side walls, the ceiling, and the floor of the test section are in “open” configuration. Angle of attack sweeps at different Mach numbers and total pressures are performed during this phase of the validation while keeping the model’s center of rotation on the tunnel centerline (Figure 3a shows a side view of the tunnel’s test section). Then, the test section boundary conditions and the position of the model’s center of rotation are changed. Therefore, slots on the test section floor are temporarily sealed and the model is moved to a new center of rotation that is 33 inches below the tunnel centerline. Now, the original angle of attack sweeps are repeated at the new center of rotation of the model. Model blockage and angle of attack corrections are computed for all data points taken for both test section configurations by using the tunnel’s real–time
wall interference correction system. Finally, response surface models of the corrected lift, drag, and pitching moment coefficients of the two test section configurations are generated after the test data was corrected for wall interference effects. The validation is considered successful if the predicted aerodynamic coefficients obtained from related pairs of response surface models show reasonable agreement. In addition, results of the check standard model test will help quantify the magnitude of residual differences between the corrected coefficient sets.
B. Mach Number Calibration
It was concluded after the initial attempt to validate the 11–ft Transonic Wind Tunnel’s wall interference correction system in 2003 that the availability of an accurate Mach number calibration for each test section configuration plays an important role during the validation of wall interference corrections. Therefore, the test matrix of the ACSM will be defined for the validation test such that two highly accurate long static pipe calibrations of the test section can be used (i) to set the uncorrected Mach numbers for the angle of attack sweeps and (ii) to determine clear tunnel buoyancy (see Ref. [9] for more details).
Figure 3b shows the location of the long static pipe when the test section was originally calibrated with slots on the test section side walls, the ceiling, and the floor in “open” configuration. Results of this tunnel condition calibration will be used to set the Mach number during the first phase of the validation test when the model’s center of rotation is kept on the tunnel centerline. Figure 3c shows the location of the long static pipe when the test section was calibrated with slots on the test section side walls and ceiling in “open” configuration and sealed floor slots. Results of this alternate tunnel condition calibration will be used to set the Mach number during the second phase of the validation test when the center of rotation of the model is located 33 inches below the tunnel centerline so that the model’s reference point agrees with the position of the long static pipe during the Mach number calibration.
C. Response Surface Model of an Aerodynamic Coefficient
The authors intend to use response surface models of the ACSM’s corrected aerodynamic coefficient sets in order to compare them at constant corrected dynamic pressure, Mach number, and Reynolds number. The correction validation is considered successful if the corrected coefficients for a family of angles of attack show “reasonable” agreement. The use of response surface models also has the advantage that residual differences between the corrected aerodynamic coefficient sets of the two test section configurations can be quantified which may be an indirect indicator of the overall accuracy of the facility’s wall interference correction scheme. Therefore, basic properties of the response surface model of an aerodynamic coefficient are briefly reviewed in this section so that a suitable combination of test conditions can be selected for the validation test.
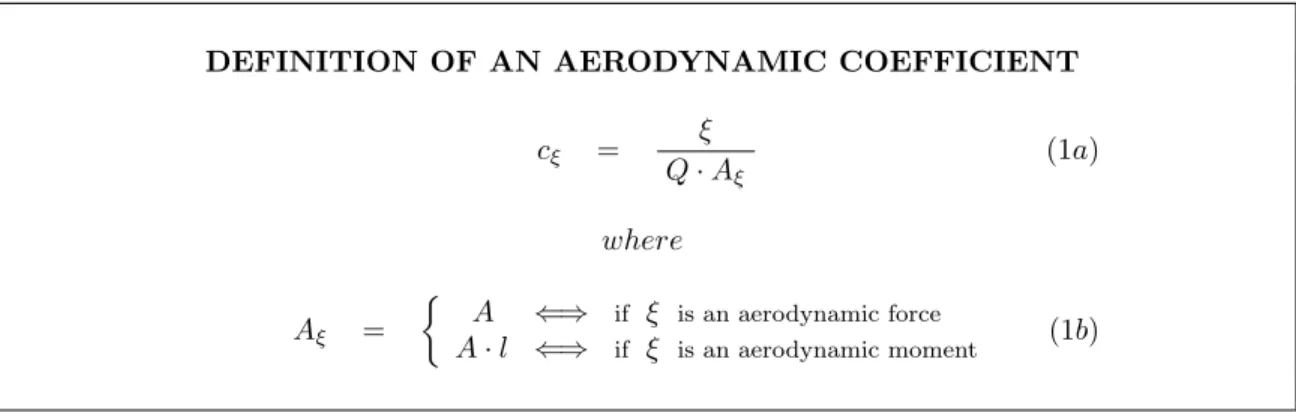
The development of a response surface model of an aerodynamic coefficient starts with the selection of independent variables (factors) that determine a coefficient’s magnitude and sign. An aerodynamic coefficient is a dimensionless description of the magnitude and sign of an aerodynamic force or moment that acts on the wind tunnel model. The aerodynamic force or moment is made dimensionless after dividing it by (i) the dynamic pressure and (ii) a geometric reference parameter. This definition can be expressed as follows
DEFINITION OF AN AERODYNAMIC COEFFICIENT
cξ = ξ Q·Aξ (1a) where Aξ = A ⇐⇒ if ξ is an aerodynamic force A·l ⇐⇒ if ξ is an aerodynamic moment (1b)
whereξrepresents an aerodynamic force or moment,Qis the dynamic pressure,Ais a reference area, andl
variables, i.e.,ξandQ, because the reference parameterAξ is a constant that is only related to the geometry of the test article. However, a closer examination of the physical parameters influencing both magnitude and sign of an aerodynamic load in subsonic, transonic, or supersonic flow reveals that the load is, in reality, a function of four independent variables as long as the test article geometry remains unchanged and both sideslip and roll angle are constant. The variables are (i) angle of attack, (ii) dynamic pressure, (iii) Mach number, and (iv) Reynolds number. This conclusion can be summarized as follows:
independent variables of an aerodynamic coeff icient =⇒ α , Q , M , Re
Consequently, Eq. (1a) above can be written as follows:
cξ {α , Q , M , Re} =
ξ{α , Q , M , Re}
Q·Aξ
(2)
The suggested independent variable set, i.e.,{α, Q, M, Re}, is the preferred choice of an aerodynamicist. It describes the orientation of the model relative to the direction of the free stream flow and the three most important physical characteristics of the fluid itself that influence both sign, magnitude, and location of the aerodynamic load vectors in subsonic, transonic, or supersonic flow. These three physical characteristics are (i) the kinetic energy of a fluid particle described by the dynamic pressure, (ii) compressibility effects described by the Mach number, and (iii) viscous effects described by the Reynolds number. Theoretically, it is possible to replace the dynamic pressure, Mach number, and Reynolds number by three facility mea-surements, i.e., static pressure, total pressure, and total temperature, because they are directly related. Now, a basic functional representation of the response surface model of an aerodynamic coefficient can be defined by assuming, for example, that a multi–variate quadratic with intercept, linear, quadratic, and cross– product terms is used to construct the response surface model. The resulting functional representation can be summarized as follows cξ ≈ ψ {α , Q , M , Re} (3a) where ψ = aξ1 + aξ2 · α + aξ3 · Q + aξ4 · M + aξ5 · Re + aξ6 · (α)2 + aξ7 · (Q)2 + aξ8 · (M)2 + aξ9 · (Re)2 + aξ10 · (α·Q) + aξ11 · (α·M) + aξ12 · (α·Re) + aξ13 · (Q·M) + aξ14 · (Q·Re) + aξ15 · (M·Re) (3b)
In principle, the 15–term regression model defined in Eq. (3b) above has the correct functional description assuming that the given wind tunnel test data supports all terms. However, due to large differences in the magnitudes of the independent variables, it is recommended for a “real–world” application of the model to “scale” the variables such that their magnitudes become compatible. This scaling can be accomplished by (i) picking a fixed reference value set{α◦, Q◦, M◦, Re◦}for the independent variables and (ii) defining a linear transformation that connects the unscaled value set{α, Q, M, Re}to the scaled value set{α0, Q0, M0, Re0}. The authors recommend a linear transformation for this purpose that simply divides the difference between the independent variable value and its reference value by the reference value itself. The fixed reference value of an independent variable could be, for example, the arithmetic mean of the minimum and maximum value that the wind tunnel model is designed for (e.g.,α◦= [min(α) +max(α)]/2). It is important to always use the same fixed reference values for the analysis after they have first been selected. Then, response surface models obtained from different wind tunnel tests or wind tunnels remain compatible from a numerical point of view. Finally, after applying the suggested linear transformation to the independent variables, the revised response surface model of an aerodynamic coefficient can be summarized as follows
RESPONSE SURFACE MODEL OF AN AERODYNAMIC COEFFICIENT cξ ≈ ψ{α0, Q0 , M0, Re0 } = aξ1 + aξ2 · α0 + . . . + aξ15 · (M0·Re0) (4a) α0 = (α − α◦)/ α◦ ⇐⇒ α◦ = const. (4b) Q0 = (Q − Q ◦)/ Q◦ ⇐⇒ Q◦ = const. (4c) M0 = (M − M◦)/ M◦ ⇐⇒ M◦ = const. (4d) Re0 = (Re − Re◦)/ Re◦ ⇐⇒ Re◦ = const. (4e)
where the coefficients aξ1, aξ2, . . . , aξ15 are obtained by applying a multi–variate least squares fit to the entire wind tunnel test data of the given test article configuration. The response surface model’s intercept term, i.e., aξ1, has a simple physical interpretation: it is the least squares approximation of the model’s aerodynamic coefficient if {α, Q, M, Re}, i.e., the angle of attack, dynamic pressure, Mach number, and Reynolds number in free–air, match the fixed reference value set given by{α◦, Q◦, M◦, Re◦}.
In general, as mentioned earlier, wall interference effects cause a test section specific bias error in the uncorrected wind tunnel test data. This error needs to be estimated and removed before the final response surface model of an aerodynamic coefficient is computed so that the response surface model is independent of the boundary conditions of the wind tunnel’s test section where the test data was originally collected. This fundamental challenge of wind tunnel testing can be summarized as follows assuming that base pressure, support system interference, and clear tunnel buoyancy corrections are also known:
FUNDAMENTAL CHALLENGE OF WIND TUNNEL TESTING
Wind tunnel data can only be used to generate an aerodynamic coefficient’s response surface model in “free–air” flow if wall interference, base pressure, support system interference, and clear tunnel buoyancy corrections are applied to the (1) aerodynamic loads, (2) angle of attack, (3) dynamic pressure, (4) Mach number, and (5) Reynolds number before the aerodynamic coefficients themselves are computed.
Now, assuming that the angle of attack correction (δα) and the blockage factor () are computed for every test data point by using the facility’s wall interference correction algorithm, the “corrected” independent variable set {α, Q, M, Re} of the response surface model in “free–air”, i.e., interference–free, flow can be obtained from the wind tunnel’s “uncorrected” independent variable set{αunc, Qunc, Munc, Reunc}by using the following set of classical first order wall interference correction equations (taken from Ref. [1], p. 2-33):
α = αunc + δα (5a) Q = Qunc · 1 + ( 2 − Munc2 ) (5b) M = Munc · 1 + ( 1 + 0.2Munc2 ) (5c) Re = Reunc · 1 + ( 1 − 0.7 Munc2 ) (5d) First, Eq. (5b) above should be used to correct the dynamic pressures that are needed as input for the calculation of the aerodynamic coefficients. Then, the angle of attack, Mach number, and Reynolds number should be corrected by using Eqs. (5a), (5c), and (5d). Finally, Eqs. (4a) to (4e) should be used to define the response surface models and perform the least squares fit of the corrected wind tunnel test data so that the desired response surface models of the corrected aerodynamic coefficients in “free–air” flow is obtained.
The first order wall interference corrections used in the above equations, i.e., δα and , will differ for corresponding uncorrected test data points of the two test section configurations that will be used for the validation test (Config. 1 ≡ model is tested on tunnel centerline with all test section slots in “open” configuration; Config. 2≡model is tested 33 inches below the tunnel centerline with floor slots in “closed” configuration). However, assuming that the wall interference corrections are able to accurately remove the “test section” bias error from the wind tunnel test data, the response surface models obtained from the two corrected wind tunnel data sets should show good agreement if the validation is successful. This conclusion can be summarized by the following statements:
The coefficients aξ1, aξ2, aξ3, . . . of the response surface model of a corrected aerodynamic coeffi– cient cξ are constants that describe the physical behavior of the given test article configuration in
“free–air” flow. They are independent of the wind tunnel characteristics. Therefore, in theory, re– gression coefficients obtained from data recorded in different tunnels or test sections should agree as long as (i) wall interference, base pressure, support system interference, and clear tunnel buoyancy cor– rections are applied to the data and (ii) the regression model terms of the aerodynamic coefficient match.
A more detailed description of the Ames Check Standard Model and the test matrix for the wall interference correction validation is provided in the next section of the paper.
III. Model and Validation Test Matrix Description
A. Model Description
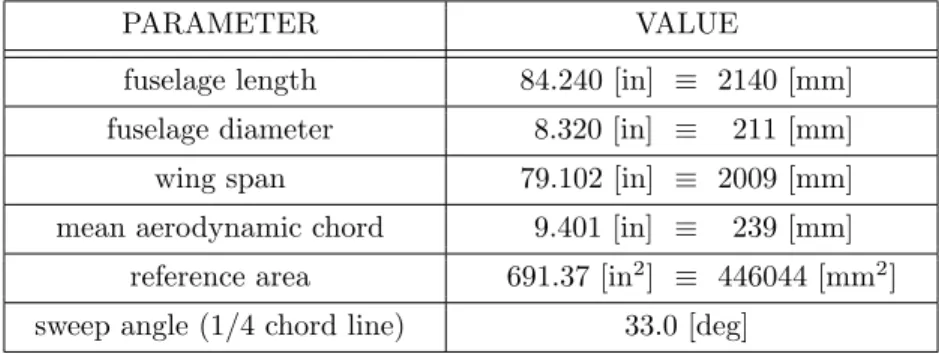
The new Ames Check Standard Model (ACSM) was specifically designed to track the overall quality of the test process in the NASA Ames 11–ft Transonic Wind Tunnel using the methods of statistical process control. The model is intended to be used in combination with the Ames Unitary Short Static Pipe (see Ref. [10]) in order to verify the stability of the most important steps of the testing process. These steps include (1) model buildup, (2) instrumentation checkout, (3) balance check loading, (4) model installation, (5) test data acquisition, and (6) test data reduction. Figure 2b shows the principle dimensions of the model. The model is relatively large for the size of the tunnel’s test section. It has a wingspan of 79 inches which corresponds to approximately 60 % of the tunnel’s width. Therefore, first order test data corrections are expected to be significant. These corrections include (i) standard base and cavity corrections, (ii) buoyancy correction, and (iii) wall interference corrections. Table 1 below summarizes the model’s most important geometric parameters.
Table 1: Basic geometric description of the Ames Check Standard Model.
PARAMETER VALUE
fuselage length 84.240 [in] ≡ 2140 [mm]
fuselage diameter 8.320 [in] ≡ 211 [mm]
wing span 79.102 [in] ≡ 2009 [mm]
mean aerodynamic chord 9.401 [in] ≡ 239 [mm] reference area 691.37 [in2] ≡ 446044 [mm2] sweep angle (1/4 chord line) 33.0 [deg]
The predicted load envelope of the ACSM will allow for the use of a variety of strain–gage balances that are either already a part of the tunnel’s balance inventory or are currently being manufactured. In addition, “off–blocks” were built for the wings and empennage in order to support incremental drag testing. It is planned to primarily conduct aerodynamic performance tests with the ACSM near its design Mach number of 0.85 as these types of tests have very high data accuracy requirements.
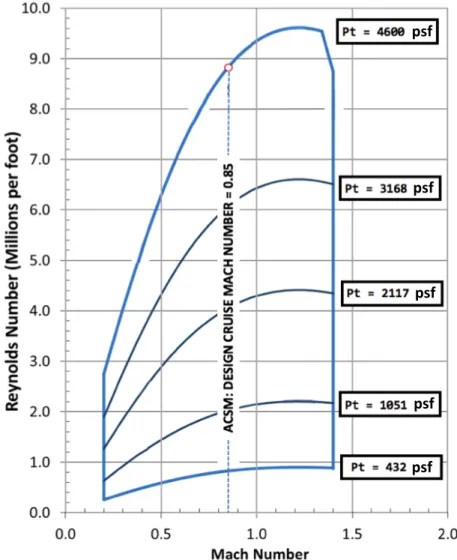
The first use of the ACSM in the 11–ft Transonic Wind Tunnel will take place during the first quarter of 2018. This “shakedown” test will evaluate the overall handling characteristics of the model within the tunnel’s operating envelope that is shown in Fig. 4. In particular, the following primary test objectives were identified for the “shake–down” test: (i) a data sampling study will be performed to determine the best data acquisition time; (ii) the angle of attack and sideslip angle range will be defined; (iii) flow angularity will be measured; (iv) repeat runs will be performed in order to develop a suitable statistical process control approach; (v) the operating pressure range will be determined in order to properly size pressure instrumentation; (vi) the measured balance loads will be compared with the original load predictions in support of the sizing of a new balance that is currently being fabricated; (vii) the horizontal stabilizer will be removed in order to do incremental drag testing.
The actual validation of the tunnel’s wall interference correction system will happen some time after the initial “shakedown” test of the model. Then, an alternate sting support system configuration will have to be used with the ACSM that includes a 5 degree sting bend insert. This support system change will increase the possible angle of attack range of the model when the model will be tested 33 inches below the tunnel centerline.
B. Test Matrix for Validation
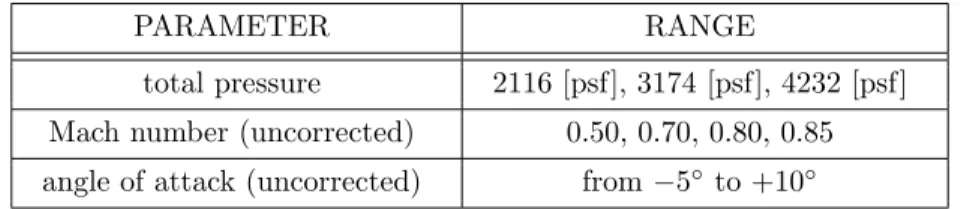
The test matrix for the validation test will be defined after the final analysis of the results from the “shakedown” test. Therefore, only a preliminary selection of the Mach number, total pressure, and angle of attack range for the validation test can currently be made. Table 2 below summarizes the chosen preliminary test parameter:
Table 2: Test conditions for the wall interference correction validation test.
PARAMETER RANGE
total pressure 2116 [psf], 3174 [psf], 4232 [psf] Mach number (uncorrected) 0.50, 0.70, 0.80, 0.85 angle of attack (uncorrected) from−5◦to +10◦
The variation of the total pressure at constant Mach number will generate the variation of the Reynolds number that is needed for the preparation of the response surface models of the corrected aerodynamic coefficient sets. It is planned to conduct an angle of attack sweep for all twelve possible combinations of the Mach number and total pressure that are shown in Table 2 above. First, twelve runs will be performed with all test section slots in “open” configuration while keeping the model on the tunnel centerline. Afterwards, the test section floor slots will be sealed and the model will be moved to a position that is 33 inches below the tunnel centerline. Then, the twelve runs will be repeated for the new test configuration.
Wall pressure signature data will be collected for all 24 runs so that wall interference corrections can be computed for the two test configurations. Afterwards, the test data will be corrected for wall interference by using the correction equations that are defined in Eqs. (5a) to (5d). Finally, the response surface models of the corrected aerodynamic coefficient sets of the two test section configurations will be generated and compared.
IV. Summary and Conclusions
The new check standard model of the NASA Ames 11–ft Transonic Wind Tunnel will be used for a future validation of the facility’s wall interference correction system. The validation will be performed by taking wind tunnel test data for two different test configurations so that substantially different uncorrected aerodynamic coefficient sets can be generated.
First, test data will be recorded with all test section slots in “open” configuration while keeping the model’s center of rotation on the tunnel centerline. Afterwards, the model’s center of rotation will be moved to a new position that is 33 inches below the tunnel centerline and the slots on the test section floor will be sealed. Then, the initial angle of attack sweeps will be repeated. Wall interference corrections will be applied to the uncorrected test data that was obtained for the two test section configurations. Finally, response surface models of the aerodynamic coefficients for the two test configurations will be generated
from the corrected test data and compared.
The validation of the tunnel’s wall interference correction system will be considered successful if the predicted coefficients from the two response surface model sets show “reasonable” agreement. The magnitude of the residual difference between the predicted aerodynamic coefficients of the two response surface model sets will be considered an indicator of the overall quality of the corrections that the wall interference correction system can predict.
Acknowledgements
The authors want to thankAlan L’EsperanceandBob Gislerof NASA Ames Research Center for their critical and constructive review of the final manuscript. The work reported in this paper was partially supported by the Wind Tunnel Division at NASA Ames Research Center under contract NNA16BD26C.
References
1Ewald, B. F. R. (ed.), Wind Tunnel Wall Corrections, AGARDograph 336, North Atlantic Treaty Organization, October 1998.
2Garner, H. C., and Rogers, E. W. E., Acum, W. E. A. and Maskell, E. C.,Subsonic Wind Tunnel Wall Corrections, AGARDograph 109, North Atlantic Treaty Organization, October 1966 .
3Ulbrich, N., “The Real-Time Wall Interference Correction System of the NASA Ames 12–Foot Pressure Wind Tunnel,” contractor report, NASA/CR–1998–208537, NASA Ames Research Center, Moffett Field, California, July 1998.
4Boone, A. R., and Ulbrich, N., “The Development of a Wall Pressure Measurement System for two NASA Ames Wind Tunnels,” AIAA 2002–3250, paper presented at the 22nd AIAA Aerodynamic Measure-ment Technology and Ground Testing Conference, St. Louis, Missouri, June 2002.
5Ulbrich, N., and Cooper, K. R., “The Application of a Wall Interference Correction Method to Flat Plate Models,” AIAA 2003–0451, paper presented at the 41st AIAA Aerospace Sciences Meeting, Reno, Nevada, January 2003.
6Ulbrich, N., and Boone, A. R., “Direct Validation of the Wall Interference Correction System of the Ames 11-Foot Transonic Wind Tunnel,” technical memorandum, NASA/TM–2003–212268, NASA Ames Research Center, Moffett Field, California, May 2003.
7Ulbrich, N., and Boone, A. R., “Validation of a Wall Interference Correction System for a Transonic Wind Tunnel,” AIAA 2004–0605, paper presented at the 42nd AIAA Aerospace Sciences Meeting, Reno, Nevada, January 2004.
8Rivers, M. B., and Dittberner, A., “Experimental Investigations of the NASA Common Research Model in the NASA Langley National Transonic Facility and NASA Ames 11-Ft Transonic Wind Tunnel,” AIAA 2011–1126, paper presented at the 49th AIAA Aerospace Sciences Meeting, Orlando, Florida, January 2011. 9Amaya, M., and Boone, A. R., “Calibration of the 11–By 11–Foot Transonic Wind Tunnel at the NASA Ames Research Center,” AIAA 2005–4277, paper presented at the 41st AIAA/ASME/SAE/ASEE Joint Propulsion Conference & Exhibit, Tucson, Arizona, July 2005.
10Amaya, M., Flach, R., and L’Esperance, A., “Initial Testing of the Ames Unitary Short Static Pipe,” AIAA 2017–1277, paper presented at the 55th AIAA Aerospace Sciences Meeting, Grapevine, Texas, January 2017.
NASA AMES 11FT TRANSONIC WIND TUNNEL – COMMON RESEARCH MODEL
Fig. 1Test of NASA’s Common Research Model in the NASA Ames 11–ft Transonic Wind Tunnel.
ALL DIMENSIONS IN INCHES
Fig. 2bTop view and principle dimensions of the Ames Check Standard Model.
Fig. 3aSide view of the test section of the NASA Ames 11–ft Transonic Wind Tunnel.
long static pipe located on the tunnel’s centerline
“open” floor slots
“closed” floor slots
long static pipe located 33 [in] below the tunnel’s centerline
Fig. 3cLong static pipe test with closed floor slots.