Document downloaded from:
This paper must be cited as:
The final publication is available at
Copyright
http://dx.doi.org/10.1016/j.mcm.2011.10.050
http://hdl.handle.net/10251/37761
Elsevier
Salvador, F. J.; Martínez López, J.; Romero Bauset, JV.; Roselló Ferragud, MD. (2013).
Computational study of the cavitation phenomenon and its interaction with the turbulence
developed in diesel injector nozzles by Large Eddy Simulation (LES). Mathematical and
Computer Modelling. 57(7):1656-1662. doi:10.1016/j.mcm.2011.10.050.
Computational study of the cavitation phenomenon and its interaction with the
turbulence developed in diesel injector nozzles by Large Eddy Simulation (LES)
F.J. Salvadora,∗, J. Mart´ınez-L´opeza, J.-V. Romerob, M.-D. Rosell´ob
aCMT- Motores T´ermicos, Universitat Polit`ecnica de Val`encia, Camino de Vera s/n, Edificio 6D, 46022, Valencia, Spain bInstituto de Matem´atica Multidisciplinar, Universitat Polit`ecnica de Val`encia, Camino de Vera s/n, Edificio 8G,2o, 46022, Valencia, Spain
Abstract
In the present paper, a homogeneous equilibrium model with a barotropic equation of state has been used for modeling cavitation in a real multi-hole microsac nozzle. The turbulence effects have been taking into account by Large Eddy Simulation (LES), using the Smagorinsky model as the sub-grid scale turbulent model and the Van Driest model for the wall damping.
Firstly, the code has been validated at real operating diesel engine conditions with experimental data in terms of mass flow, momentum flux and effective velocity, showing that the model is able to predict with a high level of confidence the behavior of the internal flow at cavitating conditions. Once validated, the code has allowed to study in depth the turbulence developed in the discharge orifices and its interaction with cavitation phenomenon.
Keywords: cavitation, Large Eddy Simulation, internal flow, diesel injector
1. Introduction
1
Most of the improvements achieved to reduce the emissions of diesel engines and improve their efficiency are due
2
thanks to the advances in fuel injection systems. One of the most widely used strategies in recent years has been the
3
increase of injection pressure, which has forced that cavitation and turbulence play a fundamental role on the internal
4
flow and spray development [1, 2].
5
The experimental study of the turbulence developed within diesel injector nozzles and its interaction with
cavi-6
tation phenomenon present huge difficulties due to extremely small size of the holes, the existence of a multiphase
7
flow and the high velocities found in the discharge orifices, so the use of Large Eddy Simulation (LES) has become a
8
great alternative to advance in the knowledge of the internal flow [3, 4]. This technique, which captures the large scale
9
motions of the flow and models the small scale motions that occur on length scales smaller than the mesh spacing,
10
can be viewed as a bridge between Direct Numerical Simulation (DNS) and the cheapest method to model turbulent
11
flows, Reynolds Averaged Navier-Stokes (RANS).
12
In the present paper, a homogeneous equilibrium model has been used for modeling cavitation in a diesel injector
13
nozzle simulating real operating engine conditions. The paper has been organized in the following way. Firstly, a
14
complete description of the code used to model cavitation will be presented in section 2. Secondly, the details of the
15
multihole nozzle and the general setup of the simulations will be presented in section 3. The results obtained in the
16
validation of the code, comparing numerical results against experimental ones in terms of mass flow, momentum flux
17
and effective velocity will be shown in section 4. The vapour phase distribution and its interaction with the turbulence
18
developed within the nozzle will be raised in sections 5 and 6 respectively. Finally, the main conclusions of the study
19
will be drawn in section 7.
20
∗Corresponding author: Dr. F. Javier Salvador, Tel.:+34 9638779659; fax:+34 963877659.
Email addresses:[email protected](F.J. Salvador),[email protected](J. Mart´ınez-L´opez),[email protected](J.-V. Romero),[email protected](M.-D. Rosell´o)
2. Cavitation modelling
21
Due to high velocities and pressures that occur in diesel injectors nozzles, the use of a homogeneous equilibrium
22
model (HEM), which assumes that liquid and vapour phases are always perfectly mixed, together with a barotropic
23
equation of state seems to be the most suitable method to model cavitation phenomenon [5].
24
This barotropic equation (Eq. (1)) relates pressure and density through the compressibility of the mixture, which
25
is the inverse of the speed of sound squared (Eq. (2)):
26 Dρ Dt = Ψ Dp Dt, (1) 27 Ψ = 1 a2. (2)
Eq. (1) can be introduced directly in the continuity equation to formulate a pressure equation, and must be
28
consistent with the liquid and vapour equations of state both at the limits when there is pure liquid or pure vapour, and
29
also at intermediate states when there is a mixture of both phases.
30
At these limits, the density of the liquid and vapour phases can be defined with a linear equation of state:
31
ρv= Ψv·p, (3)
32
ρl=ρ0l + Ψl·p, (4)
whereρ0
l is liquid density at a given temperature condition. 33
The amount of vapour in the fluid is determined with theγparameter (Eq. (5)), which is 0 in a flow without
34
cavitation and 1 for fully cavitated flows,
35 γ= ρ−ρl sat ρv sat−ρl sat, (5) where 36 ρv sat= Ψv·psat. (6)
The density of the mixture is calculated taking into account the amount of vapour in the fluid (γ) together with a
37
correction term based on the pressure (mixture’s equilibrium equation of state):
38
ρ=γ·ρv+(1−γ)·ρl+ Ψ·(p−psat). (7)
With regard to the mixture’s compressibility and viscosity, they are modeled by a simple linear model as a function
39
of the amount of vapour in the fluid:
40
Ψ =γ·Ψv+(1−γ)·Ψl, (8)
41
µ=γ·µv+(1−γ)·µl. (9)
As far as the methodology used by the solver is concerned, the code starts solving the continuity equation for the
42 density (Eq. (10)): 43 ∂ρ ∂t +∇ · ( ρ⃗u)=0. (10)
The value of density obtained, is used to determine preliminary values of gamma and compressibility by means
44
of Eq. (5) and Eq. (8), and also, for solving momentum equation (Eq. (11)) which is used to get the matrices used to
45
calculate the pressure-free velocity,⃗u:
46 ∂(ρ⃗u) ∂t +∇ · ( ρ⃗u⃗u 2 ) =−∇p+∇ ·(µ∇⃗u)− ∇τ. (11)
The last term of this equation (∇τ) represents the Sub-Grid Scale-Stress used in Large Eddy Simulation, and it has
47
been estimated with the Smagorinsky model (which is one of the most appropriate methods to model channels and
48
internal flow [3, 4, 6]), taking into account the influence of the wall in the turbulence dynamic with the Van Driest
49
damping model.
50
Following, an iterative PISO algorithm is used to solve for p and correct the velocity to achieve continuity. The
51
equation solved for the PISO loop is the continuity equation transformed into a pressure equation by use of the
52
equation of state (Eq. (7)):
53 ∂(Ψp) ∂t − ( ρ0 l +(Ψl−Ψv)psat )∂γ ∂t −psat ∂Ψ ∂t +∇ · (ρ⃗ u)=0. (12)
Once continuity has been reached, the amount of vapour, density and compressibility are updated by means of
54
Eqs. (5), (7) and (8) respectively, which are taken into account to solve again momentum equation, and therefore,
55
repeating the algorithm until convergence.
56
3. Nozzle simulated and simulation setup
57
The nozzle studied in the present paper is a cilindrical six-hole microsac nozzle (and so, it is inclined to cavitate
58
[7, 8]) with a diameter of 170µm, 1 mm of length and a curvature inlet radius of 13µm.
59
The domain simulated belongs to only one orifice of the whole nozzle in order to reduce the high computational
60
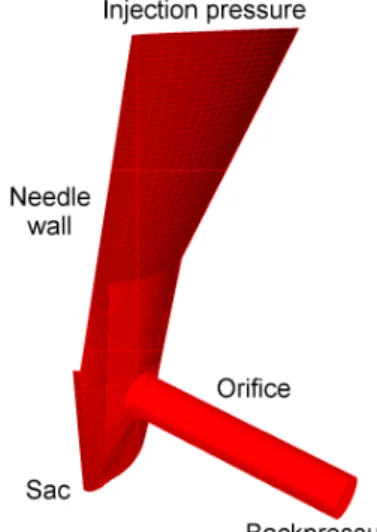
cost typical of Large Eddy Simulation techniques. The geometry, which simulates fully needle lift conditions, includes
61
all the volume occupied by the fuel between the needle and the nozzle internal wall, the needle seat and the orifice,
62
where the fuel flows toward the combustion chamber of the engine (see Fig. 1). The domain has been discretized in
63
a hybrid mesh of 1.836.964 cells, with cell size ranging in the orifice from 0.6µm in the orifice wall to 3µm in the
64
orifice core (D/56.7) and 8µm in the rest of the geometry (sac and the zone between the needle and the nozzle wall).
Figure 1: Multi-hole nozzle simulated. 65
As far as the main boundary conditions are concerned, a fixed pressure condition has been used for the definition of
66
the injection pressure. Despite of some authors advice to use precursor simulation methods [9], not only no differences
67
were found in the numerical results obtained in different simulation tests, but also the use of these boundary conditions
68
greatly increased the computational cost. On the other hand, a mean pressure boundary condition has been applied at
69
the outlet section to simulate the pressure of the combustion chamber. This boundary keeps the mean value desired,
70
allowing zones with very low pressures due to the presence of vapour bubbles, avoiding the imposition of a rigorous
71
boundary condition at the orifice outlet that could affect the nature of the vapour structures formed within the nozzle.
72
With regard to the velocity, a non-slip condition has been applied at the orifice walls.
73
For validation purpose and subsequent study of the cavitation and turbulence interaction, four simulations have
74
been calculated fixing the injection pressure to 160 MPa and varying the backpressure to 3, 5, 7 and 9 MPa. Each
75
simulation has been run in parallel using 30 processes, needing 90 days to complete 100µs.
4. Validation of the code
77
Before studying in depth the cavitation and turbulence developed in the nozzle, it is necessary to check the potential
78
of the code for modeling the internal flow in diesel injector nozzles at cavitating conditions. This validation has been
79
performed in terms of mass flow, momentum flux and effective velocity, comparing the results provided by the code
80
against experimental data.
81
The experimental results of mass flow and momentum flux have been obtained with an Injection Rate Discharge
82
Curve Indicator (IRDCI) commercial system and a Momentum flux test rig [1] respectively. The injection rate meter,
83
based on Bosch method [10] provides a mass flow measurement with an uncertainty value of 1.5%, whereas the
84
Momentum flux test rig, which determines the impact force of a spray with a piezo-electric pressure sensor, allows
85
to measure with an uncertainty of around 1.8%. Combining both measurements, it is possible to determine another
86
useful parameter in the hydraulic characterization of a nozzle, the effective velocity at the outlet section.
87
Fig. 2 shows the comparison of both results for the mass flow (left), momentum flux (center) and effective velocity
88
(right). For all the pressure condition simulated, the mean value has been represented as a function of the root of
89
pressure drop, being the pressure drop the difference between the injection pressure (160 MPa) and the backpressure
90
(3, 5, 7 and 9 MPa). The time averaged corresponds to a period equal to 15 times the time needed by a fluid particle
91
to cover the whole orifice.
Figure 2: Comparison of experimental and numerical results. 92
As can be observed, for all the parameters and pressure conditions compared, CFD calculations slightly
overesti-93
mate the experimental results, following always the tendencies of the experimental data.
94
Attending to the mass flow injected by the nozzle, represented in the left plot, it can be seen that the mass flow is
95
collapsed in both cases, keeping constant for all the pressure conditions. This indicates that the flow is at cavitating
96
conditions [11, 12]. The deviation between experimental and computational values is around 10%. However, due to
97
the measurements uncertainties in the determination of the mass flow, momentum flux, and the internal geometry by
98
the silicone technique [13], and the complexity of modeling cavitating flows it can be considered that the code is able
99
to predict the behavior of the flow with enough degree of confidence.
100
Opposite to the mass flow behavior, the momentum flux represented in the plot placed in the middle of Fig. 2 is
101
not choked, so an increment of effective velocity is expected since it is calculated dividing the momentum flux values
102
by the mass flow. Effectively, as can be seen on the right of Fig. 2, the effective velocity experiments a linear increase
103
with the square root of pressure drop, reaching values of almost 600 m/s, with a deviation between experimental
104
and computational results for the velocity always lower than 5%. This velocity rise is justified by the fact that the
105
presence of vapour near the orifice wall due to cavitation phenomenon reduces the friction losses (slip condition) and
106
the effective diameter for the liquid phase [1].
107
5. Vapour phase distribution
108
Attending to the mass flow results seen in Fig. 2, it is expected to see vapour bubbles into the discharge orifices
109
for any pressure condition simulated, since the mass flow remains collapsed due to cavitation phenomenon.
110
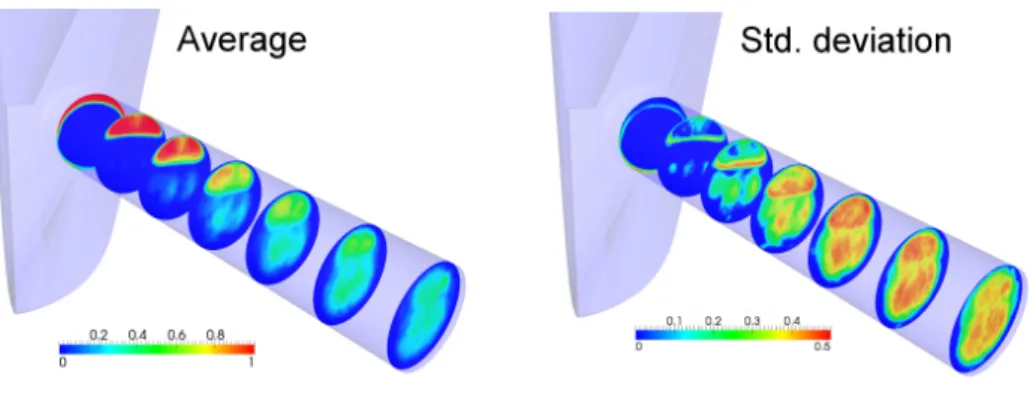
In order to asses it, Fig. 3 shows the vapour field averaged (where blue regions correspond to pure liquid and red
111
regions correspond to pure vapour) at seven cross section of the orifice and its standard deviation for the simulation
112
Pin j=160 MPa−Pback=5 MPa, averaging the same time used for the mass flow, momentum flux and velocity results.
113
As expected, the average field shows as the vapour bubbles are distributed along the upper part of the orifice, being
114
the origin of the vapour phase the inlet corner region of the channel. The vapour bubbles flow along the upper surface
115
of the orifice wall reaching the exit although it is possible to see vapour phase in the center and lower part of the orifice
116
near the outlet section. Furthermore, the standard deviation values indicate that cavitation is always present near the
117
orifice inlet, whereas cavitation appearance as the bubbles reach the exit varies time step to time step, showing that
118
cavitation is a transient phenomenon.
Figure 3: Vapour phase average and standard deviation. 119
The existence of vapour bubbles in the nozzle, similar to seen in the rest of backpressures simulated, confirms the
120
results previously obtained in section 4, where cavitation was detected when the mass flow remained constant in spite
121
of decreasing the backpressure.
122
6. Turbulence and vapour phase interaction
123
The reduced dimensions of a diesel nozzle, together with the high velocities found inside the discharge orifices for
124
real operating conditions of diesel engines ensure a turbulent flow regime. As a sample of the flow regime at pressure
125
conditions simulated in the present paper, for the casePin j=160 MPa−Pback=5 MPa, Reynolds number is around
126
9500.
127
Fig. 4 shows the streamlines colored by velocity, from the inlet boundary condition where injection pressure is
128
adjusted, to the outlet section of the orifice. The streamlines, which show the direction of a fluid particle at any point in
129
time, allow to observe the formation of eddies in the nozzle sac just before the hole. The zoomed picture makes easier
130
the visualization of these vortices developed, which has a strong influence on the cavitation distribution, especially
131
near the inlet orifice.
132
The influence of the turbulence on the cavitation appearance can be seen in Fig. 5, where vapour phase has been
133
depicted for several cross sections of the orifice. Vapour phase is clearly divided in two cores, which can be also
134
observed representing the velocity vectors in one of the cross sections chosen of the orifice. The direction of the
135
vectors shows a pair of twin vortices, one of them in the left part, and another one in the right part of the section. This
136
behavior, which has been observed by other authors [14], justifies the separation of the vapour phase in two regions.
137
Up to now, it has been proved that the turbulence developed inside a diesel injector nozzle has a strong influence on
138
the vapour phase appearance. Nevertheless, there is a certain interaction or interdependence between both phenomena,
139
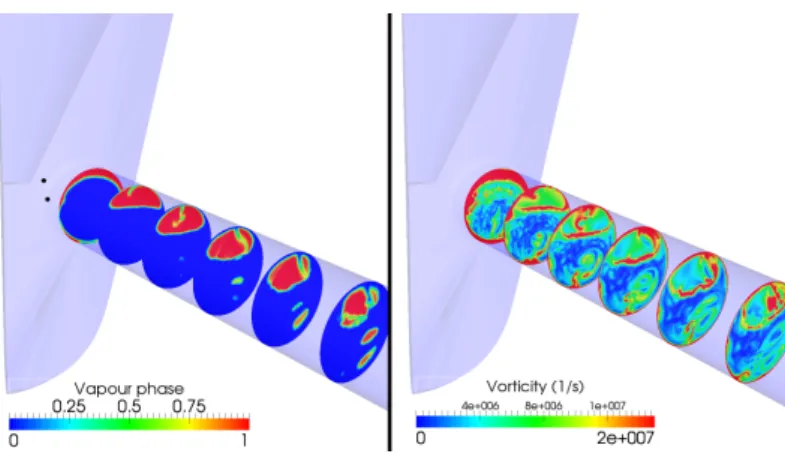
since cavitation also enhances turbulence [7, 15]. Indeed, if the vapour phase within the nozzle is compared with the
140
vorticity (see Fig. 6) it is possible to state that the highest values of turbulence is due to the presence of vapour
141
bubbles, reaching the maximum values in the interphase liquid-vapour region.
Figure 4: Streamlines for the simulation and zoomed area of the sac and orifice inlet.Pin j=160 MPa−Pback=5 MPa.
Figure 5: Vapour phase and velocity vectors for the simulationPin j=160 MPa−Pback=5 MPa.
Figure 6: Vapour phase distribution and vorticity (Pin j=160 MPa−Pback=5 MPa).
7. Conclusions
143
From the present investigation the following main conclusions can be drawn:
144
• A code to model cavitation phenomenon has been applied for the simulation of 3D cavitating flows by Large
145
Eddy Simulation.
146
• An extended validation of the code has been performed in terms of mass flow, momentum flux and effective
147
velocity in a diesel injector nozzle at real operating conditions, showing an acceptable level of confidence.
148
• Cavitation appearance is strongly influenced by the turbulence and vortices development, justifying the
separa-149
tion of the vapour phase in two cores in the zone near the orifice inlet.
150
• Cavitation enhances turbulence, since the highest values of vorticity in the nozzle are found at the interphase
151
liquid-vapour.
152
Acknowledgments
153
This work was partly sponsored by “Vicerrectorado de Investigaci´on, Desarrollo e Innovaci´on” of the “Universitat
154
Polit`ecnica de Valencia” in the frame of the project “Estudio num´erico de la cavitaci´on en toberas de inyecci´on Diesel
155
mediante Grid Computing (Cavigrid)”, reference No2597 and by “Ministerio de Ciencia e Innovacin” in the frame of
156
the project “Estudio te´orico-experimental sobre la influencia del tipo de combustible en los procesos de atomizaci´on
157
y evaporaci´on del chorro Diesel (PROFUEL)”, reference TRA2011–26293. This support is gratefully acknowledged
158
by the authors.
159
The authors would also like to thank the computer resources, technical expertise and assistance provided by the
160
Universidad de Valencia in the use of the supercomputer “Tirant”.
161 Nomenclature 162 a: speed of sound 163 D: diameter 164 p: pressure 165
Pback: back pressure 166
Pinj: injection pressure 167
psat: vaporisation pressure 168
t: time
⃗u: velocity 170 Greek symbols: 171 γ: vapour fraction 172
∆P: pressure drop,∆P=Pinj−Pback 173
µ: fluid viscosity
174
ρ: fluid density
175
ρl sat: liquid density at saturation 176
ρ0
l: liquid density at a given temperature condition 177
ρv sat: vapour density at saturation 178 τ: Sub-Grid Scale-Stress 179 Ψ: fluid compressibility 180 Subscripts: 181 l: liquid 182 v: vapour 183 References 184
[1] R. Payri, J. M. Garc´ıa, F. J. Salvador, J. Gimeno, Using spray momentum flux measurements to understand the influence of diesel nozzle 185
geometry on spray characteristics, Fuel 84 (2005) 551–561. 186
[2] H. K. Suh, C. S. Lee, Effect of cavitation in nozzle orifice on the diesel fuel atomization characteristics, International journal of heat and fluid 187
flow 29 (2008) 1001–1009. 188
[3] U. Piomelly, Large-eddy simulation: achievements and challenges, Progress in Aerospace Sciences 35 (4) (1999) 335–362. 189
[4] R. Payri, B. Tormos, J. Gimeno, G. Bracho, The potential of Large Eddy Simulation (LES) code for the modeling of flow in diesel injectors, 190
Mathematical and Computer modeling 52 (2010) 1151–1160. 191
[5] F. P. K¨arrholm, Numerical modelling of diesel spray injection, turbulence interaction and combustion, Ph.D. thesis, Chalmers University of 192
Technology (2008). 193
[6] R. Payri, B. Tormos, J. Gimeno, G. Bracho, Large Eddy Simulation for high pressure flows: Model extension for compressible liquids, 194
Mathematical and Computer modeling 54 (2011) 1725–1731. 195
[7] F. Payri, V. Berm´udez, R. Payri, F. J. Salvador, The influence of cavitation on the internal flow and the spray characteristics in diesel injection 196
nozzles, Fuel 83 (2004) 419–431. 197
[8] R. Payri, S. Molina, F. J. Salvador, J. Gimeno, A study of the relation between nozzle geometry, internal flow and spray characteristics in 198
diesel fuel injection systems, KSME International Journal 18 (7) (2004) 1225–1235. 199
[9] G. R. Tabor, M. H. Baba-Ahmadi, Inlet conditions for large eddy simulation: A review, Computer & Fluids 39 (2010) 553–567. 200
[10] M. Marcic, Measuring method for diesel multihole injection nozzles, Sensors and actuators 107 (2003) 152–158. 201
[11] C. Mishra, Y. Y. Peles, Size scale effects on cavitating flows through microorifices entrenched in rectangular microchannels, Journal of 202
microelectromechanical systems 14 (5) (2005) 987–999. 203
[12] F. J. Salvador, S. Hoyas, R. Novella, J. Mart´ınez-L´opez, Numerical simulation and extended validation of two-phase compressible flow 204
in diesel injector nozzle, Proceedings of the Institution of Mechanical Engineers, Part D, Journal of Automobile Engineering 225 (2011) 205
545–563. 206
[13] V. Maci´an, R. Berm´udez, V. Payri, J. Gimeno, New technique for the determination of the internal geometry of diesel nozzle with the use of 207
the silicone methodology, Experimental techniques 27 (2) (2003) 39–43. 208
[14] R. Masuda, T. Fuyuto, M. Nagaoka, Validation of a diesel fuel spray and mixture formation from nozzle internal flow calculation, SAE paper 209
2005–01–2098. 210
[15] J. M. Desantes, R. Payri, F. J. Salvador, J. De la Morena, Influence of cavitation phenomenon on primary break-up and spray behavior at 211
stationary conditions, Fuel 89 (2010) 3033–3041. 212