The 12th International Conference of
International Association for Computer Methods and Advances in Geomechanics (IACMAG)
1-6 October, 2008 Goa, India
Shear Viscosity of Clays to Compute Viscous Resistance
S. P. Mahajan
Geocomp Corporation, Boston, Massachusetts, USA
Muniram Budhu
University of Arizona, Tucson, Arizona, USA
KEYWORDS: clays; fall cone test; shear viscosity, critical state; cone penetrometer.
ABSTRACT: Soils at critical state are like a visco-plastic fluids, which will flow for applied stresses greater than the critical state (CS) shear strength. Shear viscosity is a key parameter to understand the post-failure flow response of soils in geotechnical applications such as landslides, jacked piles and cone penetrometers. Viscosity of soil has been investigated for water contents greater than the liquid limit because at these water contents standard viscometers can be used. However, soils can reach CS for water contents in the plastic range and thereafter exhibit viscous behavior without further changes in water contents. There is no standard method to determine shear viscosity of clays at water contents lower that the liquid limit. A new analytical method is proposed to determine the viscous drag (force) on the penetrating cone in a fall cone test. Based on this analysis, it is possible to interpret the shear viscosity of clays with water contents less than the liquid limit from a penetration test. Time-penetration data from a fall cone test was used to determine the shear viscosity of clays with liquidity index less than 1.5. The test results show that the shear viscosity decreases exponentially with an increase in liquidity index.
1 Introduction
There iscertain class of problems in geotechnical engineering in which the soil is subjected to large strains (beyond failure) and the flows. Such problems include landslides and flow of soft clays around penetrating rigid bodies such as the shaft surface of a jacked pile or a sleeve of a cone penetrometer.
When a rigid shaft penetrates a fine grained soil, the soil mass at and near the tip is subjected to high stresses and fails. Soil then flows around the shaft surface during continuous penetration (Mahajan and Budhu 2006). The relationship between the resistance of the continuous penetrating rigid body and the rate of penetration depends on the stress-strain (solid) relationship and the flow (viscous) properties of the soil (Marsland and Quarterman, 1982). The total shaft resistance is due to the static shear stress (interfacial solid friction) and viscous shear stress. Studies related to the dynamic penetration of plates, probes and cone penetrometers in clays (Turnage, 1973; Murff and Coyle, 1973; Berry, 1988) show that viscous resistance is an important component of the total resistance offered by the soil. The viscous drag force (
f
z) on a rigid body moving through a viscous fluid and exhibiting low Reynolds number creeping flow is given by an equation of the following form (Lamb, 1932; Ray, 1936; Happel and Brenner, 1965; Panton, 1984)z p z
f
=
C V
μ
(1)where
μ
p is the shear viscosity of the fluid,V
z is the velocity of the body and C is a constant, which is a function of the geometry of the body with respect to the flow field and the boundary conditions imposed. For an unbounded creeping flow past a sphere of radius, R,C
=
6
π
R
(Lamb, 1932).Mahajan and Budhu (2006) developed a similar analytical solution to determine the viscous drag on a shaft surface penetrating a clay. The solution was determined through a theoretical analysis based on viscous creeping flow of soil adjacent to the shaft. The analysis considered axial motion of a cylindrical shaft of radius,
r
0, penetrating at a constant speed Vz, in a semi-infinite soil mass which has an annulus of radius, Ro, that has reached critical state (CS zone) The developed solution for the viscous drag force (fv) per unit length of the shaft is0
2
v p zf
=
πμ
V
β
(2) where 4 2 0 0 0 0 2 2 0 0 0 0λ
- 4
λ
+ 4ln
λ
+ 3
β
=
(1 -
λ
) (1 -
⎡
⎣
λ
)(ln
λ
- 1) - 2ln
λ
⎤
⎦
in which 0 0 0R
r
λ
=
Equation (2) reveals that the soil’s viscosity, the rate of shaft penetration and the size of the critical state zone represented by
β
0orλ
0, are the key parameters controlling the viscous drag on the penetrating shaft. The termβ
0 quantifies the effects of size of the CS zone on the viscous drag. The expression for viscous drag on a penetrating shaft per unit length is similar to equation (1), whereC = 2
πβ
o. Shear viscosity of soil is required to determine the viscous drag on the penetrating shaft and understand post-failure behavior of soil.In soils, the viscous drag component is often neglected because it is believed to be small in comparison with the interfacial solid friction. However, if the soil’s viscosity is significant or the penetration velocity of the object is large, the viscous component (drag) could be significant. The key soil parameter for the analysis discussed in this paper is the shear viscosity for which there is no standard method for its determination except for soils at higher water contents (liquidity indices greater than 1.0). In the following, the shear viscosity of soil is discussed and the fall cone test is examined to determine its potential as a tool to estimate the shear viscosity at lower liquidity indices (LI<1.5).
2 Shear viscosity of clays for post-failure analysis
The shear viscosity (
μ
p) at critical state is the desired parameter For post-failure analysis of soils,. According to Edgers and Kalrsrud (1982), the shear viscosity of soil plays an important role in landslides. Torrance (1987) stated that it is of geotechnical importance to know the flow properties (yield stress and viscosity) of soil for the purpose of understanding the post-failure behaviour.Conventionally, viscometers have been used for measuring the yield strength (Vyalov, 1986; Torrance, 1987; Tan
et al., 1991; Fakher et al., 1999) and shear viscosity (e.g. Locat and Demers, 1988; Komamura and Huang, 1974)
of super soft clays with high water contents and very low shear strength. However, operational difficulties (Fakher
et al., 1999) limit the use of viscometer to clays with high liquidity index (LI >1.5). Critical state in a soil can be achieved at a liquidity index less than one. Unfortunately, the shear viscosity of soils at critical state cannot be determined using viscometers. In the following portion of this paper the fall cone (penetration) test (Hansbo, 1957; Houlsby, 1982; Koumoto and Houlsby, 2001) is explored to evaluate its potential to estimate the shear viscosity of clays at low liquidity indices. Low liquidity index in the context of this paper refers to liquidity index less than 1.5. In the next section, soil as a viscous fluid is briefly discussed to aid the interpretation of the fall cone test data.
3 Viscous fluid model for soil
When the applied stress in a visco-plastic fluid is less than a certain critical (fluid yield) stress, it deforms plastically like a solid with definite strain recovery upon the removal of stress. Applied stress exceeding the fluid yield stress will cause the fluid to flow. For simple shear flow, the constitutive equations for yield stress fluids are expressed as (Nguyen and Boger, 1992):
0
y(
no flow
)
γ
&
=
τ τ
<
(3a)y p y
τ τ
=
+
μ γ
&
τ τ
≥
(Bingham fluid) (3b) whereτ
is the total (dynamic) shear stress,γ
&
is the shear strain rate andτ
y is the yield stress. The critical state shear stress (τ
cs) is representative of the fluid yield stress (τ
y).The post-failure (flow) response of clays can be represented as illustrated in Figure 1. Plastic fluids similar to curve B (Figure 1), characterized by yield stress and slowly decreasing viscosity, can be represented by the shear stress-shear strain rate relationship for plastic flow proposed by Casson (1959) as
1 1 1
2 2 2
( )
τ
=
( )
τ
y+
(
μ γ
p&
) ;
for
τ τ
≥
y (4)This relationship (called Casson fluid) has been successfully applied to a diverse range of materials (Nguyen and Boger, 1992). Locat and Demers (1988) suggested that most sensitive clays behave as a Bingham or a Casson fluid and less sensitive clays can be better represented by a Casson fluid. Assuming Casson’s relationship is applicable to (less sensitive) clays at low liquidity index, then in order to determine the shear viscosity, the total shear stress, the yield shear stress and the shear strain rate need to be known.
Figure 1. Analogy of the post-failure response of a soil to a yield stress fluid response
4 Shear viscosity from the fall cone test
The fall cone test is used to determine the index properties (Wroth and Wood, 1978; Wood, 1982; Budhu, 1985; Zreik et al., 1995; Feng, 2000) and the undrained shear strength (Hansbo, 1957; Houlsby, 1982; Wood, 1985;
Shimobe, 2000; Koumoto and Houlsby, 2001) of fine-grained soils. Hansbo (1957) showed that the undrained shear strength is related to the final depth of penetration (
h
f) of the cone and can be expressed as2 cs f
KW
h
τ
=
(5)where
τ
cs (or su) is the (undrained) critical state shear strength, W is the weight of the cone and K (fall cone factor) is a constant. According to Hansbo (1957), soil’s resistance to the penetration of the cone depends on the static shearing resistance (interfacial friction) and viscous resistance. Theoretical and experimental work (Houlsby, 1982; Wood, 1985; Koumoto and Houlsby, 2001) showed that the cone factor (K) is influenced by the cone geometry, cone roughness, soil heave around the cone and dynamic effects.The shear resistance (stress) of the soil on the fall cone during motion is higher due to dynamic effects. To correct for higher (dynamic) shear stress and determine shear strength of soil (equation 5), Koumoto and Houlsby (2001) proposed a reduction factor,
λ
, to modify the fall cone factor (K). The factor,λ
=
0.74
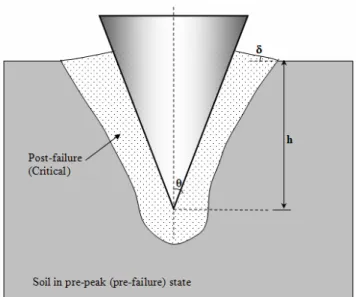
, was estimated by extending the publishedtriaxial test results to a higher level strain rate that approximates the strain rate occurring in the fall cone test.The fall cone test is a dynamic test. The shear resistance when the cone is in motion is a combination of the static shear resistance and the viscous shear resistance. The approach taken in this paper is to investigate the viscous shear resistance so that the shear viscosity can be estimated.When a fall cone penetrates the soil, the failed soil mass near the cone tip assumed as a yield stress fluid (Nguyen and Boger, 1992) flows around the cone as illustrated in Figure 2. The equation of motion of a cone at any penetration depth, h, in the soil is
2
ma mg F h
=
−
τ
(6)where m is the mass of cone, a is the acceleration of cone at depth, h, g is the acceleration due to gravity,
τ
is the dynamic (total) shearing resistance and F is the non-dimensional cone resistance factor (Houlsby, 82; Koumoto and Houlsby, 2001) given as2
tan ( )
chF
=
π
N
θ
(7)where
N
ch is the modified bearing capacity factor of the cone, which accounts for the heave around the cone, andθ
is the half cone angle. For a30
o (i.e.θ
=
15
o) semi rough cone, the value ofch
N
is 7.457 (Koumoto and Houlsby, 2001).Figure 2. Illustration of the soil state around a fall cone
When the motion (free fall) of the cone is initiated, its acceleration decreases from an initial value, g, as the cone penetrates soil. At a certain depth of penetration, heq, the acceleration of the cone decreases to zero. This depth will be referred to as the dynamic equilibrium position. The cone thereafter decelerates finally coming to rest at the final depth of penetration (hf). The dynamic equilibrium depth, heq, is less than the depth, hs, which would be required for static equilibrium (at rest condition) of the cone. From equation (6), the dynamic equilibrium condition (a = 0) is
2 eq
mg F h
=
τ
(8)from which, we get
2 2
eq eq
mg
W
Fh
Fh
τ
=
=
(9)The shear strength of a soil using the fall cone test can be computed by using the modified cone factor, K (Koumoto and Houlsby, 2001).
Assuming the viscous soil as a Casson fluid, we can express the term
μ γ
p&
(the viscous component of shear resistance) as 2 1 1 2 1 1 2 2 2 2 2 2 p cs eq fW
KW
Fh
h
μ γ
τ
τ
⎡
⎛
⎞
⎛
⎞
⎤
⎛
⎞
⎢
⎥
=
⎜
−
⎟
=
⎢
⎜
⎜
⎟
⎟
−
⎜
⎜
⎟
⎟
⎥
⎝
⎠
⎢
⎝
⎠
⎝
⎠
⎥
⎣
⎦
&
(10)The relationship among K, λ and F can be written as (Koumoto and Houlsby, 2001)
3
K
F
λ
=
(11)where K = 1.33 for a
30
osemi rough cone.Substituting equation (11) and
λ
=
0.74
in equation (10) and simplifying we get,2
0.67
1
p eq fKW
h
h
μ γ
=
⎛
⎜
⎜
−
⎞
⎟
⎟
⎝
⎠
&
(12)The dynamic equilibrium depth,
h
eq, can be obtained by measuring the cone motion (time-penetration data) and determining the penetration depth at which the acceleration is zero.The shear strain pattern around the cone is complex and difficult to determine accurately. Consequently, the shear strain rate during the fall cone motion, which varies with the depth of penetration, is difficult to measure. However, the average shear strain rate at the equilibrium depth can be estimated from the following expression (Koumoto and Houlsby, 2001) as
2
3
2.44
fg
h
δ
γ
&
=
(13)where
δ
the inclination angle (in radians) of the heaved soil surface (Figure 2) and is a function of the cone angle (2θ) and the cone roughness. For a30
osemi rough cone,δ
=
5.77
o (Koumoto and Houlsby, 2001). Substitutingin equation (13), the average shear strain rate for a
30
osemi-rough cone can be estimated as1
0.34
f
h
γ
&
=
(14)The shear viscosity of the soil at dynamic equilibrium from equations (12) and (14) is then
2
0.67
1
2.94
p f eq fKW h
h
h
μ
=
⎛
⎜
⎜
−
⎞
⎟
⎟
⎝
⎠
(15)5 Experiment
The procedure used for conducting the tests is similar to the conventional fall cone test (Hansbo, 1957; Wroth and Wood, 1978; Wood, 1982). A standard cone of apex angle, 30◦was used for the test. A calibrated LVDT was connected to the top of the cone shaft and a data acquisition system with logging frequency of 1 kHz was used to record the depth of penetration continuously with time.
Kaolin of liquid and plastic limits of 47% and 30% respectively was used for the test samples. Experiments were performed on soil samples with water contents in the range 35.8 % to65.7 %. The total mass of the cone assembly (cone, shaft) was 93 grams. For soil states near the plastic limit, additional masses of 50 grams and 150 grams were added at the cone base to increase the depth of penetration. A typical set of experimental results, fitted with a fifth order polynomial is shown in Figure 3. The velocity and acceleration found by differentiating this polynomial are shown in Figure 4. At the equilibrium depth, heq (point A), the velocity of the cone reaches its maximum value and the acceleration is zero. The potential energy, kinetic energy and the total energy as the cone penetrates the soil are shown in Figure 5. The total energy that is present at point A causes the cone to penetrate further into the soil until all the energy is dissipated in plastic deformation of soil. Pertinent data from the experiments are summarized in Table 1.
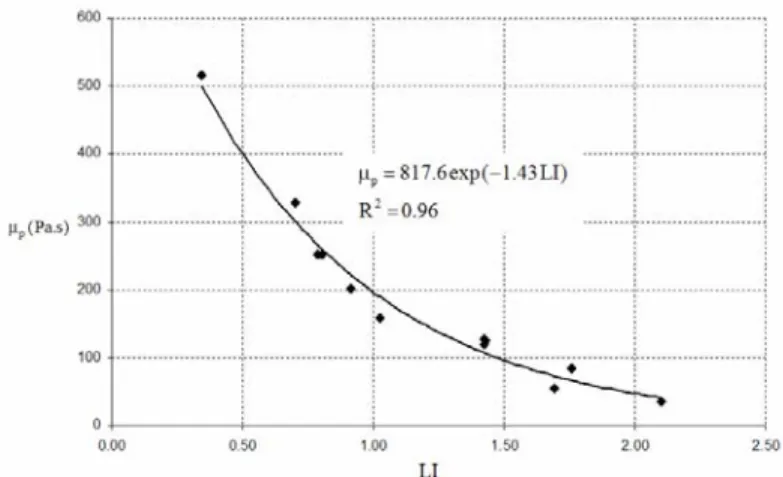
The shear viscosity (
μ
p) calculated using equation (15) for different values of liquidity index (LI) together withcs
τ
andτ
are summarized in Table 1. The relationship betweenμ
p(Pa.s) and LI for kaolin is depicted in Figure 6. The data can be fitted quite well (regression coefficient = 96%) by an exponential function expressed as817.6exp( 1.43
)
p
LI
μ
=
−
(16)Locat and Demers (1988) proposed a similar type of relationship from viscometer data for sensitive soft clays with high LI. One of the contributing factors to the accuracy of the calculated
μ
p is the accuracy of the value of K. Koumoto and Houlsby (2001) discussed some of the factors that affect the value of K and the differences between their theoretical value used here and those found by experiments that are within the range 0.7 to 1.2 for a 30o cone. The calculatedp
μ
is linearly related to the value of K.Figure 3. Penetration-time relationship of the cone (test 15C2)
(a) (b)
Figure 4. (a) Velocity and (b) acceleration of the cone (test 15C2)
Figure 6. Shear viscosity - liquidity index relationship for kaolin used in this study
6 Conclusions
The viscous drag on a shaft penetrating in a clay depends on the size of the CS zone around the shaft, the shear viscosity of the clay in this zone and the penetration velocity of the shaft. Shear viscosity is the key soil parameter to understand post-failure viscous behavior of soil.
The shear viscosity of a soil is required to compute viscous resistance on penetrating shafts in clays. The fall cone test is shown here to be a promising tool to estimate the shear viscosity of clays at low liquidity indices. For the kaolin tested, the shear viscosity decreases exponentially with LI. However, the estimate of the shear viscosity will be dependent on the rheological model used and the value of the cone factor, K. In this paper, Casson’s model was used and it is uncertain whether this model captures the viscous response of soils (in the plastic range) accurately despite suggestion in the literature of its potential appropriateness to clays.
Table 1. Test Data and Estimated shear strength and shear viscosity
Test
Water content
(%)
hf
(mm) heq (mm) LI
τ
cs (kPa)τ
(kPa)γ
&
(sec )
−1μ
(Pa.s)15C1* 35.84 9.07 5.00 0.34 38.49 57.19 3.57 516 15C2 41.93 13.77 7.46 0.70 16.71 25.64 2.90 328 15C3 43.40 17.88 9.57 0.79 9.91 15.60 2.54 253 15C4 45.51 19.44 10.51 0.91 8.39 12.93 2.44 200 15C5 43.63 18.18 9.70 0.80 9.59 15.18 2.52 253 15C6 47.43 24.55 13.13 1.03 5.26 8.29 2.17 158 5C1** 54.28 20.40 10.88 1.43 4.48 7.10 2.38 125 5C2 54.25 23.55 12.26 1.43 3.36 5.59 2.22 127 5C3 59.89 27.59 14.64 1.76 2.45 3.92 2.05 84 C1 54.25 21.23 10.79 1.43 2.69 4.70 2.34 119 C2 65.70 30.19 16.47 2.10 1.33 2.02 1.96 36 C3 58.77 18.81 10.52 1.69 3.43 4.94 2.48 55
*Tests 15C : Cone+ additional mass of 150 gm (total mass 243 gm) **Tests 5C : Cone+ additional mass of 50 gm (total mass 143 gm) ***Test C : Cone (total mass 93 gm)
7 References
Berry A. J. 1988. The dynamic penetration of clays. Proc. 1st International Symposium on Penetration Testing ISOPT I (2), Orlando (USA), A. A. Balkema, Rotterdam, 673-679.
91-95.
Casson W. 1959. A flow equation for pigment-oil suspensions of printing of the printing ink type. Rheology of Dispersed Systems, London Pergamon.
Edgers L. and Karlsrud K. 1985. Viscous analysis of submarine flows. Proc. 4th Int. Conf. on the Behaviour of Offshore Structures, Delft, Developments in Marine Technology, 2, 773-784.
Fakher A., Jones C.F.J.P. and Clarke B.G. 1999. Yield stress of super soft clays. J. Geotech. Geoenv. Engng. ASCE, 125 (6), 499-509.
Feng T.W. 2000. Fall-cone penetration and water content relationships of clays. Geotechnique, 2000, 50(2), 181-187.
Hansbo S. A. 1957. A new approach to the determination of the shear strength of clay by the fall-cone test. Proc. Royal Swedish Geotech. Inst., Stockholm, No. 14, 1-47.
Happel J. and Brenner H. 1965. Low Reynolds number hydrodynamics with special applications to particulate media. Prentice Hall Inc. Eaglewood cliffs, New Jersey (USA).
Houlsby G.T. 1982. Theoretical analysis of the fall cone test. Geotechnique, 32(2), 111-118.
Komamura F. and Huang R. J. 1974. A new rheological model for soil behavior. J. Geotech. Engng. Div. ASCE,100 (GT7), 807-824.
Koumoto T., Houlsby G.T. 2001. Theory and practice of the fall cone test. Geotechnique, 51(8), 701-712. Lamb H. 1932. Hydrodynamics. 6th edn, Cambridge University Press, England,.
Locat J. Demers D. 1988. Viscosity, yield stress, remolded strength, and liquidity index relationships for sensitive clays. Canadian Geotech. J., 25(4), 799-806.
Mahajan S. and Budhu M. 2006. Viscous effects on penetrating shafts in clays. Acta Geotechnica, 1(3), 157-165.
Marsland A. and Quarterman R.S.T. 1982. Factors affecting the measurements and interpretation of quasi static penetration tests in clays. Proc. 2nd European Symposium on Penetration Testing ESOPT II (2), A. A. Balkema, Amsterdam (The Netherlands), 697-702.
Murff J.D. and Coyle H.M. 1973. Low velocity penetration of kaolin clay. J. Geotech. Engng Div. ASCE, 99(SM 5), 375-389. Nguyen Q. D. and Boger D. V. 1992. Measuring the flow properties of yield stress fluids. Annual Review Fluid Mechanics, 24,
47-88.
Panton R.L. 1984. Incompressible flow. Wiley, New York (USA).
Ray M. 1936. Application of Bessel functions to the solution of problem of motion of circular disc in viscous liquid. Phil Mag., 21(Series 7), 546-564.
Shimobe S. 2000. Correlations among liquidity index, undrained shear strength and fall cone penetration of fine-grained soils. Coastal Geotech. Engng in Practice, Balkema, Rotterdam(The Netherlands), 141-146.
Tan T. S., Goh T. C., Karunaratne G. P., Inoue T. and Lee S. L. 1991. Yield stress measurement by a penetration method. Canadian Geotech. J., 28(4), 517-522.
Torrance J. K. 1987. Shear resistance of remoulded soils by viscometric and fall-cone methods: A comparison for Canadian sensitive marine clays. Canadian Geotech. J., 24(2), 318-322.
Turnage G. W. 1973. Influence of viscous-type and inertial forces on the penetration resistances of saturated fine-grained soils. J. of Terramechanics, 10(2), 63-76.
Vyalov S. S. 1986. Rhelogical fundamentals of soil mechanics. Developments in Geotechnical Engineering, 36, Elsevier, Amsterdam (The Netherlands).
Wood D.M. 1982. Cone penetrometer and liquid limit. Geotechnique, 32(1), 152-157. Wood D.M. 1985. Some fall-cone tests. Geotechnique, 35(1), 64-68.
Wroth C.P. and Wood D.M. 1978. The correlation of index properties with some basic engineering properties of soils. Canadian Geotech. J., 15(2), 137-145.
Zreik D. A., Ladd C.C. and Germaine J. T. 1995. A new fall cone device for measuring the undrained strength of very weak cohesive soils. Geotech. Testing J. ASTM, 18(4), 472-482.