COMPATIBILITY ANALYSIS REGARDING POSSIBLE SHARING
BETWEEN THE UIC SYSTEM AND RADIO MICROPHONES
IN THE FREQUENCY RANGES 876 - 880 MHz AND 921 - 925 MHz
Siófok, May 1998
European Radiocommunications Committee (ERC) within thein the frequency ranges 876 - 880 MHz and 921 - 925 MHz
1 INTRODUCTION... 1
2 SYSTEM PARAMETERS ... 1
2.1 UIC SYSTEM PARAMETERS... 1
2.2 SYSTEM PARAMETERS OF RADIO MICROPHONES... 2
3 INTERFERENCE SCENARIO: UIC SYSTEM INTERFERES WITH RADIO MICROPHONES... 2
3.1 WANTED FIELD STRENGTH FOR RADIO MICROPHONES... 2
3.2 PROPAGATION MODELS... 3
3.3 RESULTS OF THE COMPATIBILITY ANALYSIS... 4
3.3.1 Required decoupling attenuation ... ... 4
3.3.2 Required separation distances ... ... 4
3.4 INTERPRETATION OF THE RESULTS OF THE ANALYSIS... 4
3.4.1 Use of the UIC system ... 4
3.4.2 UIC mobile station interferes with radio microphones (scenarios 1.1 - 1.3 and 2.1 - 2.3. See Table 1) ... 5
3.4.2.1 Co-channel operation... 5
3.4.2.2 Operation on adjacent frequencies... 5
3.4.3 UIC base station interferes with radio microphones (scenarios 3.1 - 3.3 and 4.1 - 4.3. See Table 1)... 5
3.4.3.1 Co-channel operation... 5
3.4.3.2 Operation on adjacent channels ... 5
3.5 CONCLUSION... 5
4 INTERFERENCE SCENARIO: RADIO MICROPHONES INTERFERE WITH UIC SYSTEM ... 6
4.1 CALCULATIONS... 6
4.1.1 Scenario 1: A radio microphone interfering with a UIC base station receiving a signal from a distant mobile 6 4.1.2 Scenario 2: A radio microphone interfering with a UIC mobile station... 8
4.2 CONCLUSIONS... 8
4.3 REFERENCES... ... 8
ANNEX 1 PROPAGATION MODEL OF COST 231 PROJECT, WALFISH-IKEGAMI-MODEL ………...9
ANNEX 2 PROPAGATION MODEL OF ITU-R P. 529-2, HATA-MODEL 1980………....13
ANNEX 3 CALCULATION OF THE NECESSARY SEPARATION DISTANCE AND ATTENUATION BETWEEN UIC AND RADIO MICROPHONES ……….…………...……….15
Compatibility analysis regarding possible sharing
between the UIC system and radio microphones
in the frequency ranges 876 - 880 MHz and 921 - 925 MHz
Summary:
A study has been carried out which addresses the potential interference from the UIC system to radio microphone operation, and vice-versa.
The main results of the study are:
• the UIC systems would be likely to cause an unacceptable level of interference to radio microphone operation. The separation distances needed extend to several kilometres, which combined with the UIC requirement for coverage up to 10 km from railway tracks, would leave little possibility for sharing based on geographic separation in most European countries;
• radio microphones would be likely to cause interference to UIC base stations at a distance of up to 5 km. Again taking account of the proposed coverage of the systems, there is little possibility for sharing based on geographic separation in most European countries.
1 INTRODUCTION
The purpose of this study is to investigate the possibility of sharing between the UIC System and professional radio microphones in the UIC bands 876 - 880 MHz and 921 - 925 MHz.
The UIC system is a radio system, based on the GSM standards, intended mainly for train control purposes and for the exchange of voice messages overriding train signalling information. However it will also be used for road based applications such as maintenance and buses.
The radio microphones considered in this study are professional applications. Therefore the stringent requirements for broadcast quality are taken into account. Radio microphones are assumed to be operated mainly indoors, although outdoor use is not prohibited.
Section 3 of this document considers radio microphones interfered with by the UIC system, whilst section 4 considers the UIC system interfered with by radio microphones.
2 SYSTEM PARAMETERS
2.1 UIC system parameters 876 - 880 MHz
Operation: Mobile (train/car/hand-held) transmittters Base station receives
Mobile Station:
Transmit power MS: 39 dBm (train/car) 30 dBm (hand-held)
Antenna gain: 2 dBi (train/car); 0 dBi (hand-held) Radiation: omnidirectional
Antenna height: Mounted on train roof: 4 m above rail level (see Note) 1.5 m (car/hand-held) Bandwidth: 200 kHz Base station: Receiver sensitivity: - 104 dBm C/I value: 9 dB 921 - 925 MHz
Operation: Base station transmitters
Mobile (train/car/hand-held) receives
Base station:
Transmit power BS: typically 39 dBm max. 45 dBm
Antenna gain: 16 dBi
Radiation: omnidirectional/directional Antenna height: 20 - 30 m (typically 30 m)
Bandwidth: 200 kHz
Mobile Station:
Receiver sensitivity: - 102 dBm
C/I value: 9 dB
Note: The height of the mobile antenna above ground may change greatly from one location to the other because trains in large cities can be conveyed in different ways: elevated stations, bridges or underground.
2.2 System parameters of radio microphones Transmitter output power hand-held: 10 dBm Transmitter output power body worn: 17 dBm
Transmitter spectrum mask: in acc. with ETS 300 422
Bandwidth (- 60 dB): analogue as in ETS 300 422 (max. 200 kHz) digital approx. 300 kHz
Receiver input power: analogue - 68 dBm/68 dB(µV/m) (in acc. with Chester) digital - 85 dBm/51 dB(µV/m); (see section 3.1) C/I ratio: analogue: 27 dB (acc. to manufacturer specifications)
digital: 18 dB (acc. to manufacturer specifications) Max. interfering field strength: analogue: 41 dB(µV/m)
digital: 33 dB(µV/m) Receiver spectrum mask: see Annex 4
Operating modes: indoor and outdoor
Channel selection: no dynamic channel selection, frequency tuning possible throughout the frequency range
3 INTERFERENCE SCENARIO: UIC SYSTEM INTERFERES WITH RADIO MICROPHONES
3.1 Wanted field strength for radio microphones
In this compatibility analysis three radio microphone scenarios are examined:
1 Use of analogue microphones (operation with minimum wanted field strength)
Minimum wanted field strength 68 dB(µV/m); C/I = 27 dB; coverage radius approx. 150 m => maximum interfering field strength 41 dB(µV/m)
2 Use of digital microphones (operation with minimum wanted field strength)
Minimum wanted field strength 51 dB(µV/m); C/I = 18 dB; coverage radius approx. 1 km => maximum interfering field strength 33 dB(µV/m)
3 Use of digital microphones (coverage radius = 150 m) Minimum wanted field strength 68 dB(µV/m); C/I = 18 dB => maximum interfering field strength 50 dB(µV/m)
For the above calculation of the coverage radius a bodyloss of 14 dB for bodyworn and 6 dB for handheld equipment was used. Furthermore an antenna gain of 0 dBd (2 dBi) for the microphone transmitter was taken into account. These parameters are assumed to reflect the practical coverage scenarios.
The minimum wanted field strength for a digital receiver with a sensitivity of - 103 dBm (33 dB(µV/m)) and a required C/I of 18 dB was assumed to be 51 dB(µV/m). In view of the transmitter powers now specified for hand-held and body worn devices a coverage radius of approximately 1 km would be possible. In this case the maximum permissible interfering field strength would be 33 dB(µV/m). However, if the same receiver is assumed but the coverage radius is reduced to 150 m the wanted field strength is 68 dB(µV/m) and the permissible interfering field strength is 50 dB(µV/m).
3.2 Propagation models
The compatibility analysis was based on different propagation models: Frequency range (876 - 880 MHz)
COST 231, Walfish-Ikegami, for medium-sized town and suburban areas (see Annex 1) Frequency range (921 - 925 MHz)
• Free space propagation to determine worst case conditions (max. radio horizon) Equation: Lfree_space = 32.5 + 20log(d) + 20log(f)
• HATA model (suburban area) for distances ≥ 1 km Equation:
a hr h r f, 3.2 log. 11.75 h r. 2 4.97
L Hata h t h r f d, , , 69.55 26.16 log( ). f 13.82 log h t. a hr h r f, 44.9 6.55 log h t log( ). . d • Rough approximation of the propagation loss at distances between 100 m and 1 km
(interpolation of free space propagation on the Hata model) Equation:
(
)
( )L
interpolateh h f
t, r, ,dL
h h f
L
Hata t, r, ,l free_ space l d f = − + , . log . log . . 0 1 0 1 0 1 71 704
(This “model“ has not been verified. It was selected because no other suitable model is available at present for distances of less than 1 km.)
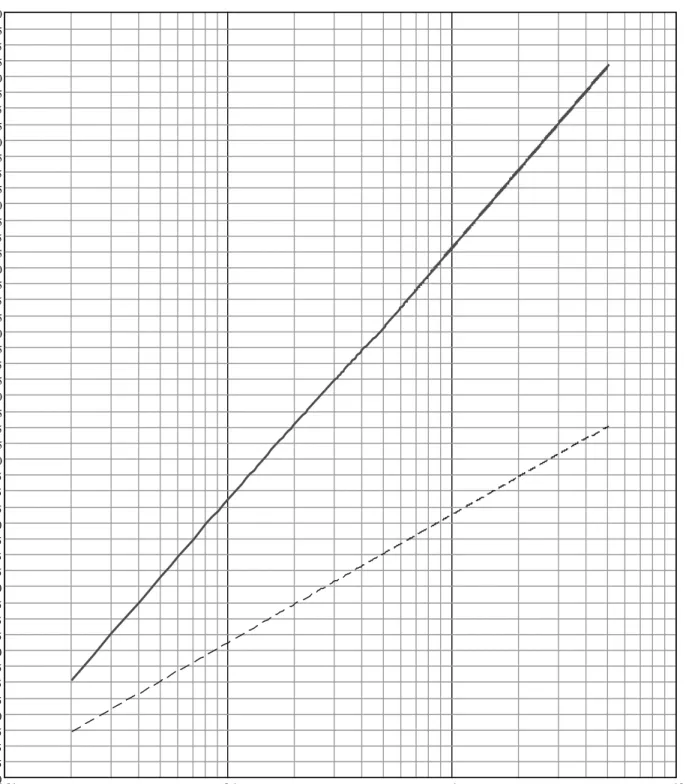
A graphical representation of the entire “model“ is given in Annex 2. Legend:
d: distance in km ht: transmitting antenna height in m
f: frequency in MHz hr: receiving antenna height in m
3.3 Results of the compatibility analysis
3.3.1 Required decoupling attenuation
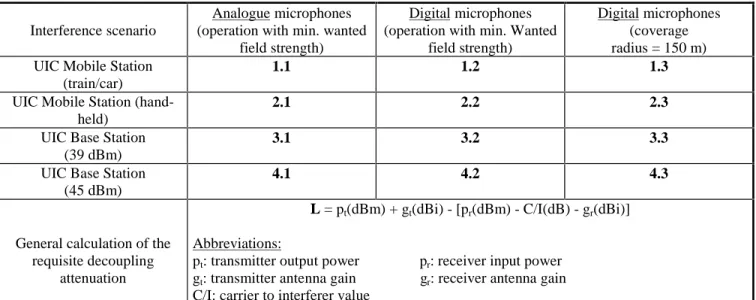
The following tables contain all the interference situations studied in the analysis, together with their scenario numbers. The analysis covered both co-channel operation and adjacent frequencies. The calculations for co-channel operation were based on the information given in Table 1. The analysis of adjacent frequencies was based on the software programme “Mathcad“. The results are set out in Annex 3 (Table 2).
Interference scenario
Analogue microphones (operation with min. wanted
field strength)
Digital microphones (operation with min. Wanted
field strength)
Digital microphones (coverage radius = 150 m) UIC Mobile Station
(train/car)
1.1 1.2 1.3
UIC Mobile Station (hand-held)
2.1 2.2 2.3
UIC Base Station (39 dBm)
3.1 3.2 3.3
UIC Base Station (45 dBm)
4.1 4.2 4.3
General calculation of the requisite decoupling
attenuation
L = pt(dBm) + gt(dBi) - [pr(dBm) - C/I(dB) - gr(dBi)] Abbreviations:
pt: transmitter output power pr: receiver input power gt: transmitter antenna gain gr: receiver antenna gain C/I: carrier to interferer value
Table 1: interference scenarious
3.3.2 Required separation distances
The propagation models described in 3.2 were used to determine the relevant separation distances. The results for the various interference scenarios are shown in Annex 3 both in tabular (Table 1) and graphic form (Figs 1 to 4). The propagation model used in each case is indicated.
NB
The results for the operation of radio microphones on adjacent frequencies are based on the receiver spectrum mask in Annex 4. However, this mask was originally developed for initial assessments of the interference situation in the frequency range 1785 - 1800 MHz and may change considerably owing to future developments in radio microphone technology.
3.4 Interpretation of the results of the analysis
3.4.1 Use of the UIC system
The UIC system is intended to enable the railway operators to implement mobile communications. Mobile communications will not be restricted to the trains but will extend to service vehicles, staff and other facilities. Coverage will therefore not be restricted to railway tracks but extend to adjacent areas as well. This means that a distance of about 10 km on either side of the tracks should be covered. Dense urban areas will even be fully served by a cellular network. For these reasons the compatibility analysis was not simply limited to railway tracks. In some countries coverage may be extended to buses with an even wider range of operation.
3.4.2 UIC mobile station interferes with radio microphones (scenarios 1.1 - 1.3 and 2.1 - 2.3. See Table 1)
3.4.2.1 Co-channel operation
The results show that radio microphones are interfered with by mobile UIC stations located in trains. It is therefore not possible to operate a radio microphone in an area extending to approximately 750 m on either side of the tracks. In the range between roughly 750 m and 1.9 km the use of microphones depends on their type of modulation and coverage range. Both factors affect the maximum permissible interfering field strength. In areas with few buildings the necessary separation distances may increase considerably, extending up to the radio horizon (max. approx. 7 km).
The parameters of UIC transmitters installed in service vehicles are the same as to those of stations in trains. For this reason the results for stations in trains also apply to service vehicles.
Lower values are assumed for the power emitted by hand-held devices. The maximum transmitter power of such a device is about 30 dBm with an antenna gain of 0 dBi. For hand-held devices separation distances ranging from about 400 m to about 1 km have been determined.
In view of the dense railway network in Europe and taking a service range of roughly 10 km on either side of the tracks and taking the establishment of cellular networks in urban areas into account considerable interference to radio microphones is inevitable. In rural areas the railway network may be less dense but the propagation conditions in relation to the interference situation are less favourable. All calculations are based on outdoor use of radio microphones.
3.4.2.2 Operation on adjacent frequencies
The results in Annex 3 (Figs 1 and 2) clearly show that a frequency separation of about at least ± 600 kHz is necessary. However, in spite of such frequency separations, separation distances of about 60 m are also necessary. Here again, all calculations are based on outdoor use of radio microphones.
3.4.3 UIC base station interferes with radio microphones (scenarios 3.1 - 3.3 and 4.1 - 4.3. See Table 1)
3.4.3.1 Co-channel operation
If UIC usage as described in 3.4.1 is assumed a high number of base stations will be established, especially in urban areas. Since the separation distances (see Annex 3, Figs 3 and 4) extend to several kilometers (roughly 2.5 - 12 km) the use of radio microphones in this frequency range is also not possible. Isolation between the antennas of UIC base stations and radio microphones along tracks is not feasible owing to the envisaged service range of about 10 km on each side of the tracks. In rural areas the railway network may be less dense but the propagation conditions in relation to the interference situation are less favorable. All calculations are based on outdoor use of radio microphones.
3.4.3.2 Operation on adjacent channels
Here again, the results in Annex 3 (Figs 3 and 4) clearly show that a frequency separation of about ± 600 kHz is necessary if distances of less than 400 m are to be achieved. But these distances are not always feasible, especially in urban areas. Furthermore, a frequency separation of about ± 600 kHz implies a considerable restriction on the remaining frequency spectrum since UIC base stations use several channels. All calculations are based on outdoor use of radio microphones.
3.5 Conclusion
The results of the analysis of the frequency ranges 876 - 880 MHz and 921 - 925 MHz illustrate that - seen from the viewpoint of radio microphones - co-channel operation with the UIC is not possible. A frequency separation of about ± 600 kHz is necessary. However, even with such a frequency separation interference cannot be ruled out altogether. The two frequency ranges should therefore not be used on a sharing basis.
4 INTERFERENCE SCENARIO: RADIO MICROPHONES INTERFERE WITH UIC SYSTEM 4.1 Calculations
Two scenarios are identified at 876 - 880 MHz
Scenario 1: A radio microphone interfering with an UIC base station receiving a signal from a distant mobile. Scenario 2: A radio microphone interfering with an UIC mobile station.
The procedure used for the calculations is to determine the Minimum Coupling Loss (MCL) in each case (scenario). This MCL is converted to a “required interference distance“ by using an appropriate path-loss model. For this interference consideration a bodyloss value of 6 dB is used and 1 dBi for the microphone transmitter antenna gain.
The following path-loss model is considered in this study: È Okumura - Hata model [Ref.1-3]
Path Loss[dB] = A+ B * log d[km] where:
A = 69.55 + 26.16 * log f[MHz] - 13.82 * log hB[m] - a (hm) B = 44.9 - 6.55 * log hB[m]
where: hB and hm are antenna heights of base station and mobile respectively d is the distance from the transmitter
f = 878 MHz
a (hm) is a correction factor for the mobile antenna’s height a (hm) = 8.29 * [log (1,54* hm [m] )] 2 - 1.1; for a large city For the sake of comparison, the Free Space path loss is also considered:
Path Loss[dB] = 32.44 + 20 * log f[MHz] + 20 * log d[km]
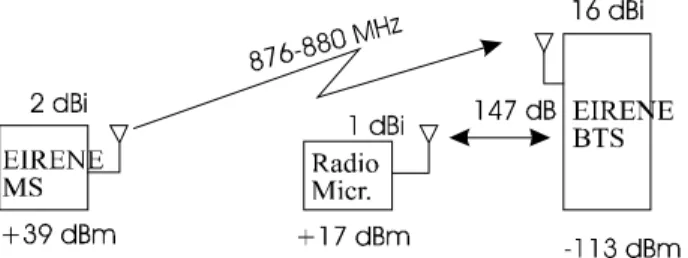
4.1.1 Scenario 1: A radio microphone interfering with a UIC base station receiving a signal from a distant mobile
Figure 1: interference from radio microphone into base station The interference limit for the base station (BTS) is:
IL = Sensitivity - C/I = -104 - 9 = -113 dBm The minimum coupling loss to protect the BTS is then:
MCL = PTX + GTX + GRX - I.L
= 17 + 1 + 16 + 113 = 147 dB This MCL corresponds to an interference distance of:
5.1 km in the Okumura model.
600 km in the Free space model. (The practical result is the radio horizon).
The introduction of bodyloss (BL) into the radiomicrophone transmit path reduces the minimum coupling loss to protect the BTS which is then:
MCL = PTX + GTX + GRX - I.L-BL
= 17 + 1 + 16 + 113 - 6 = 141 dB This MCL corresponds to an interference distance of:
3.445 km in the Okumura model.
305 km in the Free space model. (The practical result is the radio horizon).
Changing the radio microphone antenna height from 0.5 to 8 m varies the interference distance from 2.5 to 4.7 km.
The introduction of a building wall loss (WL) into the radiomicrophone transmit path reduces the minimum coupling loss to protect the BTS which is then:
MCL = PTX + GTX + GRX - I.L-WL = 17 + 1 + 16 + 113 - 8 = 139 dB This MCL corresponds to an interference distance of:
3.023 km in the Okumura model.
242 km in the Free space model. (The practical result is the radio horizon).
Changing the radio microphone antenna height from 0.5 to 8 m varies the interference distance from 2.2 to 4.1 km.
The introduction of bodyloss (BL) and building wall loss (WL) into the radiomicrophone transmit path reduces the minimum coupling loss to protect the BTS which is then:
MCL = PTX + GTX + GRX - I.L-BL-WL = 17 + 1 + 16 + 113 - 6 - 8 = 133 dB This MCL corresponds to an interference distance of:
2.042 km in the Okumura model.
121.5 km in the Free space model. (The practical result is the radio horizon).
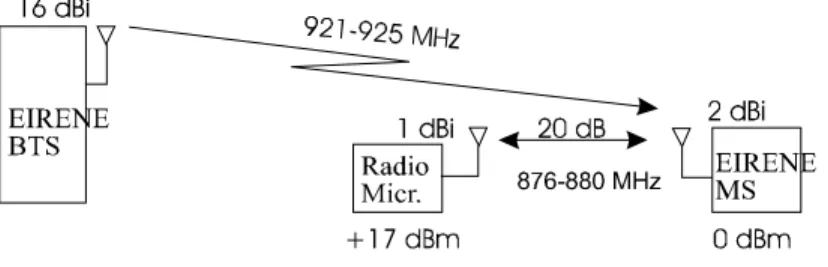
4.1.2 Scenario 2: A radio microphone interfering with a UIC mobile station
Figure 2: interference from radio microphone into mobile
The mechanism considered here is blocking, since the interferer is outside the victim’s frequency band.
Requirements for the mobile station (MS) arise from ETS 300 577 (GSM 05.05): out of band blocking of MS = 0 dBm. The minimum coupling loss to protect the MS is then:
MCL = PTX + GTX + GRX - Blocking-level = 17 + 1 + 2 - 0 = 20 dB This MCL corresponds to an interference distance of:
0.3 m in the Free space model.
Because this distance is small the introduction of body and building wall losses are not considered.
4.2 Conclusions
Calculations show that a risk of interference exists. The computed interference distances are between 2 and 5 km depending on the allowances made for use of the radio microphone inside buildings and for body worn use.
The changing height of the radio microphone antenna above ground has also been taken into account. With a reduction to 0.5 m in its antenna height in the calculations, the minimum interference distance in the case where bodyworn and in-building losses have been taken into account is still 1.5 km.
4.3 References
[1] Okumura, Y. et al.; Field strength and its variability in VHF and UHF land mobile radio service; Rev. Elec. Comm. Lab.; NTT, Vol.16; 1968.
[2] Hata M.; Empirical Formula for Propagation Loss in Land Mobile Radio Services; IEEE Trans. on Vehic. Technology; Vol.VT29, 1980.
ANNEX 1
Propagation model of COST 231 Project, Walfish-Ikegami-Model
Validity Range: 800 ... 2000 MHz
0.02 ... 5 km for non line-of-sight (NLOS), 0.02 ... 0.2 km for line-of-sight (LOS). Base station antenna height 4 ... 50 m.
Mobile antenna height 1 ... 3 m. Path Loss for Line of Sight
L S(f d, ) 42.6 26 log( ). d 20 log( ). f f: Frequency in MHz
d: Distance transmitter-receiver in km Path Loss for Non Line of Sight LNS = L0 + Lrts + Lmsd With free space loss
L 0h Base h Mobile f d, , , 32.4 20 log( ). f 20 log( ). d street-orientation-loss L ori( )ϕ 10 0.354.ϕ if 0 ϕ 35 if 2.5 0.075 (. ϕ 35) 35 ϕ 55 otherwise 4.0 0.114 (. ϕ 55)
"roof-to-street diffraction and scatter loss"
L rts h Base h Mobile h Roof f d w, , , , , ,ϕ 16.9 10 log( ). w 10 log( ). f 20 log h Roof h Mobile. L ori( )ϕ L bsh h Base h Roof, 18 log 1. h Base h Roof if h Base h Roof>
otherwise 0
k a1 h Base h Mobile h Roof d, , , 54 0.8 h Base h Mobile. if d 0.5 otherwise 54 0.8 h Base h Mobile. . d
0.5
k a h Base h Mobile h Roof d, , , k a1 h Base h Mobile h Roof d, , , if h Base h Roof otherwise
54 k d h Base h Roof, 18 if h Base h Roof>
otherwise 18 15.h Base h Roof
for medium size cities and suburban centres with moderate tree density
k f1( )f 4 0.7. f
925 1
L msd1 h Base h Mobile h Roof f d b, , , , , L bsh h Base h Roof, k a h Base h Mobile h Roof d, , , k d h Base h Roof log( ), . d k f1( )f log( ). f 9 log( ). b the pass loss is
L b1 h Base h Mobile h Roof f d b w, , , , , , ,ϕ L 0 h Base h Mobile f d, , , if L rts h Base h Mobile h Roof f d w, , , , , ,ϕ L msd1 h Base h Mobile h Roof f d b 0, , , , , otherwise L 0 h Base h Mobile f d, , , L rts h Base h Mobile h Roof f d w, , , , , ,ϕ L msd1 h Base h Mobile h Roof f d b, , , , ,
for metropolitan centres
k f2( )f 4 1.5. f
925 1
L msd2 h Base h Mobile h Roof f d b, , , , , L bsh h Base h Roof, k a h Base h Mobile h Roof d, , , k d h Base h Roof log( ), . d k f2( )f log( ). f 9 log( ). b the pass loss is
L b2 h Base h Mobile h Roof f d b w, , , , , , ,ϕ L 0 h Base h Mobile f d, , , if L rts h Base h Mobile h Roof f d w, , , , , ,ϕ L msd2 h Base h Mobile h Roof f d b 0, , , , , otherwise L 0 h Base h Mobile f d, , , L rts h Base h Mobile h Roof f d w, , , , , ,ϕ L msd2 h Base h Mobile h Roof f d b, , , , ,
hBase: Height of base station antenna in m
hMobile: Height of Mobile station antenna in m
hRoof: Height of buildings in m
f: Frequency in MHz
d: Distance transmitter-receiver in km
b: Building separation in m
w: Width of street in m
ϕ: Angle between the street and the electromagnetic wave (ϕ=0, if street and incident wave are parallel)
parameters:
d 0.02 0.025 5 km , .. (from 20 to 5000 m in steps of 25 m ) h Base 4
m h Mobile 1.5 m h Roof 5 m
f 877 MHz b 20 m w b
Figure 1: RADIO MICROPHONE INTERFERED WITH BY UIC MOBILE - STATION 0.01 0.1 1 10 50 52.5 55 57.5 60 62.5 65 67.5 70 72.5 75 77.5 80 82.5 85 87.5 90 92.5 95 97.5 100 102.5 105 107.5 110 112.5 115 117.5 120 122.5 125 127.5 130 132.5 135 137.5 140 142.5 145 147.5 150 152.5 155 157.5 160 162.5 165 167.5 170
Walfish-Ikegami-Model (medium cities and suburban centres) free space propagation
distance in km
pa
ANNEX 2
Propagation model of ITU-R P. 529-2, Hata-Model 1980 Validity Range:
150 ... 2000 MHz 1 ... 20 km
transmitter station antenna height 30 ... 200 m receiver antenna height 1 ... 10 m
urban area
a hr h r f, (1.1 log( ). f 0.7 h r (). 1.56 log( ). f 0.8)
L Hata h t h r f d, , , 69.55 26.16 log( ). f 13.82 log h t. a hr h r f, 44.9 6.55 log h t log( ). . d
The free space loss is
L free_space (f d, ) 32.4 20 log( ). f 20 log( ). d The function of interpolation between 100 m and 1 km is
L interpolate h t h r f d, , , L Hata . , , , h t h r f 1 L free_space (f 0.1, ) log 1 0.1 log d 0.1 71.704
The function of interpolation between 100 m and 20 km is
z 1 h t h r f d, , , wenn d 1 L Hata> , h t h r f d L interpolate, , , , h t h r f d, , , Hata interpolate h t h r f d, , , wenn d 0.1 L free_space (< , f d, ),z 1 h t h r f d, , , ht: Height of transmitter station antenna in m
hr: Height of receiver station antenna in m f: Frequency in MHz d: Distance transmitter-receiver in km parameters: d 0.1 0.105 20 , .. km(from 0.1 km to 20 km in steps of 5 m ) h t 30 m h r 1.5 m f 923 MHz
Figure 1: RADIO MICROPHONE INTERFERED WITH BY UIC BASE - STATION 0.1 1 10 100 60 65 70 75 80 85 90 95 100 105 110 115 120 125 130 135 140 145 150 155 160 165 170 175 180
HATA - model (urban area); interpolate free space propagation
distance in km
pa
ANNEX 3
CALCULATION OF THE NECESSARY SEPARATION DISTANCE AND ATTENUATION BETWEEN UIC AND RADIO MICROPHONES
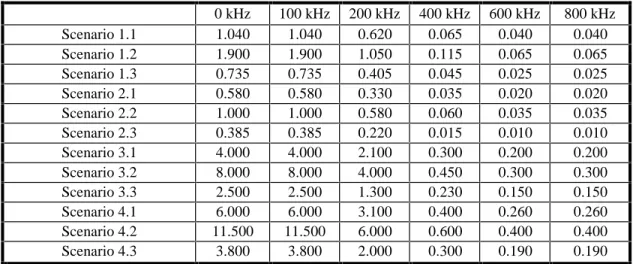
0 kHz 100 kHz 200 kHz 400 kHz 600 kHz 800 kHz Scenario 1.1 1.040 1.040 0.620 0.065 0.040 0.040 Scenario 1.2 1.900 1.900 1.050 0.115 0.065 0.065 Scenario 1.3 0.735 0.735 0.405 0.045 0.025 0.025 Scenario 2.1 0.580 0.580 0.330 0.035 0.020 0.020 Scenario 2.2 1.000 1.000 0.580 0.060 0.035 0.035 Scenario 2.3 0.385 0.385 0.220 0.015 0.010 0.010 Scenario 3.1 4.000 4.000 2.100 0.300 0.200 0.200 Scenario 3.2 8.000 8.000 4.000 0.450 0.300 0.300 Scenario 3.3 2.500 2.500 1.300 0.230 0.150 0.150 Scenario 4.1 6.000 6.000 3.100 0.400 0.260 0.260 Scenario 4.2 11.500 11.500 6.000 0.600 0.400 0.400 Scenario 4.3 3.800 3.800 2.000 0.300 0.190 0.190
Table 1: Separation distance in km
0 kHz 100 kHz 200 kHz 400 kHz 600 kHz 800 kHz scenario 1.1 134.000 134.000 124.000 84.000 74.000 74.000 scenario 1.2 144.000 144.000 134.000 94.000 84.000 84.000 scenario 1.3 127.000 127.000 117.000 77.000 67.000 67.000 scenario 2.1 123.000 123.000 113.000 73.000 63.000 63.000 scenario 2.2 133.000 133.000 123.000 83.000 73.000 73.000 scenario 2.3 116.000 116.000 106.000 66.000 56.000 56.000 scenario 3.1 148.000 148.000 138.000 98.000 88.000 88.000 scenario 3.2 158.000 158.000 148.000 108.000 98.000 98.000 scenario 3.3 141.000 141.000 131.000 91.000 81.000 81.000 scenario 4.1 154.000 154.000 144.000 104.000 94.000 94.000 scenario 4.2 164.000 164.000 154.000 114.000 104.000 104.000 scenario 4.3 147.000 147.000 137.000 97.000 87.000 87.000 Table 2: Attenuation in dB
Figure 1: Assessment of the necessary separation distance between
UIC mobile - train/car - station ( 39 dBm ) and radio microphones
0.010 0.100 1.000 10.000
0 kHz 100 kHz 200 kHz 400 kHz 600 kHz 800 kHz
frequency separation related to centre frequency of UIC system
separat ion dist ance in km scenario 1.1 scenario 1.2 scenario 1.3 Propagation model: Walfish-Ikegami
Figure 2: Assessment of the necessary separation distance between
UIC mobile - handheld - station ( 30 dBm ) and radio microphones
0.010 0.100 1.000 10.000
0 kHz 100 kHz 200 kHz 400 kHz 600 kHz 800 kHz
frequency separation related to centre frequency of UIC system
separat ion dist ance in km scenario 2.1 scenario 2.2 scenario 2.3 Propagation model: Walfish-Ikegami
Figure 3: Assessment of the necessary separation distance between
UIC base station ( 39 dBm ) and radio microphones
0.100 1.000 10.000
0 kHz 100 kHz 200 kHz 400 kHz 600 kHz 800 kHz
frequency separation related to centre frequency of UIC system
separat ion dist ance in km scenario 3.1 scenario 3.2 scenario 3.3 Propagation model:
Figure 4: Assessment of the necessary separation distance between
UIC base station ( 45 dBm ) and radio microphones
0.100 1.000 10.000 100.000
0 kHz 100 kHz 200 kHz 400 kHz 600 kHz 800 kHz
frequency separation related to centre frequency of UIC system
separat ion dist ance in km scenario 4.1 scenario 4.2 scenario 4.3 Propagation model:
800 700 600 500 400 300 200 100 0 100 200 300 400 500 600 700 800 0 2 4 6 8 10 12 14 16 18 20 22 24 26 28 30 32 34 36 38 40 42 44 46 48 50 52 54 56 58 60 62 64 66 68 70 72 74 76 78 80
Frequency offset from centre freq. (kHz)
Le ve l r ela tive to wa nte d signa l ( d B c)