A Maturity Model for Management Control Systems
Five Evolutionary Steps to Guide Development
The ‘right’ configuration of Management Control Systems (MCSs) is still challenging.
Aligning reporting, planning, and consolidation from a functional, organizational, and IT
perspective needs systematic guidance. The empirically grounded MCS maturity model
guides such a development by outlining an evolution from a basic,
mandatory/external-driven MCS (level 1), to a balanced MCS (level 2), and a comprehensive
MCS (level 3). Ultimately, MCSs show a strong strategic focus (level 4) and leverage the
potentials of modern IT (level 5).
DOI 10.1007/s12599-012-0220-x
The Authors
Dr. Frederik Marx Dr. Felix Wortmann (
) Dr. Jörg H. MayerInstitute of Information Management University of St. Gallen Müller-Friedberg-Strasse 8 9000 St. Gallen Switzerland [email protected] [email protected] [email protected] Received: 2011-04-23 Accepted: 2012-04-25
Accepted after three revisions by Prof. Dr. Buhl.
Published online: 2012-06-15 This article is also available in Ger-man in print and via http://www. wirtschaftsinformatik.de: F Marx, F Wortmann, JH Mayer (2012) Ein Reifegradmodell für Unternehmens-steuerungssysteme. Fünf Reife-grade als Grundlage der systematis-chen Entwicklung. WIRTSCHAFTSIN-FORMATIK. doi: 10.1007/s11576-012-0325-3.
Electronic Supplementary Material The online version of this article (doi:10.1007/s12599-012-0220-x) contains supplementary material, which is available to authorized users.
©Gabler Verlag 2012
1 Introduction
In today’s global companies, corporate management has become increasingly complex. To cope with the growing chal-lenges, sophisticated management con-trol systems (MCSs) covering reporting, planning, and consolidation, have been deployed (Anthony and Govindarajan
2007, p. 17; Simons1994, p. 170).
De-spite the long tradition in management research, the design of MCSs is still a challenging task and therefore a highly relevant design problem (Malmi and
Brown 2008, p. 287). Management
re-search offers different and even compet-ing management concepts with different MCSs, e.g. MCSs for financial manage-ment, strategic managemanage-ment, and value-based management (Nilsson and Olve
2001, p. 347; Seal 2010, p. 99).
More-over, changes inside and outside a com-pany demand evolutionary and some-times revolutionary changes in MCSs
(Davila and Foster 2005, p. 80; Moores
and Yuen2001, p. 351).
In the last decades, IT has become a strategic enabler for MCSs (Clark et al.
2007, p. 588; Davenport2006, p. 98;
Eck-erson 2010). Especially business
intelli-gence (BI) systems have become part of
current CFO agendas (Capgemini2008;
Sheikh et al.2010). IT is not only seen
as a means to assure appropriate and high quality performance management but also to streamline MCS processes. Various studies report on the new role of management accountants as ‘business partners’ and on trends to build shared service centers for accounting on the ba-sis of harmonized IT systems (Burns and
Vaivio 2001, p. 390; Cooper and Dart
2009, p. 2; Daum2008, p. 390).
In order to ensure a systematic MCS evolution, various aspects (e.g. organiza-tional, technical, strategic) have to be
ad-dressed (Alter 2003, p. 368). Moreover,
companies have to assess their as-is sit-uation, determine a desired to-be situa-tion and derive potential evolusitua-tion paths
(Becker et al. 2009, p. 213). Maturity
models (MMs) are an established means to support these requirements. They con-sist of multiple, archetypal levels of matu-rity reflecting an evolution path of a
cer-tain domain (Fraser et al. 2002, p. 245;
Rosemann and De Bruin2005, p. 3). In
doing so, MMs are regularly used for benchmarking and continuous
improve-ment (Ahern et al.2003; Paulk et al.1993,
p. 5). Despite the popularity of MMs in IS (information systems) research (Becker
et al.2010; Mettler et al.2009), the
con-cept has not gained much popularity in management research. Furthermore, ex-isting MMs most often lack a sound the-oretical foundation and/or are derived on the basis of an arbitrary design method
(Biberoglu and Haddad 2002, p. 150;
Lahrmann et al. 2010, p. 9). In order
to provide a rigorous instrument for the design of MCSs, this paper aims at de-veloping an empirically grounded and methodologically sound MM for MCSs. This MM allows organizations to assess their as-is situation as well as to deter-mine a desired to-be situation on a set of predefined items.
The construction of MMs is part of
de-sign science research (Becker et al.2009,
p. 213). Aligned with existing reference
processes (Becker et al. 2009; de Bruin
this paper follows the basic research steps of ‘identify a need’, ‘build’, and ‘evaluate’
(Hevner et al.2004; Hevner and
Chatter-jee2010). Section2outlines the
founda-tions of MMs and MCSs. Section3
pro-vides an overview of existing MMs for MCSs and identifies the research gaps. In
Sect. 4, the construction of the MM is
outlined. Section5covers the MCS MM
in detail. A discussion, i.e. a first eval-uation of the developed artifact is
pre-sented in Sect.6. Finally, we summarize
our findings and suggest future work.
2 Foundations
2.1 Maturity ModelsIn general, ‘maturity’ can be defined as “the state of being complete, perfect or
ready” (Simpson and Weiner1989).
Ma-turity implies an evolutionary progress from an initial to a desired target or nat-urally existing end stage. In the IS disci-pline, ‘maturity’ is regarded as “a mea-sure to evaluate the capabilities of an organization” (Rosemann and De Bruin
2005, p. 1).
MMs facilitate this evaluation by out-lining anticipated, typical, logical, and desired evolution paths (Becker et al.
2009, p. 213). In response to
criti-cism of missing methodical foundations
(Biberoglu and Haddad2002, p. 150) and
non-sufficient comparability of MMs
(Levie and Lichtenstein 2009, p. 10),
MM research focuses among others on the foundations of MMs (Becker et al.
2010; Pöppelbuß and Röglinger 2011;
Ahlemann et al.2005), e.g. classification
schemes, construction methods and de-sign principles. In terms of model ele-ments, key MM elements are maturity levels, dimensions, and an assessment
in-strument (de Bruin et al. 2005, p. 5),
which are described in Table1.
In order to analyze existing MMs and guide MM construction, classification schemes have been developed. This paper uses the classification scheme by Mettler
et al. (2009, p. 3), refined by Lahrmann
et al. (2010, p. 4) (see Table2) for
ana-lyzing the state of the art of MCS MMs. This schema was chosen because of its fo-cus on essential characteristics: It covers a small number of key aspects.
In terms of the applied methods, MMs can either be constructed in a top-down or bottom-up approach (de Bruin et al.
2005, p. 5). Following the first approach,
a fixed number of maturity stages or lev-els is specified and further detailed with characteristics (typically in form of spe-cific assessment items). Using the lat-ter, distinct characteristics or assessment items are first determined and then clus-tered into maturity levels (van
Steenber-gen et al.2010, p. 328). Typical research
methods in this context are focus groups, delphi studies, creativity techniques, case studies, or literature reviews. Quantita-tive methods are less frequently used for MM construction. An example of a quan-titative MM construction technique is the Rasch algorithm (RA) (Lahrmann et al.
2011; Rönkkö et al.2008), which will be
used for the MM construction within this paper.
2.2 Management Control Systems MCSs are defined as those “formal systematically developed, organization wide, data handling systems designed to facilitate management control” (Machin
1995, p. 11). Including executives and
ac-countants as key stakeholders (Anthony
and Govindarajan2007, p. 110),
consist-ing of formal rules and processes (Friedl
2002, p. 54; Horváth2006, p. 182), and
facilitated by a set of IT systems (Rom
and Rohde2007, p. 40), MCSs are
socio-technical systems (Alter 2003, p. 368;
Bostrom and Heinen 1977). Therefore,
they can be decomposed into an orga-nizational (people, processes, organiza-tional structures) and technical subsys-tem (information, software, hardware) providing products and services (Alter
2003, p. 368). In the following, we will
Table 1 Key elements of MMs
Element Description
Dimension Dimensions are specific capability areas, process areas, or design objects structuring the field of interest. They should be exhaustive and distinct. Each dimension is further specified by a number of measures (practices, objects, or activities) or by qualitative descriptions for each maturity level (de Bruin et al.2005, p. 5). Level Levels are archetypal states of maturity of a certain dimension or domain. Each level should have a descriptor
clearly providing the intent of the level and a detailed description of its characteristics. The characteristics of each level should be distinct and empirically testable and the relationship of each level to its predecessor and successor should be well defined (Fraser et al.2002, p. 246; Nolan1973).
Assessment instrument The assessment instrument can either be qualitative or quantitative, e.g. using Likert-based questionnaires and scoring models (Fraser et al.2002, p. 246).
Table 2 Classification scheme for MMs
Criteria Key question Characteristics
Origin Where does the MM stem from? Academia Practice
Components How is the MM specified? Lightweight description of levels and dimensions, e.g. in plain text or as visual
Quantitative assessment instrument
(questionnaire)
Well-defined MM architecture with link to assessment instrument Application Who applies the MM? Self-assessment Third-party professional Certification body
elaborate on MCS products and services, i.e. their management accounting (MA) perspective. Afterwards, we will briefly focus on IT support for MCSs.
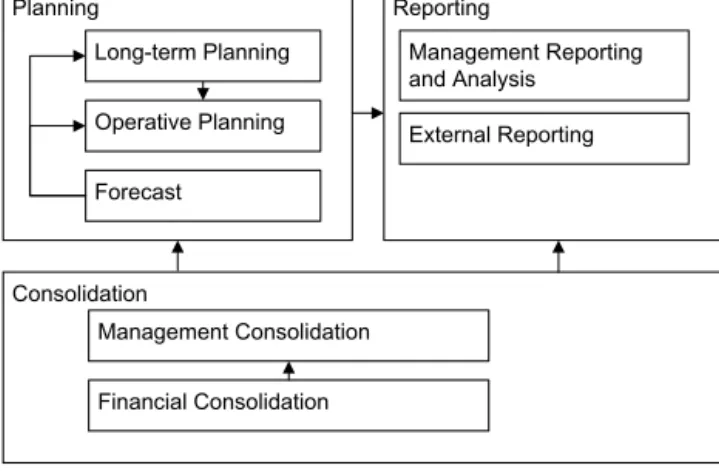
Based on the decision process con-cept and cybernetic controls, MCSs are typically divided into the planning and the reporting system (Malmi and Brown
2008, p. 293; Otley 1999, p. 366). The
planning system supports the definition of goals, which are captured as strate-gies and plans. Furthermore, planning is an integrative activity, as it sets aligned goals in order to coordinate a company’s different activities (Hansen and Van der
Stede2003, p. 415; Horváth2006, p. 171).
Addressing those requirements, different planning subsystems have been devel-oped: long-term/strategic planning, op-erational planning/budgeting, and
fore-casting (Gluck et al.1980, p. 154; Hahn
and Taylor 2006, p. XIII). The
report-ing system supports stakeholders in their periodic and continuous review of cor-porate performance and covers the in-ternal management reporting and the legally required external reporting
(An-thony and Govindarajan 2007, p. 425;
van der Walt and du Troit2007, p. 89).
Both planning and reporting rely on an integrated information base mainly consisting of financial and management consolidation. Consolidation aggregates transactional data from financial and cost accounting systems along organizational structures by elimination of capital in-terests, internal transactions, and
inter-nal results (Ernstberger and Vogler2008,
p. 346). The MCSs and their major
in-formation flows are summarized in Fig.1
(adapted from Frezatti et al.2009, p. 2;
Horváth2006, p. 117).
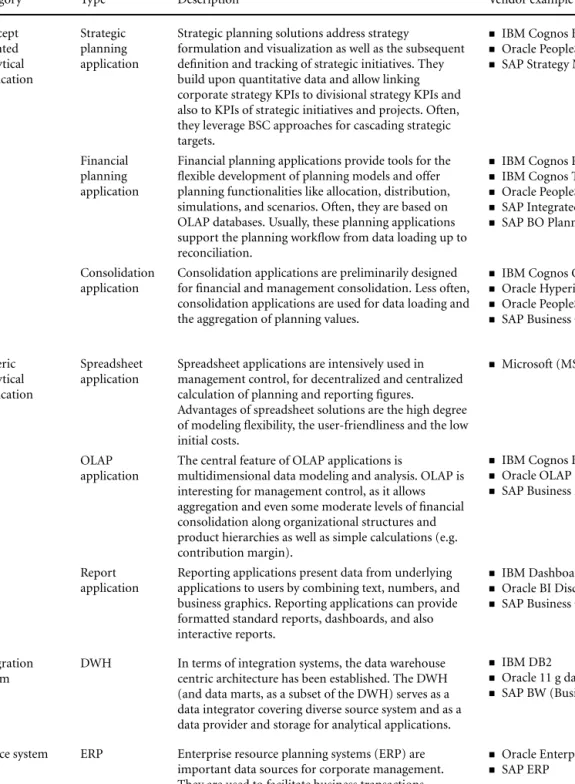
As mentioned above, current MCSs are facilitated by a set of different IT
appli-cations (Rom and Rohde2007). First of
all, transactional processing and report-ing systems have been deployed as source applications for MCSs since the 1960s. Furthermore, decision support/analytical applications, e.g. executive information systems or planning applications, are leveraged in the context of MCSs (Clark
et al.2007, p. 588). Next to transactional
and analytical applications, the corpo-rate IT landscape also encompasses in-tegration systems, e.g. data warehouses (DWHs), which enable information in-tegration and information sharing be-tween applications (Schelp and Winter
2007, p. 134). Based on current
liter-ature (Baars and Kemper 2008; Oehler
2006, p. 109; Schelp and Winter 2007;
Fig. 1 MCS and its core domains
Wagner2004), Table3depicts the
port-folio of available IT support for MCSs. This paper follows Baars and Kemper
(2008, p. 140) and distinguishes
be-tween generic and concept-oriented ana-lytical applications. In contrast to generic analytical applications, concept-oriented analytical applications provide domain-specific business logic (models and work-flows). Examples of standard software are
provided on the basis of Gartner (2010).
Generic and concept-oriented analyti-cal applications are also discussed under the umbrella term business intelligence (BI). According to Wixom and Watson
(2010, p. 14) BI “is a broad category of
technologies, applications, and processes for gathering, storing, accessing, and an-alyzing data to help its users make better decisions.” It is important to notice the difference between BI and MCS. While BI facilitates MCSs, the perspectives of BI and MCS differ quite substantially. BI has a strong technology focus and is by nature not focused on one business do-main. In contrast to BI, MCS is a man-agement accounting discipline. Its roots are therefore in one specific business do-main. Moreover, MCS are based on more than analytical information systems, e.g. ERP systems are also an important basis for MCSs.
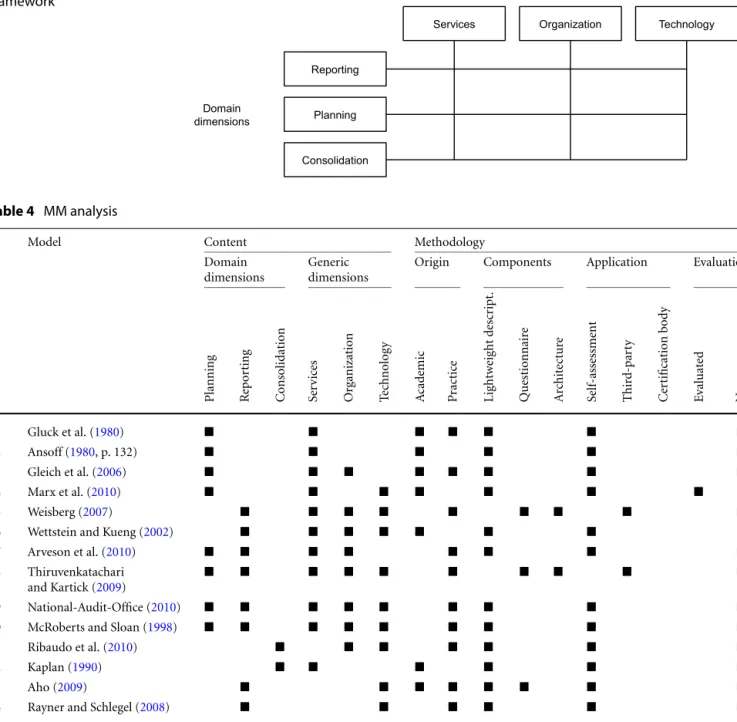
Summing up, MCSs consist of three in-terrelated domains (planning, reporting, and consolidation). Furthermore, MCSs can be decomposed into services (prod-ucts and services), organization (organi-zational subsystem) as well as technology
(technical subsystem). Figure2 depicts
the resulting conceptualization frame-work. Following Mettler and Rohner
(2009, p. 5), the three MCS domains are
‘domain (specific) dimensions’, whereas services, organization, and technology
are ‘generic (maturity) dimensions’. The conceptualization will be the basis for the analysis of the existing MMs and the MM construction.
3 State of the Art
To review the state of the art, the pa-per follows the literature research ap-proach described by Webster and Watson
(2002) and vom Brocke et al. (2009). The
search is based on six scholarly databases (Science Direct, Proquest, EBSCOhost, ACM, Wiley Inter Science, SpringerLink, and Google scholar), as they cover the most relevant MCS and MIS journals, books, conference proceedings, and prac-titioner sources. In addition, the standard Google search was used to cover most re-cent practitioner sources. In this case, the analysis of results was restricted to the 300 most important hits.
The search was conducted with the search string ‘maturity model’, ‘stage model’, and ‘life cycle’ and search terms for each dimension: In the field of plan-ning, we used the search terms ‘cor-porate planning’, ‘strategic planning’, or ‘strategic management’. In the field of reporting, we used the search terms ‘financial reporting’, ‘management re-porting’, ‘financial management’, ‘cor-porate management’, ‘cor‘cor-porate perfor-mance management’, and ‘management control system’. In the field of consolida-tion, we used the terms ‘financial consoli-dation’, ‘external reporting’, and ‘financial close’.
In order to identify further relevant ar-ticles, we conducted a backward search by reviewing citations found in the first step. As a last step, we conducted a for-ward search by identifying articles citing
Table 3 IS support of MCSs
Category Type Description Vendor example
Concept oriented analytical application Strategic planning application
Strategic planning solutions address strategy
formulation and visualization as well as the subsequent definition and tracking of strategic initiatives. They build upon quantitative data and allow linking corporate strategy KPIs to divisional strategy KPIs and also to KPIs of strategic initiatives and projects. Often, they leverage BSC approaches for cascading strategic targets.
IBM Cognos Balanced Scorecard Oracle PeopleSoft Scorecard SAP Strategy Management
Financial planning application
Financial planning applications provide tools for the flexible development of planning models and offer planning functionalities like allocation, distribution, simulations, and scenarios. Often, they are based on OLAP databases. Usually, these planning applications support the planning workflow from data loading up to reconciliation.
IBM Cognos Planning IBM Cognos TM1
Oracle PeopleSoft Planning and Budgeting SAP Integrated planning
SAP BO Plannina and Consolidation
Consolidation application
Consolidation applications are preliminarily designed for financial and management consolidation. Less often, consolidation applications are used for data loading and the aggregation of planning values.
IBM Cognos Controller Oracle Hyperion
Oracle PeopleSoft Consolidation SAP Business Consolidation
Generic analytical application
Spreadsheet application
Spreadsheet applications are intensively used in management control, for decentralized and centralized calculation of planning and reporting figures.
Advantages of spreadsheet solutions are the high degree of modeling flexibility, the user-friendliness and the low initial costs.
Microsoft (MS) Excel
OLAP application
The central feature of OLAP applications is
multidimensional data modeling and analysis. OLAP is interesting for management control, as it allows aggregation and even some moderate levels of financial consolidation along organizational structures and product hierarchies as well as simple calculations (e.g. contribution margin).
IBM Cognos BI OLAP Oracle OLAP
SAP Business Explorer Analyzer
Report application
Reporting applications present data from underlying applications to users by combining text, numbers, and business graphics. Reporting applications can provide formatted standard reports, dashboards, and also interactive reports.
IBM Dashboard Accelerator Oracle BI Discoverer
SAP Business Objects Explorer
Integration system
DWH In terms of integration systems, the data warehouse centric architecture has been established. The DWH (and data marts, as a subset of the DWH) serves as a data integrator covering diverse source system and as a data provider and storage for analytical applications.
IBM DB2
Oracle 11 g database
SAP BW (Business Warehouse)
Source system ERP Enterprise resource planning systems (ERP) are important data sources for corporate management. They are used to facilitate business transactions.
Oracle Enterprise One SAP ERP
the article in the previous steps
(Web-ster and Watson 2002). In all steps,
we examined at least titles and ab-stracts in order to evaluate only rele-vant sources. We excluded results focus-ing on dedicated corporate management tasks, such as acquisition, compliance and risk management, but also generic process, project and BI MMs. Com-pared to other domains, e.g. BI (Becker
et al.2009; Lahrmann et al.2010;
Met-tler et al.2009), this has yielded a
mod-erate number of 14 models. The MMs are described and briefly assessed in the online appendix.
For content analysis, the paper uses the
conceptual MCS framework (Fig.2),
dif-ferentiating between specific domain di-mensions and generic didi-mensions. The methodological analysis focuses on the
origin, components, application, and
evaluation of the MMs (Table2). The
re-sults of the analysis are presented in
Ta-ble4.
In terms of content, the researched MMs address different domains. Four
models are dedicated to planning
(MMs 1–4). MMs 5 and 6 focus on man-agement reporting. MMs 7–10 aim at addressing a complete corporate
man-Fig. 2 Conceptual MCS
framework
Table 4 MM analysis
# Model Content Methodology
Domain dimensions
Generic dimensions
Origin Components Application Evaluation
Planning Re p o rt in g C o nsolidation Ser vic es Org anization Te ch n o lo g y Ac ad em ic Pr ac ti ce L igh tw ei gh t d es cr ip t. Questionnair e Arch it ec tu re Self-assessment Thir d-par ty Cer tificat ion b o dy Ev al u at ed N o t tr anspar ent 1 Gluck et al. (1980) 2 Ansoff (1980, p. 132) 3 Gleich et al. (2006) 4 Marx et al. (2010) 5 Weisberg (2007)
6 Wettstein and Kueng (2002)
7 Arveson et al. (2010)
8 Thiruvenkatachari and Kartick (2009)
9 National-Audit-Office (2010)
10 McRoberts and Sloan (1998)
11 Ribaudo et al. (2010)
12 Kaplan (1990)
13 Aho (2009)
14 Rayner and Schlegel (2008)
8 8 2 11 8 9 7 10 12 3 2 12 2 0 1 12
agement approach, as they focus on planning and reporting. However, they neglect consolidation as a key domain of MCSs. The models 11 and 12 provide insight into consolidation. The models 13 and 14 are labeled as performance management MMs. However, they focus mainly on technology aspects and neglect the business perspective of MCSs.
An analysis of the generic dimensions shows that the planning models (1–2) do not provide detailed information and mainly focus on the service dimension. The other MMs (3–4) address additional aspects in the context of planning
or-ganization and IT support. The models for reporting (5–10) address basically all generic dimensions. Despite their com-prehensiveness, however, they are only partially applicable, as they remain on a very abstract detail level. The same is true for the consolidation models (11–12).
In terms of methodical analysis and background, only four models are from academia. Another four can be assigned to both categories, as the authors are consultants, but the publication is done within academic outlets. Eight models originate purely from practice.
In terms of components, 12 MMs con-tain a textual description and/or simple maturity grid. Only three models pro-vide an assessment questionnaire, and only two models are based on a well-defined architecture. Concerning appli-cation, 12 models are based on the idea of self-assessment. Two consultancy-based MMs require a third party assessment. No model serves for certification. With regard to evaluation, only two models are explicitly tested. For the remaining ones, the evaluation stays unclear. Thus, the paper supports previous statements that
existing MCS MMs build upon a weak methodological foundation.
Summing up, most MCSs focus on one dedicated domain, i.e. planning or re-porting, and only two models address consolidation. In terms of generic dimen-sions, a broad range of MMs addresses two or three dimensions. This indicates that the maturity of MCSs is already un-derstood as a multi-dimensional concept, which needs to be reflected in the MM to be constructed. The analysis of the methodology reveals gaps in terms of rigor and shows that the existing mod-els are abstract, i.e. do not provide de-tailed information. No model fulfills the requirements as outlined in the introduc-tion for a sound MM for MCSs, covering planning, reporting and consolidation.
4 Maturity Model Construction
4.1 Construction ProcessThe MCS MM model was constructed in three key steps: (1) questionnaire devel-opment and corresponding data collec-tion, (2) development of domain specific MMs for reporting, planning and consol-idation, and (3) aggregation of the do-main specific MMs into an overall model. Each of the steps is briefly described below.
Well-designed MMs are based on a hi-erarchical structure of dimensions and
sub-dimensions (de Bruin et al. 2005).
Such a structure offers the possibility of an overall, but also specific matu-rity assessment for discrete areas in or-der to address the needs of several stake-holders. Following Mettler and Rohner
(2009, p. 5) and leveraging the
concep-tional MCS framework (cp. Fig.2), we
first build our MM structure on the ba-sis of the MCS domains planning, re-porting, and consolidation. Each domain is then further decomposed according to the generic dimensions services, or-ganization, and technology. This struc-ture also sets the boundaries for the questionnaire, which contains one sec-tion for each MCS domain with assess-ment items for each generic dimension. Each section consists of about seven to nine questions (e.g. “How do you ensure quality and consistency of report con-tent?”) with two up to six assessment items (e.g. “change of reports in case of a specific request”, “systematic life cy-cle management of KPIs, reports, pro-cesses”). The items are derived from the
existing MMs (see online appendix) as
well as from selected additional literature. All in all, the questionnaire contains 25 questions and 90 items for the MM con-struction. The questionnaire has been de-veloped together with two focus groups. Moreover, a pretest was conducted before distributing the questionnaire.
Each individual MM (reporting, plan-ning, consolidation) was derived on the basis of three steps. First, the RA was conducted on the basis of the completed questionnaires to calculate a ‘difficulty’ score for each item. Moreover, the qual-ity of the resulting model was validated. Second, an initial MM was derived (items were assigned to levels), based on hierar-chical cluster analysis. Third, the initial MM was analyzed and assessed together with a focus group on the basis of two principles: (1) The results of RA and clus-ter analysis should be respected as “em-pirical evidence”, i.e. changes should only be made if strong reasons do exists; (2) the items of one level should comple-ment each other and form one consistent level.
The MM should not only guide domain-specific development, but also provide an overall direction for the dif-ferent MCS domains (Malmi and Brown
2008). This is in accordance with
socio-technical theory, whose core message is that subsystems are interdependent and need to work in harmony in order
to maximize performance (Alter 2003,
p. 368; Bostrom and Heinen 1977).
Therefore, the three domain models were finally analytically aggregated in one MCS MM, which has been assessed with a focus group. In the following sections, additional information about the Rasch algorithm, the focus groups, and the data collection are provided.
4.2 Rasch Algorithm
In order to address the methodical
is-sues identified in Sect. 3, this paper
builds upon an empirically grounded MM construction method based on the
RA (Lahrmann et al.2011, p. 176). The
RA assumes that highly skilled organi-zations have a high probability of hav-ing successfully implemented easy items. Therefore, it calculates a score for the dif-ficulty of items and the capability of par-ticipants. Both scores are measured on the same scale. With the so-called ‘Infit’ and ‘Outfit’ statistics, the RA also pro-vides criteria for model quality assess-ment, recognizing if the items and the
or-ganization fit the underlying model
as-sumptions (Dekleva and Drehmer1997).
Our paper reflects the principle of
eco-nomic efficiency (Samuelson1983): fully
implementing an item i at organizationv
is not per se the “best” solution in prac-tice. Benefits have to be related to costs. Therefore, you seek an implementation
level of Dvtproviding the best “value for
money”.
On the basis of this argumentation, this paper uses a Likert scale based ques-tionnaire, which differentiates between the actual and the desired situation of an MCS capability (item). On the ba-sis of the actual and desired values, the RA yields a single ordinal scale that rep-resents the logit measure of each item
and organization (seeonline Appendix B
for details), but no distinct maturity lev-els. In order to overcome subjectivity in defining maturity levels, the paper uses hierarchical cluster analysis (squared Eu-clidean distance, Ward’s cluster method) to assign items to levels (Lahrmann et al.
2011, p. 183). As most MMs use five
maturity levels (Becker et al.2010, p. 2;
Lahrmann et al. 2010, p. 9), the
an-ticipated number of clusters is set to five.
4.3 Focus Group Approach
The RA approach was complemented by two focus groups. Focus groups are an es-tablished means to investigate new ideas and to check the applicability of a re-search object by practitioners (Tremblay
et al. 2010). Focus group A, exclusively
set up to discuss the development of the MCS MM, consisted of six MCS
con-sultants. Table5depicts the members of
this group, which met three times for 4–8 hours to assess the MM.
Focus group B is a group of large in-ternational companies which met on a regular basis to discuss latest MCS
devel-opments. Table 6describes the
compa-nies and corresponding members of fo-cus group B. The two fofo-cus groups were involved in the following steps: The ques-tionnaire structure was derived on the basis of the conceptual framework
de-picted in Sect.2.2. Afterwards,
question-naire items were derived on the basis
of the existing MMs (cf. Sect. 4).
Fo-cus group A has been leveraged to dis-cuss the applicability of the conceptual framework, several specific items, and
the results of the RA (Sect. 4.4). Focus
group B has been used to pretest the final questionnaire and to evaluate the final model.
Table 5 Characteristics of
focus group A # Consultant
1 Senior partner within a large consulting and audit company, 20 years expertise in MCSs 2 Junior partner within a large consulting and audit company, 20 years expertise in BI 3 Project manager within a large consulting and audit company, 10 years expertise in MCSs 4 Senior consultant within a large consulting and audit company, 6 years expertise in MCSs 5 Junior consultant within a large consulting and audit company, 3 years expertise in BI
Table 6 Characteristics of focus group B
# Company Participant
1 Leading software company with about 50,000 employees Head of Management Reporting
2 Large international chemical company with about 160,000 employees Head of Management Reporting
3 Large manufacturing company with about 120,000 employees Head of Management Reporting
4 Leading telecom provider with about 260,000 employees Head of Management Reporting
5 Large manufacturing company with about 20,000 employees Head of Management Reporting
6 Large manufacturing company with about 140,000 employees Head of Management Reporting
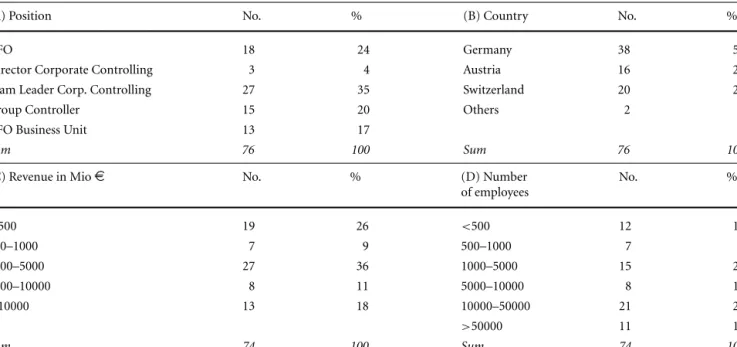
Table 7 Sample characteristics
(A) Position No. % (B) Country No. %
CFO 18 24 Germany 38 50
Director Corporate Controlling 3 4 Austria 16 21
Team Leader Corp. Controlling 27 35 Switzerland 20 26
Group Controller 15 20 Others 2 3
CFO Business Unit 13 17
Sum 76 100 Sum 76 100
(C) Revenue in Mio€ No. % (D) Number
of employees No. % <500 19 26 <500 12 16 500–1000 7 9 500–1000 7 9 1000–5000 27 36 1000–5000 15 20 5000–10000 8 11 5000–10000 8 11 >10000 13 18 10000–50000 21 28 >50000 11 14 Sum 74 100 Sum 74 100 4.4 Data Collection
331 CFOs and management accountants at large enterprises in Europe were se-lected as the target group for the MM construction. For data collection, the questionnaire was sent in paper form, but we also used an online survey tool. This yielded in 76 returned and completed questionnaires (response rate 23 %). This number is comparable to other CFO and
MA studies (e.g. Moores and Yuen (2001)
n=49 and Davila and Foster (2005) n=
78, and Seeley and Targett (1999) n=
85). Table 7 shows that the sample is
characterized by a majority of responses by CFOs and leading management ac-countants. Furthermore, the sample is well balanced in terms of country, rev-enue, and size. Two respondents did not provide information regarding revenue and size.
5 Maturity Model
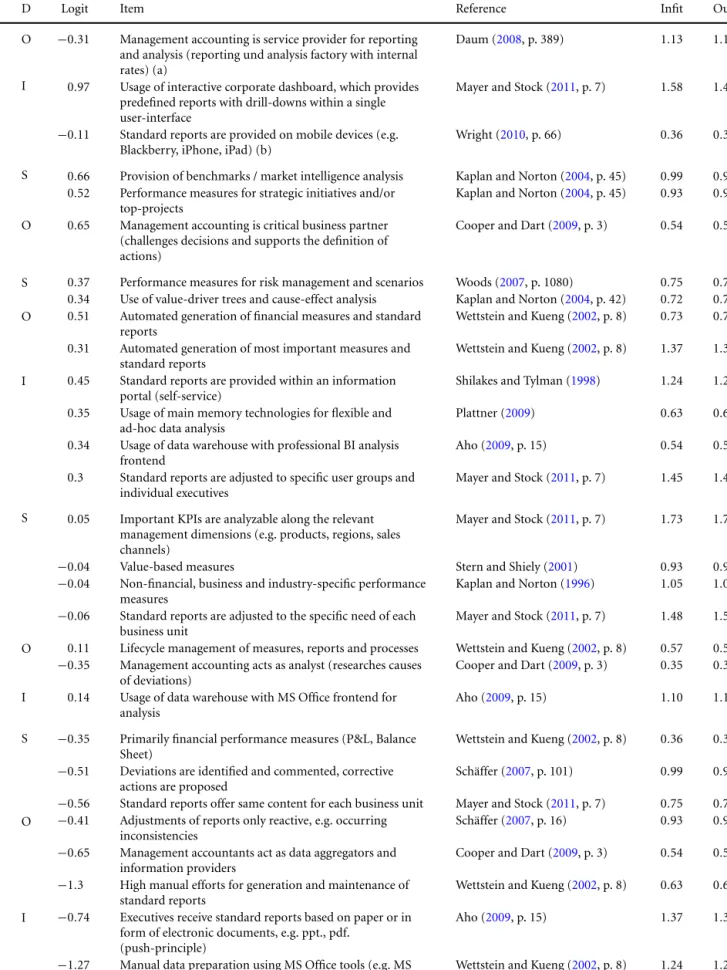
5.1 Reporting MMFor reporting, the questionnaire encom-passed 9 questions and 33 items. The
items are described and shown in Table8
with the corresponding RA values. The MM construction followed three steps as
described in Sect.4.1. The quality of the
Reporting MM is assured, as no more than 5 percent of the items have Infit and Outfit values greater than two (model fit quality criteria) (Dekleva and Drehmer
1997, p. 99). Focus group A identified
two items (a – reporting and analysis fac-tory and b – mobile devices) and repo-sitioned them from level 2 to level 5. They only reach a moderate logit, but are clearly very advanced items. Two rea-sons were identified for this
modifica-Table 8 Reporting MM
L D Logit Item Reference Infit Outfit
5 O −0.31 Management accounting is service provider for reporting and analysis (reporting und analysis factory with internal rates) (a)
Daum (2008, p. 389) 1.13 1.17
I 0.97 Usage of interactive corporate dashboard, which provides predefined reports with drill-downs within a single user-interface
Mayer and Stock (2011, p. 7) 1.58 1.49
−0.11 Standard reports are provided on mobile devices (e.g. Blackberry, iPhone, iPad) (b)
Wright (2010, p. 66) 0.36 0.38
4 S 0.66 Provision of benchmarks / market intelligence analysis Kaplan and Norton (2004, p. 45) 0.99 0.99 0.52 Performance measures for strategic initiatives and/or
top-projects
Kaplan and Norton (2004, p. 45) 0.93 0.93 O 0.65 Management accounting is critical business partner
(challenges decisions and supports the definition of actions)
Cooper and Dart (2009, p. 3) 0.54 0.54
3 S 0.37 Performance measures for risk management and scenarios Woods (2007, p. 1080) 0.75 0.75 0.34 Use of value-driver trees and cause-effect analysis Kaplan and Norton (2004, p. 42) 0.72 0.74 O 0.51 Automated generation of financial measures and standard
reports
Wettstein and Kueng (2002, p. 8) 0.73 0.73 0.31 Automated generation of most important measures and
standard reports
Wettstein and Kueng (2002, p. 8) 1.37 1.36 I 0.45 Standard reports are provided within an information
portal (self-service)
Shilakes and Tylman (1998) 1.24 1.23 0.35 Usage of main memory technologies for flexible and
ad-hoc data analysis
Plattner (2009) 0.63 0.61
0.34 Usage of data warehouse with professional BI analysis frontend
Aho (2009, p. 15) 0.54 0.54
0.3 Standard reports are adjusted to specific user groups and individual executives
Mayer and Stock (2011, p. 7) 1.45 1.43 2 S 0.05 Important KPIs are analyzable along the relevant
management dimensions (e.g. products, regions, sales channels)
Mayer and Stock (2011, p. 7) 1.73 1.73
−0.04 Value-based measures Stern and Shiely (2001) 0.93 0.92
−0.04 Non-financial, business and industry-specific performance measures
Kaplan and Norton (1996) 1.05 1.04 −0.06 Standard reports are adjusted to the specific need of each
business unit
Mayer and Stock (2011, p. 7) 1.48 1.52 O 0.11 Lifecycle management of measures, reports and processes Wettstein and Kueng (2002, p. 8) 0.57 0.56
−0.35 Management accounting acts as analyst (researches causes of deviations)
Cooper and Dart (2009, p. 3) 0.35 0.36 I 0.14 Usage of data warehouse with MS Office frontend for
analysis
Aho (2009, p. 15) 1.10 1.12
1 S −0.35 Primarily financial performance measures (P&L, Balance Sheet)
Wettstein and Kueng (2002, p. 8) 0.36 0.38 −0.51 Deviations are identified and commented, corrective
actions are proposed
Schäffer (2007, p. 101) 0.99 0.99 −0.56 Standard reports offer same content for each business unit Mayer and Stock (2011, p. 7) 0.75 0.75 O −0.41 Adjustments of reports only reactive, e.g. occurring
inconsistencies
Schäffer (2007, p. 16) 0.93 0.93 −0.65 Management accountants act as data aggregators and
information providers
Cooper and Dart (2009, p. 3) 0.54 0.54 −1.3 High manual efforts for generation and maintenance of
standard reports
Wettstein and Kueng (2002, p. 8) 0.63 0.61 I −0.74 Executives receive standard reports based on paper or in
form of electronic documents, e.g. ppt., pdf. (push-principle)
Aho (2009, p. 15) 1.37 1.36
−1.27 Manual data preparation using MS Office tools (e.g. MS Excel)
tion. First of all, item (a) and its impli-cations were not understood by the re-spondents because of bad wording. Item (b) was repositioned, because the focus group had a strong feeling that mobility has a strong potential, but is not yet well understood in practice.
The final reporting MM is depicted in
Table8, showing the maturity level (L), the domain (D), i.e. services (S), organi-zation (O), information technology (I), the RA score values (logit), relevant refer-ences, and the fit statistics (Infit and Out-fit) of the items. The items are sorted in a descending order according to maturity level, domain and logit. The interpreta-tion of the model depicts the following evolution path:
Level 1 depicts a reporting stage which
is characterized by a strong focus on financial measures and mandatory shareholder requirements. Reporting processes are highly manual and result in paper-based standard reports.
Level 2 describes an extended
manage-ment approach focusing on internal management and addressing more ad-vanced shareholder requirements, i.e. first analysis are enabled and value-based measures are put into place. The internal focus leads to report-ing and analysis services for corpo-rate and business units. Consequently, management accountants act as ana-lysts. A first data warehouse serves as a platform to provide such services at the corporate center.
Level 3 enhances the service
dimen-sion with risk measures and advanced analysis to provide additional insights and dedicated services for specific user groups. The services are based on well-designed and automated report-ing processes, advanced analysis tools and information portals. Level 3 re-flects a well-organized and compre-hensive, but still financially oriented corporate reporting.
Level 4 is driven by strategic aspects, as
strategic measures and analyses get im-plemented. Management accountants are able to comply with the strategic orientation: Due to process automa-tion they can act as ‘business part-ners’ rather than focusing on pure information provisioning.
Level 5 aims at levering the
po-tentials of modern BI environments for the information consumers (‘self-empowerment’ with mobile devices and dashboards). Furthermore, shared
service center approaches are imple-mented as a basis for reporting and analysis factories.
Overall, the derived model reveals that the levels are not exclusive, but consecu-tive, i.e. the MCS capabilities of the stages build upon each other. Some levels do not comprise items for all dimensions. This is common practice in maturity model con-struction, as not every evolutionary step is holistic in respect to the dimensions at
hand (Ahern et al.2003).
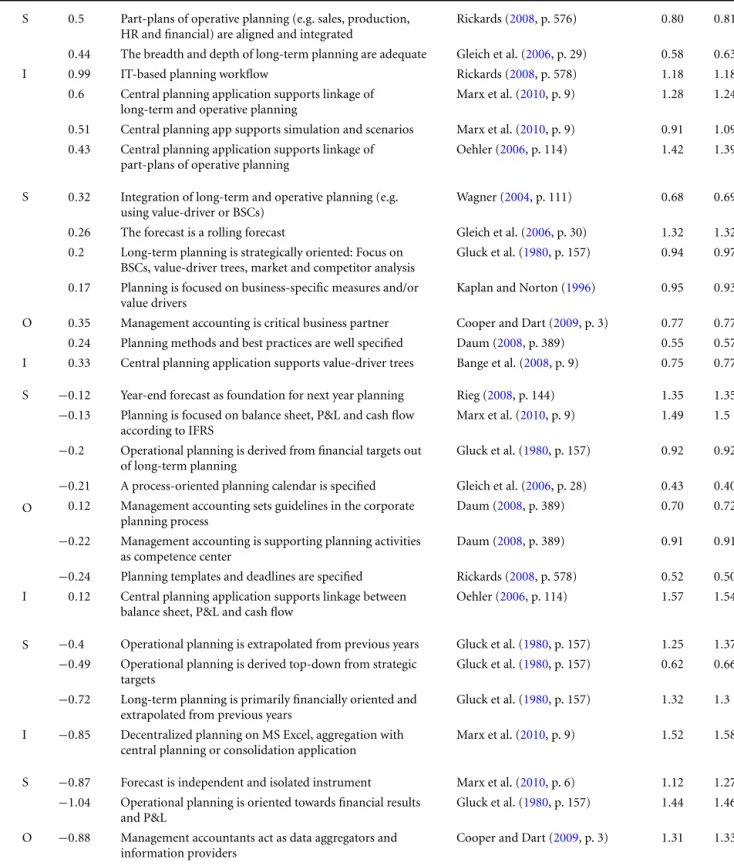
5.2 Planning MM
For planning, the questionnaire encom-passed 9 questions and 35 items. The construction followed the same three
steps as described in Sect.4.1. The
ini-tial planning MM was analyzed with fo-cus group A. This time, no item was re-placed, so we maintained the initial MM. The levels, generic dimensions, logits and
items are depicted in Table 9. The
In-fit and OutIn-fit statistics are satisfying en-suring adequate model quality. The re-sults for planning show the following evolution path:
Level 1 describes a financially and
op-erationally oriented short-term plan-ning and a separate forecast. Plan-ning data is prepared manually by accountants using spreadsheets.
Level 2 adds a financially oriented
long-term planning, completing the triad of planning systems from a ser-vice perspective for the first time (see
Sect. 2.2). Planning quality is
mod-erate, as planning data is mainly ex-trapolated from the previous year. First planning processes are in place sup-ported by an application mainly for aggregation, not planning.
Level 3 is characterized by a
compre-hensive, but still financially oriented planning system. In comparison to level 2, the planning subsystems are much more integrated and aligned. They are based on well-defined plan-ning processes. Planplan-ning templates en-sure planning efficiency. For the first time, a concept-oriented planning ap-plication is used.
Level 4 is characterized by a paradigm
shift from a financial to a more holistic planning, i.e. strategies, business plans, and corresponding adjusted planning subsystems are deployed. In turn, the role of corporate management ac-counting and planning applications fa-cilitate the strategic orientation. Best practices and the usage of advanced
planning applications aim at ensuring the holistic planning.
Level 5 is concerned with streamlining
the grown planning system by means of part plan integration and strong IT/BI support. Additionally, potentials of enhanced planning applications are leveraged.
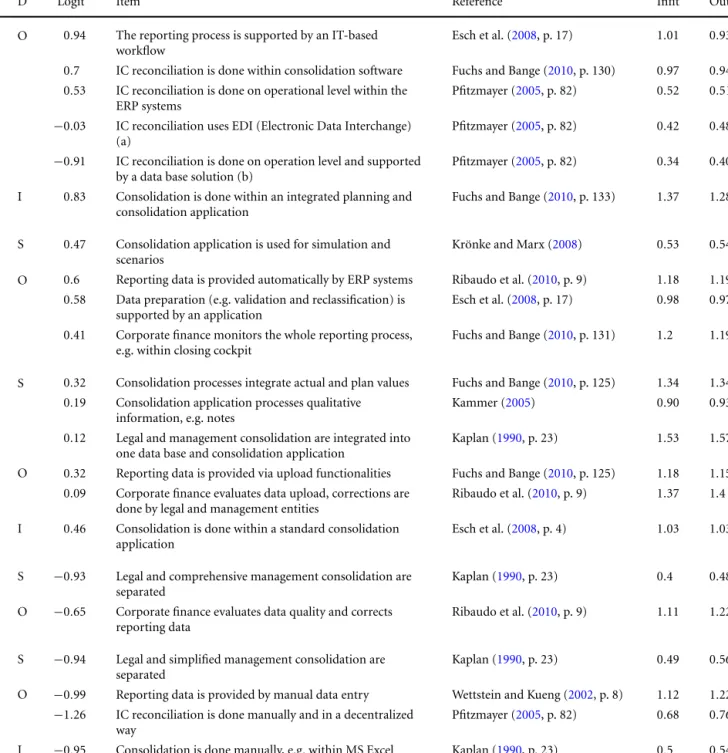
5.3 Consolidation MM
For financial consolidation, the ques-tionnaire encompassed 7 questions and 22 items. The construction followed the
same three steps as described in Sect.4.1.
Within the initial MM, the focus group A identified two items in the field of inter-company (IC) reconciliation (a – support of IC with electronic data interchange and b – support of IC with a data base so-lution) as very advanced items and agreed to shift them on level 5. The items and the result of the RA are depicted in
Ta-ble10. The Infit and Outfit statistics are
satisfying. The results show the following evolutionary path:
Level 1 consists of a legally required
financial consolidation. Consolidation runs are done with high manual efforts and basic IT support.
Level 2 adds a comprehensive internal
perspective, as it provides a full con-solidation for internal management re-porting, i.e. consolidation for prod-ucts, regions, business units etc. As the two perspectives (internal and exter-nal) are separated, corporate finance has to invest significant resources in order to ensure data quality and com-parability of both data sets. Still, no so-phisticated consolidation application is used.
Level 3 is characterized by a
profes-sionalization of the financial consoli-dation function. Legal, management, and plan data is consolidated using a single and integrated data base and is processed within a standard con-solidation application. The data load-ing processes are professionally set up and enabled by IT. Responsibility for data quality is shifted to decentralized entities.
Level 4 further focuses on
en-Table 9 Planning MM
L D Logit Item Reference Infit Outfit
5 S 0.5 Part-plans of operative planning (e.g. sales, production, HR and financial) are aligned and integrated
Rickards (2008, p. 576) 0.80 0.81 0.44 The breadth and depth of long-term planning are adequate Gleich et al. (2006, p. 29) 0.58 0.63
I 0.99 IT-based planning workflow Rickards (2008, p. 578) 1.18 1.18
0.6 Central planning application supports linkage of long-term and operative planning
Marx et al. (2010, p. 9) 1.28 1.24 0.51 Central planning app supports simulation and scenarios Marx et al. (2010, p. 9) 0.91 1.09 0.43 Central planning application supports linkage of
part-plans of operative planning
Oehler (2006, p. 114) 1.42 1.39
4 S 0.32 Integration of long-term and operative planning (e.g. using value-driver or BSCs)
Wagner (2004, p. 111) 0.68 0.69
0.26 The forecast is a rolling forecast Gleich et al. (2006, p. 30) 1.32 1.32
0.2 Long-term planning is strategically oriented: Focus on BSCs, value-driver trees, market and competitor analysis
Gluck et al. (1980, p. 157) 0.94 0.97 0.17 Planning is focused on business-specific measures and/or
value drivers
Kaplan and Norton (1996) 0.95 0.93 O 0.35 Management accounting is critical business partner Cooper and Dart (2009, p. 3) 0.77 0.77 0.24 Planning methods and best practices are well specified Daum (2008, p. 389) 0.55 0.57 I 0.33 Central planning application supports value-driver trees Bange et al. (2008, p. 9) 0.75 0.77 3 S −0.12 Year-end forecast as foundation for next year planning Rieg (2008, p. 144) 1.35 1.35
−0.13 Planning is focused on balance sheet, P&L and cash flow according to IFRS
Marx et al. (2010, p. 9) 1.49 1.5 −0.2 Operational planning is derived from financial targets out
of long-term planning
Gluck et al. (1980, p. 157) 0.92 0.92 −0.21 A process-oriented planning calendar is specified Gleich et al. (2006, p. 28) 0.43 0.40 O 0.12 Management accounting sets guidelines in the corporate
planning process
Daum (2008, p. 389) 0.70 0.72
−0.22 Management accounting is supporting planning activities as competence center
Daum (2008, p. 389) 0.91 0.91
−0.24 Planning templates and deadlines are specified Rickards (2008, p. 578) 0.52 0.50 I 0.12 Central planning application supports linkage between
balance sheet, P&L and cash flow
Oehler (2006, p. 114) 1.57 1.54
2 S −0.4 Operational planning is extrapolated from previous years Gluck et al. (1980, p. 157) 1.25 1.37 −0.49 Operational planning is derived top-down from strategic
targets
Gluck et al. (1980, p. 157) 0.62 0.66 −0.72 Long-term planning is primarily financially oriented and
extrapolated from previous years
Gluck et al. (1980, p. 157) 1.32 1.3 I −0.85 Decentralized planning on MS Excel, aggregation with
central planning or consolidation application
Marx et al. (2010, p. 9) 1.52 1.58
1 S −0.87 Forecast is independent and isolated instrument Marx et al. (2010, p. 6) 1.12 1.27 −1.04 Operational planning is oriented towards financial results
and P&L
Gluck et al. (1980, p. 157) 1.44 1.46 O −0.88 Management accountants act as data aggregators and
information providers
Cooper and Dart (2009, p. 3) 1.31 1.33 I −1.02 Manuel data delivery and aggregation using Office tools Marx et al. (2010, p. 9) 1.20 1.38
hancing data quality. Quality-ensuring mechanisms are established on trans-actional level and data is automati-cally loaded from local accounting
ap-plications. Corporate finance is able to focus on monitoring the process.
Level 5 puts a special focus on IC
reconciliation. However, standard
con-solidation software is also replaced by state of the art solutions support-ing workflow and integrated plannsupport-ing capabilities.
Table 10 Consolidation MM
L D Logit Item Reference Infit Outfit
5 O 0.94 The reporting process is supported by an IT-based workflow
Esch et al. (2008, p. 17) 1.01 0.93 0.7 IC reconciliation is done within consolidation software Fuchs and Bange (2010, p. 130) 0.97 0.94 0.53 IC reconciliation is done on operational level within the
ERP systems
Pfitzmayer (2005, p. 82) 0.52 0.51 −0.03 IC reconciliation uses EDI (Electronic Data Interchange)
(a)
Pfitzmayer (2005, p. 82) 0.42 0.48 −0.91 IC reconciliation is done on operation level and supported
by a data base solution (b)
Pfitzmayer (2005, p. 82) 0.34 0.40 I 0.83 Consolidation is done within an integrated planning and
consolidation application
Fuchs and Bange (2010, p. 133) 1.37 1.28
4 S 0.47 Consolidation application is used for simulation and scenarios
Krönke and Marx (2008) 0.53 0.54 O 0.6 Reporting data is provided automatically by ERP systems Ribaudo et al. (2010, p. 9) 1.18 1.19
0.58 Data preparation (e.g. validation and reclassification) is supported by an application
Esch et al. (2008, p. 17) 0.98 0.97 0.41 Corporate finance monitors the whole reporting process,
e.g. within closing cockpit
Fuchs and Bange (2010, p. 131) 1.2 1.19
3 S 0.32 Consolidation processes integrate actual and plan values Fuchs and Bange (2010, p. 125) 1.34 1.34 0.19 Consolidation application processes qualitative
information, e.g. notes
Kammer (2005) 0.90 0.93
0.12 Legal and management consolidation are integrated into one data base and consolidation application
Kaplan (1990, p. 23) 1.53 1.57
O 0.32 Reporting data is provided via upload functionalities Fuchs and Bange (2010, p. 125) 1.18 1.15 0.09 Corporate finance evaluates data upload, corrections are
done by legal and management entities
Ribaudo et al. (2010, p. 9) 1.37 1.4 I 0.46 Consolidation is done within a standard consolidation
application
Esch et al. (2008, p. 4) 1.03 1.03
2 S −0.93 Legal and comprehensive management consolidation are separated
Kaplan (1990, p. 23) 0.4 0.48
O −0.65 Corporate finance evaluates data quality and corrects reporting data
Ribaudo et al. (2010, p. 9) 1.11 1.22
1 S −0.94 Legal and simplified management consolidation are separated
Kaplan (1990, p. 23) 0.49 0.56
O −0.99 Reporting data is provided by manual data entry Wettstein and Kueng (2002, p. 8) 1.12 1.22 −1.26 IC reconciliation is done manually and in a decentralized
way
Pfitzmayer (2005, p. 82) 0.68 0.76 I −0.95 Consolidation is done manually, e.g. within MS Excel Kaplan (1990, p. 23) 0.5 0.54
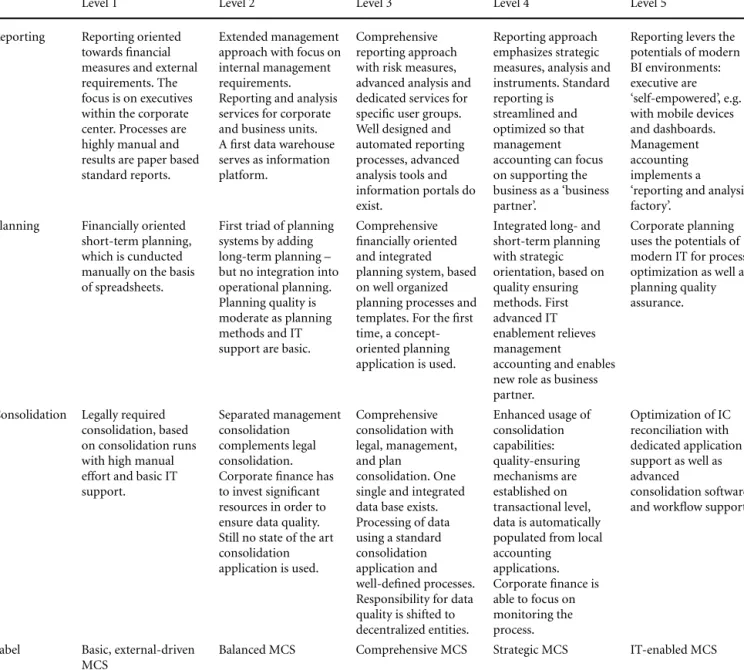
5.4 MCS MM
In the following, the partial models are analytically aggregated in one MCS MM
(Table 11), which has been assessed
with focus group A. Thereby, dependen-cies and inter-domain relationships be-tween the core domains reporting, plan-ning, and consolidation are reflected, i.e. the commonalities between and driv-ing forces behind the three domains are extracted.
The interpretation shows that the do-main models are consistent with each other (similar aspects are addressed on the same level) and also lead to a consis-tent overall MCS MM. While we under-stand that the aggregation only provides limited insights into cross-domain rela-tionships, we thrive for an easy to under-stand executive summary-like presenta-tion to also enable management-oriented audiences to reflect and apply our
re-search (cp. Hevner et al.2004, “Guideline
7: Communication of Research”):
Basic, external-driven MCS: The first
level is strongly influenced by legal requirements of financial accounting and consolidation. Furthermore, this level is also characterized by high man-ual efforts and very low IT support.
Balanced MCS: Level 2 strengthens
in-ternal management reporting (exter-nal and inter(exter-nal reporting are now bal-anced), providing additional informa-tion and analysis, as well as addiinforma-tional
Table 11 The MCS MM
Level 1 Level 2 Level 3 Level 4 Level 5
Reporting Reporting oriented towards financial measures and external requirements. The focus is on executives within the corporate center. Processes are highly manual and results are paper based standard reports.
Extended management approach with focus on internal management requirements. Reporting and analysis services for corporate and business units. A first data warehouse serves as information platform.
Comprehensive reporting approach with risk measures, advanced analysis and dedicated services for specific user groups. Well designed and automated reporting processes, advanced analysis tools and information portals do exist.
Reporting approach emphasizes strategic measures, analysis and instruments. Standard reporting is
streamlined and optimized so that management accounting can focus on supporting the business as a ‘business partner’.
Reporting levers the potentials of modern BI environments: executive are ‘self-empowered’, e.g. with mobile devices and dashboards. Management accounting implements a ‘reporting and analysis factory’.
Planning Financially oriented short-term planning, which is cunducted manually on the basis of spreadsheets.
First triad of planning systems by adding long-term planning – but no integration into operational planning. Planning quality is moderate as planning methods and IT support are basic.
Comprehensive financially oriented and integrated planning system, based on well organized planning processes and templates. For the first time, a concept-oriented planning application is used.
Integrated long- and short-term planning with strategic orientation, based on quality ensuring methods. First advanced IT enablement relieves management
accounting and enables new role as business partner.
Corporate planning uses the potentials of modern IT for process optimization as well as planning quality assurance.
Consolidation Legally required consolidation, based on consolidation runs with high manual effort and basic IT support.
Separated management consolidation complements legal consolidation. Corporate finance has to invest significant resources in order to ensure data quality. Still no state of the art consolidation application is used. Comprehensive consolidation with legal, management, and plan consolidation. One single and integrated data base exists. Processing of data using a standard consolidation application and well-defined processes. Responsibility for data quality is shifted to decentralized entities. Enhanced usage of consolidation capabilities: quality-ensuring mechanisms are established on transactional level, data is automatically populated from local accounting applications. Corporate finance is able to focus on monitoring the process. Optimization of IC reconciliation with dedicated application support as well as advanced consolidation software and workflow support.
Label Basic, external-driven MCS
Balanced MCS Comprehensive MCS Strategic MCS IT-enabled MCS
planning and consolidation capabili-ties. Management accountants evolve into the role of analysts. IT support increases and first DWHs are deployed.
Comprehensive MCS: Level 3 captures
a broad range of well-aligned MCS ca-pabilities. Processes are partially auto-mated and a broad suite of analyti-cal IT applications is available. Man-agement accountants act as supervi-sors and organizers of the reporting and planning processes.
Strategic MCS: Level 4 is dominated by
the concept of strategic management. Correspondingly, reporting and plan-ning are focused on strategic topics, and management accountants act as ‘business partners’. Furthermore, first
advanced IT applications for analysis are used. Moreover, data quality is en-sured by implementing corresponding mechanisms on transactional level.
IT-enabled MCS: The fifth and final
level is strongly driven by the usage of modern IT capabilities, both on a transactional and analytical level. State of the art reporting applications are deployed for information consumers. Planning and consolidation leverage the potentials of latest technology.
6 Discussion
For discussion, the paper reflects the re-sults on the basis of the key design science
criteria ‘rigor’ and ‘relevance’ (Hevner
et al. 2004, pp. 87–88). Rigor requests
that the design process and the design re-sults are traceable, transparent, reliable,
and valid (Frank2000, p. 44). Relevance
is defined as the ability to solve the
out-lined problem (March and Smith 1995,
p. 254).
As missing methodical rigor of exist-ing MMs has been a central motivation of this paper, the selected research method (RA algorithm and cluster analysis) aims at reducing subjectivity in MM construc-tion. The validity of the items has been ensured by using the existing knowledge base as well as pretesting the designed questionnaire with focus groups A and B. From a content perspective, the
applica-tion of items and method results in a con-sistent and reasonable MCS MM, which is in line with and enhances existing academic-based models (e.g. to Wettstein
and Kueng (2002) for reporting, to Gluck
et al. (1980) for planning, and Kaplan
(1990) for consolidation).
To evaluate the relevance of the MCS MM, the model has been presented to focus group B, which appreciated the model as a valid and useful benchmark and orientation for their MCS devel-opment. From a design perspective, the MCS MM and the corresponding ques-tionnaire support the outlined require-ment to assess the as-is situation in or-der to unor-derstand possible evolution di-rections and to determine a desired tar-get configuration. The applicability has been demonstrated within a session of fo-cus group B: Being confronted with their individual and best of class results, the participants recognized gaps, which they assessed as valuable inputs for improv-ing their existimprov-ing MCS approaches. Four of the six participants of focus group B mentioned that they would use the in-dividual gaps and the model as a trig-ger to set up new improvement projects. Criticism occurred regarding the fact that the sub-models do not contain items in all dimensions on all maturity levels. In addition, several special topics have been mentioned, which should be incorpo-rated in the model’s next iteration, such as accounting master data and the overall accounting IT architecture.
To sum up, the MCS MM has demon-strated to be a useful means for MCS de-sign. As demanded by several researchers
(Malmi and Brown 2008; Otley 1999),
the MCS MM provides a comprehensive and integrated view: It enhances existing MMs by addressing more than one sin-gle MCS domain and by reflecting lat-est developments, e.g. new BI capabili-ties. Therefore, the MCS MM can be seen as a contribution to the knowledge base.
7 Summary and Outlook
In today’s companies, corporate man-agement relies on formal and IT-based MCSs. Despite their long tradition in re-search, the configuration of MCSs is still a challenging question. MMs are an es-tablished means to identify strengths and weaknesses of certain domains of an or-ganization. The analysis within this pa-per shows that existing MMs often do not address a holistic view on MCSs: They
focus on single MCS domains and ne-glect the IS perspective. Moreover, ex-isting MMs are lacking a sound theo-retical foundation and/or are derived on the basis of an arbitrary design method. Therefore, this paper aims at developing a sound and rigorous MCS MM, based on empirical data and the RA. As a re-sult, the paper outlines three partial MMs for reporting, planning, and consolida-tion, which are integrated into one holis-tic MCS MM. The five maturity levels of this MCS MM guide MCS evolution from a basic, external-driven MCS (level 1), to a balanced (level 2), and comprehen-sive MCS (level 3), serving the whole cor-poration with advanced reporting, plan-ning, and consolidation services. Ulti-mately, MCSs show a strong strategic fo-cus (level 4) and leverage the potentials of modern IT (level 5).
The empirical-based MM construction ensures the rigor of the MCS MM and is an innovative example of deriving MMs. Thereby, it contributes to the knowledge base of our research community (the-oretical implication). Considering man-agerial implications, the proposed MM provides a valuable artifact for assess-ing the maturity of MCSs and guid-ing future development. Incorporatguid-ing reporting, planning, and consolidation as well as modern BI applications, the MCS MM advances its predecessors and reflects current developments.
Like every empirical research, our work comes with limitations. First of all, the MM construction process is based on the personal judgment of the individuals who completed the survey. Moreover, the value of the MM has been discussed but not deeply analyzed or proven. Therefore, future research should focus on a more comprehensive and sophisticated evalua-tion. Additionally, more insights should be given on how to apply the MM effec-tively. Future research should also be di-rected towards enhancing the MM with more fundamental information manage-ment topics, such as master data man-agement, data quality management and IT architecture management. Another re-search direction should be focusing on situational MM design. The RA method enables the development of dedicated MMs for specific sub-samples. As the de-velopment of MCSs is continuing, a MM evolution should be anticipated and an iterative survey execution should update the model in regular research cycles.
Abstract
Frederik Marx, Felix Wortmann, Jörg H. Mayer
A Maturity Model for
Management Control Systems
Five Evolutionary Steps to Guide Development
Corporate management in today’s ternational companies has become in-creasingly complex. To cope with the growing challenges, information tech-nology (IT)-based management con-trol systems (MCSs) covering report-ing, plannreport-ing, and consolidation have been deployed. Despite their tradition in management research, the ‘right’ setup of MCSs is still challenging. Ma-turity models (MMs) are an established instrument to identify strengths and weaknesses of certain domains. As ex-isting MMs rather focus on single MCS domains, neglect an IT perspective and miss a sound methodical foundation, this paper outlines an empirically and algorithmically constructed MCS MM. The model consists of three partial MMs for reporting, planning, and con-solidation, which are integrated into one holistic MCS MM. The five lev-els of the MCS MM guide MCS evolu-tion from a basic, mandatory/external-driven MCS (level 1) to a balanced MCS (level 2), and a comprehensive MCS (level 3). Ultimately, MCSs show a strong strategic focus (level 4) and leverage the potentials of modern IT (level 5).
Keywords: Corporate management, Management accounting, Manage-ment control systems, Business intelli-gence, Maturity models, Design science
References
Ahern DM, Clouse A, Turner R (2003) CMMI distilled: a practical introduction to in-tegrated process improvement, 2nd edn. Addison-Wesley, Boston
Ahlemann F, Schroeder C, Teuteberg F (2005) Kompetenz- und Reifegradmodelle für das Projektmanagement – Grundlagen, Ver-gleich und Einsatz. ISPRI-Arbeitsbericht No. 01/2005, Osnabrück
Aho M (2009) A capability maturity model for corporate performance management – an empirical study in large Finnish manufac-turing companies. In: eBRF – a research fo-rum to understand business in knowledge society, Jyväskylä
Alter S (2003) 18 reasons why IT-reliant work systems should replace “the IT artifact” as the core subject matter of the IS field. Com-munications of the Association for Informa-tion Systems 12(23):366–395
Ansoff HI (1980) Strategic issue management. Strategic Management Journal 1(2):131– 148
Anthony RN, Govindarajan V (2007) Manage-ment control systems, 12th edn. McGraw-Hill/Irwin, New York
Arveson P, Rohm H, Wilsey D, Perry G, Halbach L, DeCarlo J (2010) The strategic manage-ment maturity model. Balanced Scorecard Institute, Cary
Baars H, Kemper HG (2008) Management support with structured and unstructured data – an integrated business intelligence framework. Information Systems Manage-ment 25(2):132–148
Bange C, Dahnken O, Friedrich D (2008) Pla-nung und Budgetierung in europäischen Unternehmen: Konzepte, Lösungen und Potenzial von Performance Management. BARC, Würzburg
Becker J, Knackstedt R, Pöppelbuß J (2009) Developing maturity models for IT man-agement – a procedure model and its ap-plication. Business & Information Systems Engineering 1(3):13–222
Becker J, Niehaves B, Pöppelbuss J, Simons SA (2010) Maturity models in IS research. In: 18th European conference on information systems (ECIS 2010), Pretoria
Biberoglu E, Haddad H (2002) A survey of industrial experiences with CMM and the teaching of CMM practices. Journal of Com-puting Sciences in Colleges 18(2):143–152 Bond TG, Fox CM (2007) Applying the Rasch
model. Fundamental measurement in the human sciences, 2nd edn. Erlbaum, Mah-wah
Bostrom RP, Heinen S (1977) MIS problems and failures – a socio-technical perspective. Part I. The causes. Management Informa-tion Systems Quarterly 1(3):17–32 Burns J, Vaivio J (2001) Management
account-ing change. Management Accountaccount-ing Re-search 12:389–402
Capgemini (2008) CFO Agenda 2008: Dimen-sionen einer erfolgreichen Strategie. Cap-gemini
Clark TD Jr, Jones MC, Armstrong CP (2007) The dynamic structure of management support systems: theory development, re-search focus, and direction. Management Information Systems Quarterly 31(3):579– 615
Cooper P, Dart E (2009) Change in the man-agement accountant’s role: drivers and di-versity. University of Bath, School of Man-agement, Bath
Daum JH (2008) Die Entwicklung der Rol-le des CFO in europäischen Unternehmen.
Zeitschrift für Controlling und Manage-ment 52(6):387–393
Davenport TH (2006) Competing on analytics. Harvard Business Review 84(1):98–107 Davila A, Foster G (2005) Management
ac-counting systems adoption decisions: evi-dence and performance implications from early-stage/startup companies. The Ac-counting Review 80(4):1039–1068 de Bruin T, Rosemann M, Freeze R, Kulkarni U
(2005) Understanding the main phases of developing a maturity assessment model. In: 16th Australasian conference on infor-mation systems (ACIS 2005). Sydney Dekleva S, Drehmer D (1997) Measuring
software engineering evolution: a Rasch calibration. Information Systems Research 8(1):95–104
Eckerson WW (2010) Transforming finance – how CFOs use business intelligence to turn finance from record keepers to strategic advisors. TDWI Research, Renton
Ernstberger J, Vogler O (2008) Analyzing the German accounting triad – “accounting premium” for IAS/IFRS and U.S. GAAP vis-a-vis German GAAP. The International Journal of Accounting 43:339–386
Esch D, Ganczarski W, Gohr V, Padberg J (2008) Serviceorientierte Strukturen zur Unterstützung eines integrierten Konzern-rechnungswesens – Exemplarisches Inte-grationsmodell für einen Telekommuni-kationskonzern. Zeitschrift für Controlling und Management (Sonderheft Unterneh-menssteuerungssysteme) 52:92–99 Frank U (2000) Evaluation von Artefakten in
der Wirtschaftsinformatik. In: Heinrich LJ, Häntschel I (eds) Evaluation und Evalua-tionsforschung in der Wirtschaftsinforma-tik – Handbuch für Praxis, Lehre und For-schung. Oldenbourg, München, pp 35–48 Fraser P, Moultrie J, Gregory M (2002) The use of maturity models/grids as a tool in assessing product development capability. In: IEEE international engineering manage-ment conference (IEMC 2002). IEEE Engi-neering Management Society, Cambridge, pp 244–249
Frezatti F, Aguiar AB, Guerreiro R, Gouvea MA (2009) Does management accounting play role in planning process? Journal of Business Research 64(3):242–249. http:// majmavaredat.com/media/file/english/ Does%20management%20accounting %20play%20role%20in%20planning %20process.pdf. Accessed 2012-05-20 Friedl B (2002) Controlling. UTB, Stuttgart Fuchs C, Bange C (2010)
Softwarewerkzeu-ge für die Finanzkonsolidierung: 19 Syste-me für die legale Konsolidierung und Ma-nagementkonsolidierung. BARC, Würzburg Gartner Inc (2010) Magic quadrant for busi-ness intelligence platforms. http://www. gartner.com/technology/media-products/ reprints/oracle/article121/article121.html. Accessed 2010-05-30
Gleich R, Greiner O, Hofmannn S (2006) Bet-ter, Advanced and Beyond Bugeting: Von der Evolution zur Revolution. In: Gleich R, Hofmann S, Leyk J (eds) Planungs- und Budgetierungsinstrumente: Innovative An-sätze und Best-Practice für den Manage-mentprozess. Haufe, Freiburg, pp 23–38 Gluck FW, Kaufmann SP, Walleck SA (1980) Strategic management for competitive ad-vantage. Harvard Business Review 58:154– 161
Hahn D, Taylor B (2006) Vorwort. In: Hahn D, Taylor B (eds) Strategische nehmensplanung – Strategische Unter-nehmensführung, 9th edn. Springer, Berlin, pp XI–XIV
Hansen SC, Van der Stede WA (2003) Multiple facets of budgeting: an explanatory anal-ysis. Management Accounting Research 15:415–439
Hevner AR, Chatterjee S (2010) Design re-search in information systems – theory and practice. Springer, New York
Hevner AR, March T, Park J, Ram S (2004) Design science in information systems re-search. Management Information Systems Quarterly 28(1):75–105
Horváth P (2006) Controlling, 10th edn. Vahlen, München
Kammer K (2005) Reporting internationaler Unternehmen – Auswirkungen der Harmo-nisierung und der Konvergenz des Rech-nungswesens in Europa. Gabler, Wiesba-den
Kaplan RS (1990) The four-stage model of cost systems design. Management Accounting 71(8):22–26
Kaplan RS, Norton DP (1996) The balanced scorecard: translating strategy into action. Harvard Business School Press, Boston Kaplan RS, Norton DP (2004) How strategy
maps frame an organization’s objectives. Financial Executive 20(2):40–45
Krönke B, Marx F (2008) Organisatorische Ver-änderungen als Problemstellung des Cor-porate Controllings bei der Continental AG. Zeitschrift für Controlling und Mana-gement (Sonderheft Unternehmenssteue-rungssysteme) 52:84–90
Lahrmann G, Marx F, Winter R, Wortmann F (2010) Business intelligence maturity mod-els: an overview. In: D’Atri A, Ferrara M, George JF, Spagnoletti P (eds) VII confer-ence of the Italian chapter of AIS (itAIS 2010). Italian chapter of AIS, Naples Lahrmann G, Marx F, Mettler T, Winter R,
Wort-mann F (2011) Inductive design of matu-rity models: applying the Rasch algorithm for design science research. In: Jain H, Sinha AP, Vitharana P (eds) Desrist 2011. Springer, Milwaukee
Levie J, Lichtenstein BB (2009) Final as-sessment of stages theory: introducing a dynamic states approach to entre-preneurship. College of Management working Papers http://scholarworks.umb. edu/management_wp/17. Accessed 2011-07-15
Machin JL (1995) Management control sys-tem: whence and whither? In: Emmanuel C, Otley D, Merchant KA (eds) Readings in accounting for management control. Chapman & Hall, London, pp 9–27 Malmi T, Brown DA (2008) Management
con-trol systems as a package – opportunities, challenges and research directions. Man-agement Accounting Research 19:287–300 March ST, Smith GF (1995) Design and natural science research on information technol-ogy. Decision Support Systems 15(4):251– 266
Marx F, Lahrmann G, Winter R (2010) Aligning corporate planning and BI: towards a com-bined maturity model. In: D’Atri A, Ferrara M, George JF, Spagnoletti P (eds) 7th con-ference of the Italian chapter of AIS (itAIS 2010), Naples
Mayer JH, Stock D (2011) Nutzertypen für die situative FIS-Gestaltung: Ergebnisse ei-ner empirischen Untersuchung. In: 10th in-ternational conference on Wirtschaftsinfor-matik, Zurich
McRoberts HA, Sloan BC (1998) Financial management capability model. Interna-tional Journal of Government Auditing 25(3):8–11
Mettler T, Rohner P (2009) Situational ma-turity models as instrumental artifacts for