AN EXPLORATORY STUDY COMPARING A LOW INCOME BLACK DOMINANT URBAN SCHOOL TO A LOW INCOME WHITE DOMINANT URBAN SCHOOL IN
TERMS OF SCHOOL QUALITY
Cassandra M. Shipp
Submitted to the faculty of the University Graduate School in partial fulfillment of the requirements
for the degree Doctor of Philosophy in the School of Education,
Indiana University February 2020
Accepted by the Graduate Faculty of Indiana University, in partial fulfillment of the requirements for the degree of Master of Arts.
Doctoral Committee
______________________________________ Jim Scheurich, Ph. D., Chair
______________________________________ Samantha Scribner, Ph. D. September 16, 2019 ______________________________________ Chalmer Thompson, Ph. D. ______________________________________ Monica Medina, Ph. D.
Acknowledgement
Cassandra M. Shipp
AN EXPLORATORY STUDY COMPARING A LOW INCOME BLACK DOMINANT URBAN SCHOOL TO A LOW INCOME WHITE DOMINANT URBAN SCHOOL IN
TERMS OF SCHOOL QUALITY
Urban Schools are often judge on the perceived shortcomings of students’
academic skills and family social economic status. This image is judged more negatively when students are mainly Black students from low-income homes. One of the main sources of that judgement is the overall letter grade each school receives as part of state accountability systems. When urban schools have a preponderance of low income white students (LIW) with higher letter grades than urban schools with a preponderance of Black students from low income homes (LIB), the typical conclusion is that the LIW schools are “better” than the LIB schools.
To see if this is validated in other areas of schooling, I selected four areas that it would be possible to use to “compare” in an exploratory fashion these two types of urban schools. Those four are: 1) teacher quality, 2) AP enrollment and completion data, 3) technology usage, and 4) graduation rates, for all of which data is available and/or can be collected. Thus, I will be exploring whether the school’s letter grade does distort the understanding or perception of quality for these two types of schools.
The findings of the study indicated that the LIB urban high school was not equal or better than LIW urban high school. Even though there was growth in the four focus areas and in the state accountability grade for LIB urban high school, the LIW urban high school outperformed the LIB urban high school in all areas. This study also confirmed
that the LIB urban high schools continue to have the less effective teachers in the classrooms, which leads to little to no change in educational quality.
______________________________________ Jim Scheurich, Ph. D., Chair
TABLE OF CONTENTS
CHAPTER ONE: INTRODUCTION ... 1
Summary of Literature ...2
Methodology ...9
Conclusion... 10
CHAPTER TWO: LITERATURE REVIEW ... 12
History of Accountability in Education ... 12
Federal Requirements of NCLB ... 16 Corrective Action ... 18 State of Indiana ... 19 Assessment Measurement ... 22 Urban Community ... 29 Teacher Quality ... 32 AP Enrollment ... 38 Technology Access ... 42 Graduation Rate ... 46
Assumptions of Families of Color and Low-Economic Status Families ... 49
Summary ... 51
CHAPTER THREE: METHODS ... 55
Epistemology Framework ... 55
Theoretical Framework ... 56
Measures ... 60
Document Review ... 60
Teacher Quality ... 60
AP Enrollment and Success ... 60
Technology Access ... 61 Graduation Rate ... 61 Interviews ... 61 Research Participants ... 62 Research Setting ... 63 Data Collection ... 63
Time Frame of the Study ... 64
Research Process ... 64 Data Analysis ... 65 Synthesizing Data ... 65 Trustworthiness ... 66 Positionality in Research ... 67 Conclusion... 68
CHAPTER FOUR: RESULTS ... 70
Introduction ... 70
Demographics of the Two Schools ... 70
Teacher Quality Scores by Schools ... 74
Interview Results on Teacher Quality ... 75
General Discussion of the Evaluation of Teacher Quality ... 75
Discussion of the Teacher Quality Evaluation Tool ... 81
My Reflection on the Teacher Quality Evaluation Tool ... 86
Discussion of the Relation of Teacher Quality to School Grade ... 88
My Reflection on the Relation of Teacher Quality to School Grade ... 90
Advanced Placement Scores by Schools ... 91
Interview Results on Advanced Placement ... 92
General Discussion of the Evaluation of Advanced Placement ... 93
My Reflection on the Evaluation of Advanced Placement ... 96
Discussion of Student Recruitment in Advanced Placement Classes ... 98
My Reflection on Student Recruitment in Advanced Placement Classes ... 101
Discussion of Student Retention in Advanced Placement Classes ... 102
My Reflection on Student Retention in Advanced Placement Classes ... 105
Discussion of Relation of Advanced Placement to School Grade ... 105
My Reflection on Relation of Advanced Placement to School Grade ... 107
Technology Access by School ... 108
Interview Results on Technology ... 109
General Discussion of the Principal Contribution to Technology Access ... 109
My Reflection on Principal Contribution to Technology Access ... 110
Discussion of Maintaining Technology Access in The Building ... 111
My Reflection on Maintaining Technology Access in The Building ... 114
Discussion of the Teacher and Student Expectation of Technology Usage ... 115
My Reflection on Teacher and Student Expectation of Technology Usage ... 122
Discussion of Relation Technology Access to School State Accountability Grade ... 124
My Reflection on Relation Technology Access to School State Accountability Grade ... 125
Graduation Rate by Schools ... 127
Interview Results on Graduation Rate ... 128
General Discussion of the Evaluation of Graduation Rate... 128
My Reflection on Evaluation of Graduation Rate ... 131
Discussion of Strategies Used to Sustain or Improve the Graduation Rate ... 132
My Reflection on Strategies Used to Sustain or Improve the Graduation Rate ... 140
Discussion of the Reasons Students Do Not Earn Their High School Diploma in Four or Five Years ... 142
My Reflection on Why Students Do Not Earn Their High School Diploma in Four or Five Years ... 148
Discussion of Relation of the Graduation Rate to School Grade ... 149
My Reflection on Relation of the Graduation Rate to School Grade ... 150
CHAPTER FIVE: CONCLUSION, DISCUSSION, AND FUTURE CONSIDERATION ... 152
Introduction ... 152
Recent Research Literature and Connection to Research Study ... 153
Teacher Quality ... 153
Technology Access ... 160
Graduation Rate ... 162
Defining Urban and Its Intersection with Race ... 164
Implication of Study ... 172
Implications of the Study for Research, Policy, and Practice ... 176
My Experiences with this Study ... 177
Conclusion... 180 References ... Error! Bookmark not defined. Curriculum Vitae
LIST OF TABLES
Table 1. White Urban High School Teacher Ethnicity ... 70
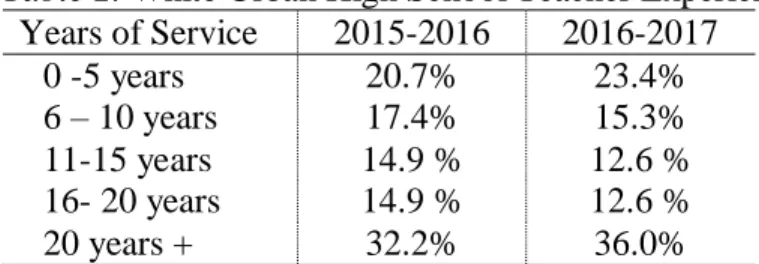
Table 2. White Urban High School Teacher Experience ... 71
Table 3. White Urban High School Student Enrollment ... 71
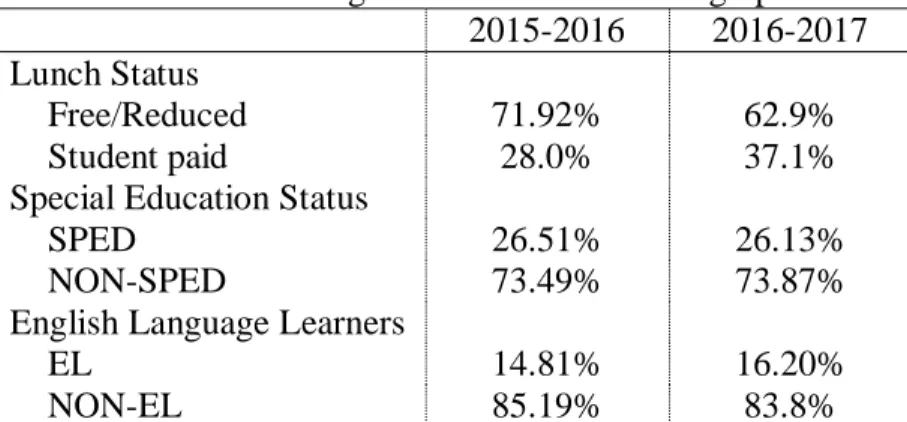
Table 4. White Urban High School Student Demographics ... 72
Table 5. Black Urban High School Teacher Ethnicity (2015-2016) ... 72
Table 6. Black Urban High School Teacher Experience ... 72
Table 7. Black Urban High School Enrollment Ethnicity ... 73
Table 8. Black Urban High School Student Demographics ... 73
Table 9. Urban High School Evaluation of Teacher Effectiveness ... 75
Table 10. School Student Centered Accountability Grade ... 89
Table 11. AP Testing Participants LIB/LIW ... 92
Table 12. State Student Center Accountability CCR Indicator... 92
Table 13. District Technology Plan ... 109
CHAPTER ONE: INTRODUCTION
Urban schools are often judged on the perceived shortcomings of students’ academic skills and socioeconomic status (Milner, 2012). For some, the term urban schools often evokes images of dilapidated school buildings located in poor inner-city neighborhoods populated with mainly African American or Hispanic students (Jacob, 2007). This image is judged more negatively when students are mainly Black students from low-income homes. One of the main areas of that judgement is the overall letter grade each school receives as part of state accountability systems (Indiana Administrative Code, 2015). When urban schools have a preponderance of low income White students (LIW) with higher letter grades than urban schools with a preponderance of Black students from low income homes (LIB), the typical conclusion is that the LIW schools are “better” than the LIB schools (Filgio & Hart, 2015; Milner, 2012; Rockoff & Turner, 2010). However, based on the author’s professional experience as a school administrator working in both of these types of urban schools, the state accountability letter grade may not accurately reflect the quality of the two types of schools. Consequently, the focus for this study is to compare one reasonably similar example of each of these two kinds of schools (LIW and LIB) to explore whether the letter grade distorts differences in quality. Four areas were thus selected to compare LIW and LIB schools in an exploratory study. Those four areas were: 1) teacher quality, 2) Advanced Placement (AP) enrollment and completion data, 3) technology usage, and 4) graduation rates.
The rationale for selecting teacher quality is it has a large effect on student achievement (Buddin & Zammarro, 2009). Next, AP enrollment and completion data are a category that contributes to the high school overall grade in Indiana (Indiana
Administrative Code, 2015). Third, technology is the main tool used to assess students on state assessments, and using technology has become an essential education outcome (Ross, Morrison, Lowther, 2010). Lastly, the graduation rate is selected because it contributes to the high school overall grade in Indiana (Indiana Administrative Code, 2015).
It is important, however, to highlight that this is an exploratory study. Thus, this study did not establish cause and effect to prove that the letter grade distorts the
perception of the quality of these two types of urban schools. Instead, this study explored whether there may be suggestive value to this possibility in terms of whether the letter grade distorted the understanding or perception of quality in these two types of schools.
The data collected to undertake this exploration are in the four designated areas of teacher quality data, AP enrollment and completion data, technology usage data, and graduation rate data. In addition, data were collected from individual interviews of one participant, the principal, from each school district. These individual interviews provided additional insights and perceptions of the four designated areas of data. The timeline for collecting this data are as follows 1) IRB approval by end of summer, 2018; 2) data collection from August 2018 through December 2018; 3) analysis and writing complete by July 2019; 4) Defense of dissertation Fall of 2019.
Summary of Literature
The history of accountability in education, federal requirements of No Child Left Behind (NCLB), assessment measurement, urban community make-up, teacher quality, AP enrollment, access to technology, and graduation rates were examined to establish background information to support the study. Review of literature related to the history of
assessment accountability in education that began in the 1920s was completed first. In the 1960s, the introduction of high-stakes testing was preceded by decades of earlier attempts to improve education in the United States (Minarechova, 2012). This high-stakes testing led to the adoption of an education law for elementary and secondary schools, called the Elementary and Secondary Education Act of 1965 (ESEA), which consisted of the subsequent development and introduction of minimum qualification tests. President George W. Bush signed NCLB in 2002. According to the United States Department of Education (2001), NCLB (2001) provided each state’s schools with guidance to establish annual assessments, demand progress, improve poorly performing schools, create
consequences for failure, and protect home and private schools.
With the new guidance in the NCLB, the information on the federal requirements of this policy were further examined. As part of the accountability requirements, states must have an annual assessment in mathematics and language arts in grades 3-10, and each state may select or design assessments of their choosing (NCLB, 2001). In addition, the states must provide a plan on how to improve literacy in early grades. The NCLB policy includes that states must develop a system of sanctions and rewards to hold districts and schools accountable for improving academic achievement for all students. Overall, the NCLB (2001) policy was designed to ensure all students were growing, and that schools were held accountable for academic growth or lack thereof for students.
However, for students to show academic growth, assessments had to be designed to measure it. Information on how assessments measure students’ academic growth was examined. Popham (1999) defines a standardized test as “any examination that is administered and scored in a predetermined, standards manner” (p. 8). Additional
literature defines a standardized test as any form of a test that requires all test takers to answer the same questions and is scored in a standard manner that makes it possible to compare the performance of individuals or groups of students (Russell, 2010). One type of standardized assessment is an achievement test. An achievement test measures the knowledge and skills students learn in school, or it determines the academic progress they have made over a period of time (Edglossary.org, 2015). There are two types of
achievement tests: summative and formative. Summative tests can be used to identify topics and skills that students have mastered or areas where they need development (Russell, 2010). Formative testing is the process of collecting information about a student’s knowledge and understanding prior to or during instruction for the purpose of informing instruction or assisting students in improving their work (Russell, 2010). There are two types of inferences educators can glean from testing results. These types are the students’ relative strengths and weaknesses within a given subject area with a sufficient number of test items and student’s growth over time in different content areas (Popham, 1999). In recent research (Russell, 2010), it has been found that a student’s
socioeconomic status is highly correlated with standardized test scores, as many test items focus on assessing knowledge or skills learned outside of schools.
If a student’s outside (i.e., non-school) learning in the community is considered in state standardized assessments, it is essential to define an urban community since the study in situated there. An urban area is defined as an area that is very well developed with a density of human structures such as houses, commercial buildings, roads, bridges, and railways (National Geographic, 2017). In addition, an urban community is often defined as students of color and students from low-income families in densely populated
areas primarily attending urban schools (Buddin & Zamarro, 2009). The term “urban” also carries additional meaning in the field of education. Milner (2012) best describes urban schools in three ways, which are urban intensive, urban emergent, and urban characteristic. Urban intensive is descriptive of schools in highly concentrated metropolitan cities with an average of one million plus people in the area. Urban
emergent is descriptive of schools located in an area with fewer than one million people and some issues with scarcity of resources. An urban characteristic school is descriptive of schools located in a mid-sized city that starts to experience some of the challenges associated with intensive and urban emergent schools.
However, some perceive urban schools as being composed of a high
concentration of African Americans and other racial and ethnic groups, high poverty rate of African American students and other racial and ethnic groups, and a high student mobility rate (Kincheloe, 2004; Lalas, 2007). Another common perception is that African American students encounter low student achievement, inadequate school readiness, lack discipline, and language barriers (Thompson et al., 2005). In addition, it is perceived that urban schools have less educated and poorly trained teachers (Milner, 2006).
Furthermore, Hill, Friedland, and Phelps (2012) stated that White teacher candidates have stereotypical perceptions of urban schools, such as a commitment to doing missionary work, culture blindness, and apprehension about educating students of color. When there are such perceptions about poorly trained teachers or missionary teachers, there are also perceptions of high turnover rates of teachers in urban schools. This high turnover rate and the lack of preparation of teachers in African American urban schools tend to lead to racism in classrooms (Allen & Griffin, 2006, Caruthers & Friend, 2012; Jacob, 2007).
Given these perceptions, it is not surprising that Black students respond negatively to urban teachers. According to Patterson, Hale, and Stesson (2007):
Black students express that when Black students fail, the teachers assume all students are bad. It is not right how they criticize us and put us in categories. Some of us do care about our grades. We want to graduate and we want to make good grades, but teachers just do not make it fair enough for us to do that. (p. 5)
That teachers have such attitudes is supported by Ford and Quinn (2010) who stated that White teachers are more likely to hold low expectations for students of color than for White students.
Ford and Quinn (2010) concluded that White Americans traditionally question the intelligence of students of color. Moreover, when White students are described as more intellectual, it creates limited access to Advanced Placement (AP) courses for African American students and low economic status students (Allen and Griffin, 2006). It is clear then that racialized perceptions and treatment of African American students and other students of color impact not only public perceptions of urban schools, but also impact educators working in urban schools.
In response to this impact on teachers, qualities needed from urban teachers were examined. Quality means a distinctive attribute or characteristic possessed by someone or something (Merriam-Webster, 2017). Peske and Haycock (2006) found large
discrepancies in the qualifications of teachers in diverse, high poverty schools versus teachers serving in schools with few students of color and students from low-income backgrounds. However, low-income students and students of color have higher
performance gains with higher teacher quality. According to Grant and Gillette (2006), effective teachers take into account that academics, as well as social achievements, do not
being, “a system of socioeconomic stratification, class-structure, social institutions, or other patterned relations between large social groups” (Talbert-Johnson, 2006, p. 153). Ohrt and Lambie (2009) wrote that Latinx and African American students often
experience oppressive practices inside and outside schools that prevent them from pursuing high-level classes. Those oppressive practices were retention, standardized testing, tracking, and discipline policies. Further, some oppressive practices consisted of school educators having low expectations for African American students’ abilities and aspirations. In other research, Brak, Garnett, and Burley (2011) identified financial resources, limited vision toward higher education, and unrealistic academic goals for schools in offering AP courses. Thus, a student in a particular social structure may have limited access to quality teachers and limited access to AP courses.
After reviewing the lack of quality teachers in urban schools, the areas of enrollment and access for students of color in AP courses in high schools was explored. AP courses are rigorous, college-level classes in a variety of subjects that give students an opportunity to gain the skills and experiences colleges recognizes (College Board, 2017).Griffin and Allen (2006) wrote that urban schools lack rigorous courses because of the larger class sizes, outdated libraries, and minimum offerings of AP courses. In
addition, urban students tend to have difficulty with AP accessibility due to poor treatment by teachers and gaps in skills for AP classes due to teachers’ lack of desire to educate them well (Ford & Quinn, 2010). In contrast, Ohrt and Lambie (2009) noted that educational programs that promote equal access to higher education for traditionally underserved students do exist. Two examples are Advancement Via Individual Determination (AVID) and Early College programs. In these educational programs,
students of color gain more access to AP classes and exposure to technology as an expectation.
Teachers and students from higher income families have been found to use technology in school and at home more than students from lower income families (Song & Owens, 2011). Teachers and students of color in urban schools with low-income backgrounds have experienced less access to computers as compared to Whites from higher income backgrounds in rural and suburban schools. Urban schools with students from lower income families are only half as likely to have Internet access compared to schools that serve students from higher income families (American Council of Education, 2003). Moreover, African Americans and Latinx students who are poor and considered working class, lack access to information and technology resources (Owen & Song, 2011). According to Owen and Song:
In order for technology to have a major influence on the educational system, teachers and students must not only have access to technology, but access to technology in a contextual matter that is cultural relevant,
responsive, and meaningful to their educational practice to promote quality teaching and active student learning. (2011, p. 24)
The lack of technology exposure to keep students engaged in school could contribute to high school dropout.
The last area examined was the graduation rate of urban students. NCLB (2001) requires districts to annually prepare and disseminate local report cards with information that includes the graduation rates as part of state accountability. In response, descriptions of urban schools, including high dropout rates and low graduation rates, have
unfortunately become the norm (Patterson, Hale, & Stessman, 2007). This norm is derived from the “assumption that the dropout problem is due to the student and his or
accountability for students’ progression to earning high school diplomas, students could be coded as disappearing from the district or not enrolled in the district. This type of coding gives a picture of a school with a high dropout rate because the school does not know the whereabouts of the student.
Methodology
The setting for this mixed methods study was a predominantly White urban high school and a predominantly African American urban high school. The collection of the data was completed in one semester during the typical public school year. The data analysis and written findings were completed within six months after the conclusion of data collection. The data from the four areas, individual interviews, and focus group were analyzed as each set of data were collected and until the end of the research period. An interview was completed during the semester with one administrator from each school district. The administrators had an individual interview in November or December. After the individual interviews were completed, the focus group occur in January/February.
First, there was a collection of data in the following selected areas: 1) teacher quality, 2) AP enrollment and completion data, 3) technology usage, and 4) graduation rates. This was followed by analyzing the data to develop the questions for the two individual, semi-structured interviews. Next, there was a selection of one administrator from each urban school district with experience in the four areas. After the selection of participants, the recorded semi-structured interview wasconducted with each
administrators for an average of fifty to sixty minutes. The purpose of the interviews was to obtain educational background information on each participant, their understanding of the state accountability system, perceptions of the graduation rate, AP courses and
enrollment, access to technology, and teacher quality in secondary high schools. After each semi-structured interview was completed, data were reviewed by memoing and noting themes. Memoing was the writing of a document that tracks any ideas the researcher comes up with when reading notes and interviews (Hesse-Biber & Leavy, 2011). Lastly, a month after the semi-structured interview of the second administrator, a focus group was conducted that consisted of the school administrators. The recorded focus group was conducted in two hours. The focus group did not solely include questions and answers, but included the interaction between the participants and their points of view (Hesse-Biber & Leavy, 2011). Also, in the focus group, findings from the individual interviews were discussed.
After the completion of the interviews and focus group, the audio recorded interviews were transcribed. The “transcription process is transferring oral words to written words” (Hesse-Biber & Leavy, 2011, p. 303). Furthermore, “transcription will allow me the opportunity to be actively involved with my research from the beginning of the data collection” (p. 304). The researcher reviewed the transcription of all interviews verifying common and recurring themes and drawing conclusions. The themes that continuously occurred throughout the analysis were validated by trustworthiness. The trustworthiness measures included credibility, transferability, confirmability, and dependability (Hesse-Biber & Leavy, 2011). Data analysis was ongoing and completed with six months.
Conclusion
At the completion of this study, this exploratory study helped explain how the areas of graduation rate, teacher quality, access to technology, and AP enrollment aligned
(or not align) with the state accountability grade of each school. In addition, the
discussion included the importance of comparing an urban White high school to an urban African American high school, and the perceptions developed based on data shared with the public. In addition, I determined whether qualitative data with quantitative data can provide sufficient information about the perceptions of the two different high schools based on the data collected in the four areas and the state accountability grade. The information obtained from the study may be essential for urban school districts and states as it may either validate state accountability systems or problematize them. In my
estimation, whatever answers this exploratory research provided, it is critically important to understand whether state accountability systems well represent the successes of an urban school.
CHAPTER TWO: LITERATURE REVIEW
This chapter serves as a review of literature on the history of educational accountability in public schools, the federal law of No Child Left Behind Act of 2001 (NCLB), and Indiana’s compliance with NCLB. In this review, the essential components of the federal law and Indiana state law that determine the accountability system for Indiana schools will be highlighted. The definition and characterization of an urban school district or school will be explained. In addition, literature on the interpretation of assessment data of students that are used in the academic accountability of schools will be reviewed. Finally, the areas of teacher quality, AP courses, technology in schools, and graduate rates of students from urban schools that can determine how schools are rated in an accountability system will be reviewed.
History of Accountability in Education
Stoskopf (1999) wrote that during the 1920s and 1930s educational assessments were developed to assess African Americans intellectual abilities for the workforce. According to Stoskopf, Lewis Terman was a White educational researcher from Stanford University who developed the IQ tests. The assessments were designed to determine the intellect of African American students in schools in order to develop various types of educational programs needed for future jobs. As African Americans intellectual abilities became publicly known, White people developed fears of African Americans’ intellectual abilities; therefore, the Immigration Restriction Act of 1924 was voted on, maintaining racial impurities in the United States. For this purpose, the Immigration Restriction Act set extreme quotas based on a person’s race and nationality. The Act favored people of western and northern European origin. In the1920s, the Immigration Restriction Act
caused a division of students in schools based on IQ tests. In addition to the tests being used to track African American students, students with special needs were tracked in schools. According to Stoskopf, “Terman and other educational psychologists convinced many school districts to use high-stakes and culturally-based tests to place slow students into special classes, rigid academic tracks, or entirely separate schools” (p. 36).
Consequently, this led to decades of high-stakes testing in United States schools. The introduction of high-stakes testing was preceded by decades of earlier attempts to improve education in the United States (Minarechova, 2012). High-stakes testing led to the adoption of an education law for elementary and secondary schools, called the Elementary and Secondary Education Act of 1965 (ESEA), which consisted of the subsequent development and introduction of minimum qualification tests for students. The minimum qualification tests were math, reading, and writing. During the introduction of minimum qualification tests, there was almost no impact found, positive or negative, from the teachers’ instruction on the schools’ academic improvement. Interestingly, these assessments have been criticized “for being relatively easy to pass since they were
concerned with only minimum requirements to be learned of the achievement floor and not the achievement ceiling” (Nichols & Berliner, 2007, p. 4). Consequently, ESEA had an unquantifiable impact on the expansion of standardized testing in United States schools (Duncan & Stevens, 2011; Sacks, 1999). However, with the expansion of standardized testing, the United States needed a national standardized test to measure what students could do. The National Assessment of Educational Progress (NAEP) was the test that was subsequently created to provide this information on students beyond the minimum qualifications.
In 1969, NAEP was launched and represented a major step towards national assessment (Grant, 2004), especially since this assessment was the first to assess students on science. The NAEP was a mandatory assessment designed to measure what students knew and could do. The testing was conducted periodically in reading, mathematics, science, writing, social studies, civics, United States history, geography, citizenship, literature, music, career development, art, and computer competence (Johnson, 1992). Students in 4th, 8th and 12th grade were randomly selected to participate in NAEP. Since 1969, NAEP has been the sole, ongoing national indicator of what students in the United States know and what they can do in major academic subjects (Grant, 2004). With the continuation of NAEP being used as a national test, the National Assessment Governing Board was established for the purpose of setting the policy for NAEP. The Governing Board selects the subject areas to be assessed, develops assessment objectives and specifications, and determines appropriate student achievement levels as a congressional responsibility. In comparison to an IQ test, the NAEP selection of subject areas
assessment revealed significant national limitations teaching and learning in the
classroom compared to foreign countries. As a result of the information, the United States needed to review and develop a more rigorous law to address the education law.
The U.S. limitations in teaching and learning over the next twenty years was published in a report from the Presidential Office in 1983 and was titled, A Nation at Risk (Minarechova, 2012). The A Nation at Risk report pushed the topic of quality education onto the national political agenda, as it suggested that United States education was of lesser quality than education in other countries. The report implied that foreign
countries produced better and more educated workers than did United States schools. Accordingly, the results from standardized tests were argued to be an indication of the true status of national education (Duncan & Stevens, 2011). For that reason, a “test boom” resulted, and state governors began testing all students with the aim of improving the economy (Duncan & Stevens, 201; Fiske 2008). Thus, based on the NAEP
assessment results, educational experts were directed to develop a plan to improve the United States education accountability system.
The National Education Summit in Charlottesville, Virginia, was held in September, 1989, with a focus on how to improve the United States educational performance compared to foreign countries (Minarechova, 2012). The result of this summit was a renewed federal commitment to improving educational achievement and increasing the nation’s commitment to students, teachers, and schools through the
passage of No Child Left Behind (NCLB), signed by President George W. Bush in 2002. Some of the data, according to NCLB (2001), indicated that nearly 70% of inner city fourth graders were unable to read at the basic level and that high school seniors in the Unites States trailed Cyprus and South Africa in mathematics (NCLB, 2001). In addition, “a third of freshman in college will enroll in remedial courses before beginning college level courses” (NCLB, 2001, p.1). Based on the data, NCLB focused on three four main aspects: flexible and local control, consolidation of parental control, and a focus on the operation of the system (Lobascher, 2011; United States Department of Education, 2007). As part of the main four aspects of NCLB, there was a legal requirement of annual testing of students. This was the first time in United States history that children were tested in all public schools and the results were used as an accountability component (Duncan &
Stevens, 2011; Matthews, 2006). Ironically, the tests were referred to as “high-stakes” because they had the ability to change the academic courses students could be enrolled in as a result of the implications associated with progress in test scores (Duncan & Stevens 2011). For example, students’ scores on the “high-stakes” test could determine if they were placed in remediation, general, honor, or AP courses. All schools were expected to address how to close the academic achievement gap for all students based on test results. Furthermore, NCLB (2001) consisted of requirements all states had to develop for schools to adhere to for academic accountability for all students.
Federal Requirements of NCLB
According to the United States Department of Education (2001), the NCLB (2001) provided the states’ schools with guidance to establish annual assessments, demand progress, improve poorly performing schools, create consequences for failure, and protect home and private schooling. In addition, the “Reading First” initiative gave states funding to promote literacy through comprehensive research-based programs. Under provisions of the No Child Left Behind Act of 2001 (Public Law 107–110), Congress authorized the continuance of its mandate for determining the content and format of NAEP assessments. While NCLB required NAEP to assess reading and
mathematics every two years in 4th and 8th grade, the legislation permitted the assessment of other subjects such as science, writing, United States history, civics, geography, and other areas to the extent time and resources were available (NCLB, 2001). In the area of closing the academic gap, the NCLB policy included that states must develop a system of sanctions and rewards to hold districts and schools accountable for improving academic achievement for students. As part of the accountability requirements, states were required
to have an annual assessment in math and E/LA in grades 3-10, but each state may select or design assessments of their choosing. In addition, the states had to provide a plan on how to improve literacy in early grades. In sum, the NCLB (2001) was designed to ensure all students were academically growing, and schools were held accountable for academic growth or lack thereof for students.
NCLB was enacted to ensure educational accountability (Oluwole & Green, 2009). Any states receiving federal funds, such as Title I funds were required to implement an accountability system based on the state standards and summative
assessments. Furthermore, states and school districts had to disaggregate data on a yearly based on several categories including math, reading, and language arts for 3rd through 8th grade (Oluwole & Green, 2009). Some of the categories included ethnic groups,
socioeconomic status, students with disabilities, gender, and English Language Learners (ELL). According to Duncan and Stevens (2011), based on the overall performance of the students in each grade level and core testing areas, schools were placed in a performance category marked by grades A-F. The definition of performance of students is scoring the minimum points set by the state that indicates mastery of the subject on a standardized test. The results of the standardized tests were an indication of the true performance status of students in the United States (Duncan & Stevens, 2011). The status of the United States’ nation education is the overall average of mastery level of students in grades 3-10 in tested subject areas. If any school performs below the minimum requirement, sanctions were placed on the school to support improvement areas.
According to Oluwole and Green (2009) “Under the NCLB's accountability system, districts failing to make adequate yearly progress (AYP) on state assessments
were subject to sanctions under the Act, including State takeover of the district” (p. 3). When a school performed below the minimum requirements, it could receive Title 1 funding to help with academic performance. For this purpose, the concept of AYP under Title I included an emphasis on accountability of schools and school districts receiving Title I funds rather than emphasizing the Title I program itself or even the yearly performance gains of participating children. AYP is defined by a State as the amount of yearly improvement each Title I school and district is expected to make in order to enable low-achieving children to meet high performance levels expected of all children (United States Department of Education, 2009). Each state’s definition of adequate progress must be based primarily on its final assessment system included in the state’s corrective plan.
Corrective Action
States must develop a corrective action plan for schools that fail to educate disadvantaged students. In the NCLB Act of 2001, the first corrective action is schools and districts that have not made adequate yearly progress for one academic year will be identified by the district or state as needing improvement. The second corrective action plan is that districts failing to make AYP for two consecutive years must be identified at the performance category as improvement and develop a needs improvement plan (Oluwole & Green, 2009). Furthermore, “districts not making AYP for four consecutive years are identified for corrective action” (pg. 5). As a result, the state must take at least one corrective action under NCLB to address the failure of the district to make AYP. By a third corrective action, districts are to replace personnel that had a connection to the failure of the district, and appoint a new trustee through the state department of education
to manage the district's affairs or restructure and dissolve the school district (No Child Left Behind, 2001).
Disadvantaged students are defined as lacking in the basic resources or conditions believed to be necessary for an equal position in society (Merriam-Webster, 2017). Another supporting definition of disadvantaged students is students whose family, social, or economic circumstances hinder their ability to learn at school (RAND, 1994).
According to NCLB, “schools would receive assistance to improve the academic
performance of students, if the school continues not improving academically, the school district can use Title I funds to transfer to a higher-performing public or private school, or receive supplemental educational services from a provider of choice” (No Child Left Behind, 2001, p.14). The NCLB caused states to develop a state bill to comply with the federal law to prevent federal sanctions on the state and schools. Along with developing a corrective action plan, the states must develop a reward system for schools that have made progress in closing academic gaps. The reward will be “honored from a school bonus fund and an Achievement in Education state bonus fund” (p. 14). All states have to develop rewards and corrective action plans and regulations for school accountability per NCLB. Indiana is a state that has been in compliance with NCLB. Indiana has each area of accountability written for all school districts to address students’ academic
performance.
State of Indiana
The state of Indiana implemented statewide testing in 1987 to measure student achievement of core subjects. According to an article written by the Indiana Senate Democrats (INSENDEMS) in 2015, the assessments were administered annually to third
through eighth graders in English and mathematics. The length of time for the
assessments for students varied from twenty to sixty-five minutes. In 1999, the Indiana General Assembly established a performance accountability system based on student performance calledIndiana Statewide Testing for Educational Progress (ISTEP) (Indiana Senate Democrats, 2015). A school’s overall performance on the ISTEP determined the progress category the school was placed in, such as academic probation to exemplary progress. In 2010, the State Board of Education adopted the Common Core standards and in 2011, the Indiana State Board of Education changed to an A-F accountability system.
The A-F accountability system is letter grades assigned to elementary and middle schools based on English/Language Arts and mathematics percentage scores of students that passed the mandatory statewide annual assessment and participation rate. The specific accountability areas for K-8 schools are participation, performance of the students in the top 75%, and the performance of students in the bottom 25% (Indiana Administrative Code, 2015). The number of students who are enrolled in the school and the number of students who took the assessment determines a participation rate. The final scores for English/Language Arts and mathematics are weighted equally to determine the final overall grade. The letter grades are determined for high schools by establishing the English/Language Arts score and mathematics score based on the percentage of students that passed the mandatory statewide annual assessment. The number of students who are enrolled in the school and took the assessment determines a participation rate. In high school, the categories are graduation rate, college and career readiness, percentage of students passing the graduation examine for the first time compared to the 8th grade passing scores. The final score for English/Language Arts and mathematics are then
weighted to determine the final performance and improvement points. Additional
categories are a high school’s four-year graduation rate, the percentage of a high school’s students who have college and career readiness courses, percentage of graduates who passed an Advanced Placement exam, percentage of graduates who passed an
International Baccalaureate exam, and percentage of graduates who received dual college credit or an industry certification. The performance points of graduation rate and college and career readiness are then weighted to determine the final overall grade. The Indiana A-F accountability model revealed that not all Indiana schools had the same access to curriculum to meet the categories in the model. Therefore, Indiana needed to include common standards to make sure all schools were teaching students the same standards and providing access to curriculum. In 2013, House Bill 1427 was passed in session to pause the implementation of Common Core standards in schools.
The passage of House Bill 1427 allowed for a review of the academic standards of Common Core. A year later, in 2014, Indiana decided not to implement the Common Core standards, but modified common standards for Indiana students. Therefore, school districts needed to determine what standards were to be taught in schools based on Indiana standards and what standards would be assessed on the state test. In addition, in 2014, the new Superintendent of Public Instruction modified the A-F accountability model. By April 2014, the Indiana State Board of Education approved the College and Career Ready Standards. This still left school districts to develop curriculum maps and purchase materials in a short amount of time with the expectation of the new standards being taught in schools in the same year. In addition, with the new standards in the Fall of 2014, there was a new assessment in Spring 2015 on the College and Career Ready
standards (Indiana Senate Democrats, 2015). The third through eighth grade new test consisted of new standards and high schools had to administer two different tests to students based on their cohort year. As the new ISTEP+ was administered in Spring 2015, the length of time was noted as longer than previous state assessments. This new assessment determined the academic performance categories schools were placed in the A-F model.
The state of Indiana compliance with NCLB and continued interventions within failing schools led to the development of HB 1638. HB 1638 provides additional guidance for schools in Indiana to be placed in categories of A-F grades based on the overall student performance in particular areas and included in transformation zones. Transformation zones consist of schools that are placed in the lowest two categories, which are D and F. House Bill 1638 was originally about “transformation zones,” but it was rewritten to speed up the timeline by which a failing school can be taken over by the state if the school receives an F consecutively for four years (Indiana House Bill, 2015). The placement of schools in the A-F model in Indiana is primarily based on a
standardized state test. This standardized test requires educators to have a clear understanding of what is being measured of students.
Assessment Measurement
A standardized test is “any examination that is administered and scored in a predetermined, standards manner” (Popham, 1999, p. 8). Additional research literature defines a standardized test as any form of test that requires all test takers to answer the same questions and is scored in a standard manner that makes it possible to compare the performance of individuals or groups of students. One type of standardized assessment is
an achievement test. The achievement test measures the knowledge and skills students learn in school or to determine the academic progress they have made over a period of time (Edglossary.org, 2015). Two types of achievement test are summative and formative. Summative tests can be used to identify topics and skills that students have mastered or need to development (Russell, 2010). An example of a summative
achievement test is Indiana ISTEP or NAEP. Another type of assessment is formative, which collects and analyze information about student’s knowledge and understanding prior and during instruction. A second type of standardized test is aptitude. An aptitude test predicts a student’s ability to succeed in an educational setting (Edglossary.org, 2015). One example of an aptitude test is the Cognitive Ability Test. According to Popham (1999), standardized achievement tests need to accomplish their measurement mission with a smaller collection of test items within the test time that is allowed for students. This leads to not assessing students’ knowledge and skills in the content area, but comparing them to their peers’ ability level. This makes the goal of developing a test that captures student’s skills and knowledge of a subject area difficult for test developers.
The first goal of the assessment developers of standardized test is “to create instruments that with a handful of items, yields valid norm-referenced interpretations of a student’s status regarding chunking of content” (Popham, 1999, p. 9). Norm-referenced interpretation is scores indicating how an individual compares with other individual scores. Standardized achievement tests should be used for comparison and interpretation of students nationally in a content area. On average, fifty percent of a student population can answer correctly the items selected versus one hundred percent which leads to discriminating among students. Popham writes that standardized achievement tests
supply evidence needed to make norm-referenced interpretations of students’ knowledge and skills in relation to those students nationally. Another goal is for assessment
developers to create a tool that allows someone to make valid inferences about
knowledge and/or skills that person has within particular content areas possess (Popham, 1999). The creation of these assessment tools has provided relative nationwide
comparison data of students’ content area mastery. Furthermore, the inference should be norm-referenced so students’ knowledge or skills are comparable nationally to other students of the same grade and age. There are two types of inferences educators can gain from testing results.
The first is the inference of students’ strengths and weaknesses across subject areas. It identifies students’ relative strengths and weaknesses within a given subject area with sufficient numbers of test items (Popham, 1999). According to Popham, there should be a sufficient number of test items on assessments to allow meaningful within-subject comparisons of students’ strengths and weaknesses. The second inference of student’s strengths and weaknesses is based on standardized achievement tests and a student’s growth over time in different content areas. Standardized achievement test scores should be regarded as rough approximations of a student’s status regarding the content domain represented by the test. With this useful information on students’
knowledge and skills in a content area, standardized achievement tests should not be used to evaluate the quality of education due to external factors.
Popham (1999) writes standardized achievement tests should not be used to judge the quality of education, because students’ scores on a test do not provide an accurate index of educational effectiveness, “Any inference about educational quality made on the
basis of a student’s standardized achievement test performance is apt to be invalid” (p.10). However, educators in the United States are being evaluated on the basis of their students’ performances on tests that are created to produce comparative score
interpretations rather than measuring instructional quality (Popham, 2014).
In addition, Popham (2014) writes teachers are responsible for teaching certain skills and bodies of knowledge that are measured by achievement tests. There is knowledge brought to schools that is not assessed on achievement tests, and that are of value to a student’s academic development. Although educators have been urged to evaluate schools and teachers using student performances on educational tests, there is no meaningful evidence at hand indicating that these tests can distinguish between well-taught and poorly well-taught students. There are additional reasons not to use standardized achievement test to compare the quality of education in a school.
The first reason for not using standardized achievement tests is the different standards in the states, as well as within each state’s local school districts. It is difficult for large testing companies to create assessments tailored for every state and local school districts. According to Popham (1999), “Test developers are obliged to create a series of one-size-fits-all assessments” (p.10). The test developers do their best to select test items that are likely to be taught in a content area, without regard to the state a student lives in. As a result, the tests do not address all the needs of states and local school districts to assess their students properly, or to obtain the most accurate information. Standardized achievement tests will always contain many items that are not aligned with what is emphasized instructionally in any particular educational setting. An example of this mismatch is the study in 1983 by Freeman and colleagues where they identified items on
five nationally standardized achievement tests in mathematics in grades fourth through sixth and reviewed the information in the textbooks the students used in schools. The researchers identified the items in the standardized achievement test that had not received meaningful instructional attention in the textbooks. In the research, it was also concluded that “50 to 80 percent of what was measured on the test was not suitably addressed in the students’ textbooks” (Freeman et al., 1983, p. 509). Freeman went on to state, “The proportion of topics presented on a standardized test that received more that cursory treatment in each textbook was never higher that fifty percent” (p. 509). Popham (1999) writes that mismatches like this, recognized or not, will often lead to spurious
conclusions about effectiveness of education in a given setting if students’ scores on standardized achievement tests are used as an indicator of educational effectiveness.
The second reason standardized tests should not be used is due to the requirement that these tests permit meaningful comparison among students from only a small
collection of test items (Popham, 1999). The test items that do the best job in spreading out students’ total-test scores are items that are answered correctly by half of the students. Test items that are answered correctly by a large numbers of students are not a suitable contribution to spreading out students’ test scores. Therefore, most of the test items on an assessment are “middle-difficulty” items (p. 11). Because of “middle-difficulty” items being selected for an assessment, items that students perform well on will often be
excluded. This leads to the conclusion, items on which students perform well on are often taught by the teacher in the classroom. The more the teacher focuses on teaching those skills and knowledge to students the less likely those items will be on the standardized
achievement tests. It is not a good practice to use an assessment that deliberately avoids important content and skills that students are taught in school.
The third reason that student performance should not be used to evaluate the quality of education is that student performance on standardized achievement tests are heavily influenced by three causative factors. Popham (1999) writes that the three
causation factors are what is taught in school, a student’s native intellectual ability, and a student’s out-of-school learning. First, what is taught in schools can vary from school to school, as well as within and outside the state. Students learn most of what they need about a subject in schools. The departments of education in different states use standardized achievement tests to arrive at inferences about the quality of instruction provided to students (Popham, 2014). According to Popham, there is no evidence to support the accuracy of such score-based inferences about instructional quality. Furthermore, there is no evidence that currently exists regarding “instructional sensitivity” (p. 49). In 1981, Haladyna and Roid described the role of instructional sensitivity when evaluating the values of accountability tests, “Instructional sensitivity is the degree to which student performances on a test accurately reflect the quality of instruction specifically provided to promote student mastery of what’s being assessed” as cited in Popham, 2006, p.49. This definition is about a student’s mastery based on the quality of instruction in the classroom. Instructional sensitivity is a continuous rather than a dichotomous variable (Popham, 2014). The student’s ability to understand the
instruction provided by the teachers depends on native intellectual ability.
Additionally, student performance should not be used to evaluate the quality of education because every student’s native intellectually ability is different. A child born
with less aptitude for dealing with quantitative or verbal tasks might possess greater interpersonal or intrapersonal intelligence, but these latter abilities are not tested by standardized achievement assessments (Popham, 1999). The interpersonal or
intrapersonal intelligence may cause some difficulties for students in how they are able to demonstrate their understanding of a concept, due to how concepts are assessed. Some items on standardized achievement tests are aimed directly at measuring intellectual ability.
The last reason that student performance should not be used to evaluate the quality of education is that most items on standardized achievement tests assess
environmental experiences learned outside of school. If students come from economically advantaged families and environments, then they are more likely to succeed on
standardized achievement tests than children from economically disadvantage families and environments (Popham, 1999). For example, an elementary student is given a writing prompt on what would you want in your neighborhood park and why. A student who lives in a poor neighborhood that lack access to parks, or is unable to go to a park will write a different response than a student who has a neighborhood park that is accessible or frequently visits a park. In recent research, it has been found that a student’s
socioeconomic status is highly correlated with standardized test scores, as many test items focus on assessing knowledge or skills learned outside of schools. Students of low economic status tend to live in urban school districts. Urban school districts are viewed as poor; consist of students of color, and typically have low academic performance in
Urban Community
An urban area is defined as very developed with a density of human structures, such as houses, commercial buildings, roads, bridges, and railways (National Geographic, 2017). In addition, an urban is often defined as students of color and students from low-income families in densely populated areas that primarily attend urban schools (Buddin & Zamarro, 2009). In the education field, the word “urban” takes on many meanings as well. Milner (2012) best defines urban schools in three concepts. The concepts are urban intensive, urban emergent, and urban characteristic. Urban intensive is descriptive of schools that are in highly concentrated metropolitan cities with an average of one million plus people in an area. Urban intensive infrastructure can make it difficult to provide necessary and adequate resources to a large number of people. An example is the outside school factors of housing, poverty, and transportation that can affect schools. These factors can directly influence the academic performance of students in the classroom. The second concept is urban emergent, which describes schools located in an area fewer than one million people, where there is some scarcity of resource problems. In addition, there are outside factors such as limited resources, lack of qualified teachers, and low academic performances of students. The third concept is urban characteristic, and it is schools located in mid-sized cities that start to experience some the challenges associated with intensive and urban emergent. An example could be an increase in English Language Learners in the schools located in rural and suburban areas. In addition to the concepts Milner uses to help define urban schools, urban schools are often described in positive and negative ways by the media, politicians, parents, and educators.
However, the descriptions of urban schools have changed over the last 10 years due to the diverse student population. The largest change is more families of color living in urban school districts than White students. Significant research includes information on the description of urban schools in the United States (Patterson, Hale, & Stessman, 2007). Much of the research provides some common description of urban schools, communities, and students. Some of the common descriptions are about the
socioeconomic status, racial make-up of the community, and teachers’ perceptions of urban students. The first descriptive factor of an urban community is the combination of an increase of people of color in the urban communities and an increase in White flight. White flight occurs when White middle-class families and businesses relocate from urban centers to middle-class subdivisions and suburbs. In research by Patterson, Hale, and Stessman (2007), many White middle-class urban neighborhoods are occupied by the working-class, low-income, and people of color neighborhoods. Despite these changes in the urban neighborhoods, the faculty and staff of K-12 schools remain mostly White and middle-class. However, based on recent research, teachers prefer to work near their home, so they live in suburbs or wealthier urban communities, which is at odds with whom they may teach in urban schools (Buddin & Zamarro, 2009).
The second main description of urban schools is that many urban schools tend to be located in high poverty areas, with high-poverty areas defined as areas with a poverty rate of 20 percent or more. In addition, high-poverty areas are often identified because over half of the poor population in the county is from a minority group or over half of the poor population is non-Hispanic White, but it is the high poverty rate of a minority group that pushes the county’s poverty rate over 20 percent (USlegal.com, 2017). Moreover,
urban schools have disproportionate numbers of low-income and at-risk students (Buddin & Zamarro, 2009). These high poverty schools disproportionate numbers compose 40% of elementary schools and 40% of secondary schools (Olivares-Cuhat, 2011). In addition, schools and neighborhoods considered “high poverty,” as well as the students within them, are geographically segregated from affluent school districts (Buddin & Zamarro, 2009). With this separation based on race and income, White students and students of color will not perceive the world in the same manner (Talbert-Johnson, 2006).
A third major description of urban schools is poor academic proficiency of students. The academic proficiency contributing factors are low student achievement, inadequate school readiness, low parental involvement, poor access to learning resources, lack of discipline, language barriers, and poor student health (Thompson et al., 2005), which is supported by the fact that White student teacher candidates believe these descriptions prior to their field experience (Hill, Friedland, & Phelps, 2012). Similarly, Hill and colleagues’ study described that teacher candidates revealed in their journals their thoughts about urban students lacking motivation and initiative and about students with learning disabilities struggling to learn in class. The student teachers’ journals confirm their fears of interactions with urban African American students based on their previous misconceptions.
In conclusion, the three major descriptions of urban areas leads one to believe that it is likely that White people are fleeing because of people of color are moving into their neighborhoods, that all urban areas are high in poverty, and that children who attend school in urban schools do not care about school. All of these paint a negative picture of living in urban areas with people of color, the lack of economic development, and
low-performing schools. In addition, as mentioned earlier, since many teachers who work in urban schools do not live in the urban communities, one would have to wonder if a teacher not living in an urban community develops teacher qualities that can be contradictory to the qualities needed for educating urban students.
Teacher Quality
The aptitude that teachers’ display within content knowledge, ability to work with students with diverse needs, intangible skills, disposition, social structures, perception of students of color, and teacher preparation program can establish the quality of a teacher. There is significant research on teaching qualities and qualifications of teachers in urban, high poverty urban schools compared to low poverty urban schools. According to
Talbert-Johnson (2006), NCLB narrows the public focus on effective teaching, specifically to knowledge content. There is no recent evidence that the federal
government is holding states accountable for ensuring that highly qualified teachers are educating low-income diverse student populations based on NCLB. Unfortunately, NCLB has not provided adequate preparation for future teachers with appropriate experiences to address diversity issues at all educational and economics levels.
With the lack of guidance for teacher quality from NCLB, some teacher preparation programs have failed to prepare teachers to address the needs of an
increasingly diverse population of urban students in order to close achievement gaps as well as other educational outcomes (Talbert-Johnson, 2006). Research has provided information that White middle class female teachers struggle to educate a culturally diverse student body because the clash of culture and language barriers within the classroom (Delpit, 2006). In addition, Hill, Friedland, and Phelps (2012) indicated that
most effective teacher candidates viewed diversity as a personal and professional learning opportunity, where as those who were less effective saw it as an obstacle and a scapegoat for their own inadequacies. The lack of teacher preparation program experiences in diverse learning environments can influence highly qualified teachers to lack the desire to educate students of color and low economic status students.
The poor and students of color get less than their fair share of high-quality
teachers in urban school districts. Peske and Haycock (2006) found large discrepancies in the qualifications of teachers in diverse and high poverty schools versus teachers serving in schools with few students of color and students from low-income backgrounds.
However, low-income students and students of color have higher performance gains with higher teacher quality (Peske & Haycock, 2006). In addition, Priestly, White, and Gong (2005) found that both high numbers of students of color and high poverty schools continue to exhibit stronger school performance when they have teachers of high quality. In contrast, the school performance is not as strong in schools with high numbers of students of color and high numbers of students from low-income backgrounds with low teacher quality. Many scholars have noted how teachers’ qualities are related to school performance even after considering demographics (Priestly, White, & Gong, 2005). Furthermore, teachers who are highly qualified are disproportionately distributed to schools with low numbers of students from low-income backgrounds and low numbers of students of color (Peske & Haycock, 2006). Therefore, school districts with high numbers of poor and students of color are likely to demonstrate stronger school academic
performance outcomes when students have high quality teachers’ distributed evenly throughout their schools. Unfortunately, students in high poverty areas and in schools
with high numbers of students of color are disproportionately assigned teachers who are new to the profession and some not of high quality.
The new teachers who have been in the profession with less than three years, and who maintain high skills will have an impact on student achievement. Yet, high quality teachers tend to be distributed among low numbers of students of color and low-poverty schools. This leads to urban school districts in low-income neighborhoods employing teachers with low qualifications and weak academic credentials (Buddin & Zamarro, 2009). Peske and Haycock (2006) indicated that high-poverty secondary schools would have more than one in three core academic classes taught by out-of-field teachers. A teacher out-of-field is in transition to become licensed to teach in a particular area, but has a bachelor’s degree in a non-education field. In fact, in order to determine teacher quality Presley, White, and Gong (2005), used ACT composite and English scores, teachers who failed the Basic Skills test on their first attempt, teachers with emergency or provisional certification, teachers’ undergraduate college competitiveness ranking, and the percent of teachers with three or fewer years of experience to rank teachers. One result of their study found students of color who attended high poverty secondary schools tended to have one high quality teacher that earned a degree in a specific content area (Priestly, White, & Gong, 2005).
Unfortunately, teachers who were ranked at the bottom of Presley, Bradford and Gong’s (2006) study with low teachers’ qualities were distributed more heavily in schools with a high number of students of color and high-poverty schools. These schools continue to improve in student academic performance when they have some high quality teachers. In fact, Peske and Haycock (2006) listed several indicators that impacted