Managing the marketing budget in a cost-constrained environment
John A. Weber*
Department of Marketing, Mendoza College of Business, University of Notre Dame, Notre Dame, IN 46556, USA Received 1 November 2000; received in revised form 11 May 2001; accepted 17 June 2001
Abstract
Marketing costs have been rising rapidly while both manufacturing and general management costs have been declining. As a result, those concerned with realigning corporate assets to maximize shareholder returns are requiring that marketers start proving their worth or be gradually starved of resources. Reflecting such pressures, marketing managers are being asked to provide more convincing evidence that planned marketing strategies will indeed yield more value for the company and its shareholders. Likewise, those charged with planning the marketing budget are being asked to more thoroughly justify requested budget increases. Whole new financial measures are needed for evaluating the relative productivity of specifically proposed marketing budget expenditures vis-a`-vis shareholder value. The paper reviews several procedures that can help address these challenges and presents a detailed example of the application of one of the approaches. D2002 Elsevier Science Inc. All rights reserved.
Keywords:Marketing costs; Marketing budget; Marketing productivity; Marketing efficiency; Projecting sales growth; Marketing measures; Path Marketing Analysis (PMA); Served market
1. Introduction
The traditional purpose of marketing has been to achieve success in sales, market share, and gross margin in the marketplace. Increasingly, however, top management has begun to require that marketing view its ultimate purpose as enhancing shareholder returns [1,2]. For corporate cost cutters and others concerned with realigning corporate assets to maximize shareholder returns, the marketing budget invites particularly close scrutiny since marketing costs have been rising rapidly while both manufacturing and general management costs have been declining. Reflecting these increasing costs, marketers face rising pressure to become more efficient and productive. Those in charge of the corporate purse strings are demanding that marketers prove their worth or be gradually starved of resources. Shareholder value should be a primary concern when evaluating alternative potential marketing strategies and when setting and allocating the marketing budget for future operating periods. This paper reviews several contemporary approaches to monitoring marketing productivity and sug-gests how a procedure called Path Marketing Analysis (PMA) can add additional insights for both evaluating
alternative potential marketing strategies and for setting future marketing budgets with shareholder value as a primary objective.
2. Marketing costs—out of control
Having assessed changes in the structure of corporate costs over the past 50 years, Sheth and Sisodia [3] found that manufacturing costs have declined from 50% to 30% of total corporate costs due to the implementation of just-in-time strategies, flexible manufacturing systems, redesigned manufacture and assembly platforms, and the development of cooperative supply management partnerships (Fig. 1). Management costs (defined to include finance, accounting, human resources and support functions such as legal depart-ments and R&D) have also declined as a proportion of total corporate costs (from 30% to 20%), reflecting strategies such as downsizing, right-sizing, outsourcing, business process reengineering and the pervasive application of software solutions throughout the management infrastruc-ture. In sharp contrast to manufacturing and management costs, marketing-related costs have increased significantly from only 20% of total corporate costs 50 years ago to 50% today. As defined in the study, marketing costs include expenses such as product development, selling, distribution, 0019-8501/02/$ – see front matterD2002 Elsevier Science Inc. All rights reserved.
PII: S 0 0 1 9 - 8 5 0 1 ( 0 1 ) 0 0 1 9 1 - 2
* Tel.: +1-219-631-5286; fax: +1-219-631-5225. E-mail address:[email protected] (J.A. Weber).
advertising, sales promotion, public relations, customer service, outbound logistics and order fulfillment.
With this dramatic transition in costs and the increasing pressures to improve shareholder returns, it is no surprise that today’s CEOs are demanding more from each market-ing dollar spent and a higher level of accountability from marketing managers. Addressing this critical challenge calls for two distinct, yet interrelated strategies—to improve both the efficiency and the productivity of the marketing effort. Simply put, efficiency involves ‘doing things right,’ while productivity addresses ‘doing the right things’[4].
3. Strides taken to improve marketing efficiency
Strategies addressing the high cost of marketing have focused primarily on efforts to improve efficiency through reducing costs. In most companies, there are ample oppor-tunities for enhancing marketing efficiency by judicious cost cutting. To do so, marketers are challenging the efficiency of the full range of current and planned marketing budget expenditures. Expenses related to product development, selling, distribution, advertising, sales promotion, public relations, customer service, outbound logistics, order fulfill-ment, etc. have undergone careful evaluation. Inefficiencies discovered are being addressed. Reflecting such strategies, many companies today are downsizing the sales force, closing regional sales offices, transferring marketing person-nel and functions to the sales force, and cutting back on unproven promotion programs and tactics. In addition, cross-subsidization of accounts in marketing is getting a careful look, since, in many companies, a few highly profitable accounts have tended to hide inefficiencies in less profitable accounts. Such efforts continue to generate considerable cost savings each year in most major companies[3,5].
4. The challenge to improve marketing productivity
While addressing marketing-related inefficiencies has been the natural starting point, improving the productivity (effectiveness) of marketing expenditures offers even more promising potential benefits for shareholders. Unfortunately, companies have not yet been very successful in creating
practical new approaches for measuring and improving marketing productivity. This dilemma continues in large part because monitoring the productivity of alternative marketing budget expenditures is complicated by the intangible role of marketing, which is to perform functionsaroundgoods and services, rather than to produce anything directly [3,6]. Whole new financial measures (beyond simply monitoring sales, share, and gross margins) are needed for evaluating the relative productivity of specifically proposed marketing budget expenditures vis-a`-vis shareholder value.
Consider, for example, the challenges of trying to meas-ure and subsequently improve the productivity of one marketing function, promotion. How does one measure the financial return of a promotion campaign? Major research streams have emerged focusing on measures, methods and means of achieving increased productivity in promotion [7]. Measuring the productivity of a promotion campaign would begin by recognizing campaign objec-tives—for example, to establish awareness, to build an image or to close a sale, etc. Multiple objectives are possible, reflecting different stages of a campaign and creating measurement difficulties right from the start (e.g.,
Ref. [8]). The overall productivity measure would then be expanded to capture the marketing context (low or high involvement) and the appropriate model of customer behav-ior (e.g.,Ref. [9]). One would also have to carefully identify the present value of incremental investment flows required by the campaign and consider how long the results of the promotion should be measured—clouding the issue of the appropriate time frame for the financial analysis. Given all these complexities, not surprisingly, there is little consensus on what should be included and measured. All of these issues taken together make estimating the productivity of a promotional effort in financial terms a daunting task indeed (for further discussion, see Refs. [7,10]). This is just one example of the challenges involved in trying to measure productivity and productivity improvements in marketing.
5. Developing better measures of marketing productivity
Described here are four contemporary efforts to develop better measures of marketing productivity. All four approaches recognize the need to systematically consider Fig. 1. Proportion of corporate costs in 1995: manufacturing 50%, management 30%, and marketing 20%.
J.A. Weber / Industrial Marketing Management 31 (2002) 705–717 706
efforts to both acquire and retain customers. The first three procedures reviewed focus upon holding marketers more accountable for bringingvalueto customers and, thereby, to shareholders. The fourth approach, Path Marketing Analysis (PMA), provides measures for estimating the prospective return of alternative potential marketing strategies. It also provides useful financial perspectives for adjusting the marketing budget to contribute more directly to company and shareholder value. While none of the four approaches reviewed completely resolve the dilemma of trying to measure marketing productivity, each in its own way con-tributes valuable insights, which help link marketing meas-urement more closely with marketing productivity and success and, ultimately, with shareholder return.
5.1. Sheth and Sisodia (1995)
Within their overall marketing productivity enhancement model, Sheth and Sisodia [3]identify 20 ways to improve marketing productivity—classifying them into four categor-ies: collaborating, rationalizing, ‘informationalizing’ and managing. All of their improvements focus on two primary outputs of marketing—the profitable acquisition and reten-tion of customers.
With their proposed approach, any measure of productiv-ity improvement for a prospective marketing initiative includes the value of the initiative vis-a`-vis both customer acquisition and retention. The measure for acquiring custom-ers consists of the revenue attributable to marketing actions that bring in new customers, divided by the costs of those actions, adjusted by a Customer Satisfaction Index (CSI)
[11]. This formula assumes that highly satisfying exchanges (rather than hard sell and overpromising techniques) form the basis of new customer acquisitions. The measure for cus-tomer retention calls for adjusting the measure of revenue/ cost for existing customers by a Customer Loyalty Index (CLI), which addresses customer ‘churn,’ a problem of significant importance in more and more industries in today’s ever-more competitive marketplace[12].
The overall marketing productivity enhancement from a specific initiative is measured as a weighted combination of the productivity measures for customer acquisition and customer retention. The weighting should reflect the relative importance of customer acquisition (particularly important for a new product or startup firm) and retention (relatively more important for an established firm in a slow-growing industry). Strategic initiatives enhancing marketing produc-tivity in this context are presumed to add measurable value to the firm and its shareholders.
5.2. Srivastava, Shervani and Fahey (1998)
A related approach for measuring marketing productivity and monitoring productivity improvements from alternative marketing initiatives is to focus on prospective improvements in the value of ‘market-based assets’ [2]. Under this
para-digm, marketers are expected to carefully identify and assess all of the company’s market-based assets. For example, customer relationships, channel relationships, and partner relationships are no longer viewed simply as objects of marketing’s actions. Rather, they are assets to be overtly recognized, cataloged, cultivated and leveraged [13]. The same is true for the full range of what Srivastava et al.[2]have identified as relational and intellectual assets of marketing.
To use this approach, one tries to project the effects that specific marketing budget expenditures are likely to have upon the collective value of such assets and their subsequent effect upon customer acquisition and retention. The pre-sumption is that enhancing market-based assets can increase shareholder value by facilitating the acquisition and reten-tion of customers, thereby accelerating and enhancing cash flows, lowering the volatility and vulnerability of cash flow and increasing the residual value of cash flows.
Several interrelated streams of research have emerged that provide insights for measuring specific marketing activity’s impact on market based assets and their sub-sequent effect upon customer acquisition and retention. These include research on brand equity (cf. Refs. [14 – 16]), customer satisfaction (cf. Refs. [17,18]) and the management of strategic relationships (cf. Refs. [19,20]). Collectively, these research endeavors clearly demonstrate that building long-term relational bonds between external entities and the firm does indeed create significant value for the firm and its shareholders (for further discussion, see Srivastava, Shervani and Fahey [2], who catalog how judicious adjustment of different market-based assets can enhance marketing productivity).
5.3. Anderson and Narus (1998, 1999)
Another method for measuring and enhancing marketing productivity is to move closer to the marketplace and consider current and potential marketing offerings as value propositions for current and potential new customers. This approach suggests using a mix of different value assessment methods to assess the efficacy of key market offerings of a firm [21,Chap,2]. While this procedure has been proposed primarily for business-to-business markets, it may also add insight for valuing market offerings for some final consumer markets (especially for durable goods).
To operationalize this technique, the marketer translates as many features as possible of a marketing offering not only into traditional ‘customer benefits,’ but also into monetary worth or ‘value’ to customers. The total overall value is considered against the comparative value of competitive alternatives and is presented to customers as a persuasive ‘value proposition.’ The underlying supposition is that only with specific and accurate estimates of the worth of its market offerings can a supplier firm hope to gain an equitable return on the investments required to deliver value to shareholders. Under this approach, value includes benefits and costs for the targeted segment. For business segments, benefits consist J.A. Weber / Industrial Marketing Management 31 (2002) 705–717 707
of factors such as increased sales, productivity and efficiency. For final consumer segments, benefits consist of greater satisfaction (for example, as measured by customer satisfac-tion indices such as the American Customer Satisfacsatisfac-tion Index[22]). For both business and consumer segments, costs in the modelexcludethe purchase price, but include all usage and disposal or recycling costs. The total value of a market offering equals monetary benefits minus the monetary costs of the offering over the expected life of the product or service purchased. This value minus the purchase price equals the ‘net value’ of a market offering, which is subsequently compared against the net value of competitive offerings to create a value proposition for customers [21,23]. In this approach, creating value for customers is at the heart of building value for the firm and its shareholders.
5.4. Weber and Dholakia (1998)
A fourth procedure, Path Marketing Analysis (PMA), is from Weber and Dholakia[24]. As suggested above, PMA can provide measures for estimating the prospective return of alternative potential marketing strategies and also provide useful financial perspectives for adjusting the marketing budget to contribute more directly to company and share-holder value. A marketing planner can use PMA on a stand-alone basis or as a complement to any of the other approaches reviewed above.
One begins applying PMA by carefully defining product market boundaries for each of the company’s more important market offerings [25] and then developing ‘PMA Market Profiles’ for each key market. A PMA Market Profile provides a snapshot view of the weaknesses (and related opportunities) of a company’s marketing offering for a given market segment. To start building a PMA Market Profile, the planning team estimates current annual Industry Sales (IS) and the Firm’s Sales (FS) for a narrowly defined homogen-eous target segment. Next, the planners try to explain all portions of the overall competitive gap (i.e., IS minus FS). As the explanations emerge, they take the form of PMA Market Profile Gaps (see Fig. 2a). The size of each gap as a percentage of IS defines its tactical market response function. Integrated together, the overall gap structure defines an aggregate strategic market response model. Weber and Dho-lakia [24] present the detailed formulation of the PMA process.
Applying the framework for a specific target segment requires building three PMA Market Profiles: one for the current year; a second for some future year (e.g., Year 3), while assuming no new strategies by the company; and a third for that same future year, but assuming implementation of the company’s alternative potential marketing strategies. The three profiles are designated as PMA Market Profiles Nos. 1, 2 and 3 (seeFig. 2b). PMA provides a framework for projecting the present value of both the incremental revenue and cost flows over the projected life of each hypothesized strategy. This allows a firm to simulate
altern-ative potential marketing strategies and provides a founda-tion for generating comparative projected rates of return on new assets employed for each potential strategy and stra-tegic scenario considered. Table 1provides an example of how the PMA structure can help estimate the 5-year rates of return for alternative strategies in a specific market. Mar-keting decision makers can use such projections as import-ant inputs for estimating which potential strategic scenarios are likely to provide higher rates of return and greater value for the firm and its shareholders. For further details, seeRef. [24]. (Note: PMA focuses on helping firms grow market share in mature markets. Thus, the PMA model does not treat IS itself as a strategic variable. For discussion of IS as a strategic variable in similar model, see Refs. [26 – 28].)
In addition to providing new financial measures for evaluating the relative productivity of specific alternative potential marketing strategy scenarios, PMA can also provide useful financial perspectives for adjusting the marketing budget to contribute more directly to company and share-holder value. This is highlighted in the example below.
6. The role of the marketing budget and the marketing controller
Regardless of what approach a company applies in the effort to improve marketing efficiency, productivity and Fig. 2. (a) A ‘PMA Market Profile’ presents marketing mix elements and related share growth opportunities in a hierarchical structure. (b) Three PMA market profiles are built for each target market.
J.A. Weber / Industrial Marketing Management 31 (2002) 705–717 708
accountability, the marketing budget is the universal vehicle used to record such efforts and to tally related accomplish-ments. The challenge for the marketing controller (or whoever is in charge of setting and adjusting the marketing budget) is to create an effective balance between stimulating marketing efficiencies to control costs while at the same time enabling marketing managers to pursue the best new opportunities available without undue constraints in order to enhance marketing productivity.
To operate as an effective tool in the drive for greater marketing efficiency, productivity and accountability, the marketing budget should function as the foundation for the marketers’ operating plan. The budget should include not only line item objectives, but also:
line item control figures for each future operating period, designation of key monthly control figures (a subset of
line items),
a specified range of acceptable performance levels for each monthly control figure,
accommodations for automatic red flags for out of plan performance on each monthly control figure during the year, and
an allowance for budget adjustments at a key juncture during the year (typically 3 – 4 months into the operating period is an appropriate time frame for such adjust-ments).
Furthermore, attention to details with innovative interfaces between marketing and accounting systems are needed. For example, more and more firms are now extending activity based accounting to cover a wider and wider range of marketing based assets[29 – 31].
7. Adjusting the marketing budget over time
In practice, marketing controllers in most companies tend to adjust marketing budgets over time according to prag-matic factors such as what is seemingly affordable or what increases in sales are anticipated for a particular product line. These methods are simple, which is a major advantage, and each has its own logical justification[32]. At the same time, however, these methods do not use shareholder value as a criterion for marketing budget changes over time. To build more shareholder-sensitive marketing budgets, mar-keting controllers should evaluate prospective marmar-keting expenses using additional criteria such as efficiency, com-petition and projected changes in the Served Market. 7.1. Efficiency
The first order of business in the drive to control marketing costs and to increase shareholder returns from marketing budget expenditures is to improve the efficiency of current marketing activities. From the marketing controller’s point of
view, the goal of such efficiency improvements should be to trim marketing expenses without significantly impacting marketing productivity. To operationalize this, challenging the efficiency of all planned marketing expenditures should become part of the marketing culture of the firm. Ultimately, new efficiency directed programs might evolve to creatively downsize the sales force, close regional sales offices, transfer marketing personnel and functions to the sales force, trim unproven promotion programs, adjust cross-subsidization of accounts and leverage sales force efficiency and customer service with aggressive use of new technologies. Forward-looking companies are also developing innovative partner-ship with suppliers, outside service providers, resellers and final customers in order to create new efficiencies throughout the supply management chain (e.g., Refs. [19,20]). To develop and introduce such cost savings programs, a firm cannot simply issue directives to those with line item responsibility to cut existing expenses by ‘‘x’’ percent or ‘‘x’’ amount during the next operating period. Such directives overlook other factors critical to marketing budget adjust-ments. Among the most important of these are competition and projected changes in the Served Market.
7.2. Competition
Once the drive for continuing improvement in the efficiency of all marketing activities has become part of the marketing culture of the company, the marketing controller’s job is still only beginning. One important reason why marketing costs have mushroomed over the past 50 years from 20% to 50% of total corporate costs is because of the growing breadth and intensity of competition from local, regional, national and multina-tional companies. Companies around the globe are seek-ing new sources for revenues, profits and returns for their shareholders. In order to continue growing, companies in most industries are aggressively seeking out new markets for current products and introducing new products to pursue other areas of promising demand growth. Thus, competitive intensity is another critical factor that the marketing controller should carefully consider when plan-ning line by line changes in the marketing budget. Adjustments in the market budget in response to antici-pated increases in competitive intensity should be deter-mined on a product-by-product and market-by-market basis, rather than as across-the-board decisions.
Most companies can assume that the level of competitive interest in their most attractive markets will continue to accelerate for the foreseeable future. In the future, therefore, more marketing resources, not less, will be demanded from a company simply to maintain its market share in key markets. Expanded marketing resources may be required for enhanced activities such as:
continually developing new product variations and technologies to displace current product offerings and J.A. Weber / Industrial Marketing Management 31 (2002) 705–717 709
Table 1
Calculating projected rates of return on investment for alternative potential strategies using the PMA approach (for details, seeRef. [24]) Pursuing share growth opportunities related to:
IS (1) Captive sales (2) Missing colors (3) Service (4) Low price (5) Price quality (6) Distribution (7) Promotion (8) Market share and revenue projections
Full-term market share projections
Full-term market share increase 1.30% 0.72% 1.80% 2.25% 2.81% 2.48% 5.52% 1.64% Resultant timing variance in market share increase from each strategy
New market share from each strategy in Year 1 0.08% 0.03% 0.22% 0.14% 0.18% 0.02% 0.35% 0.13% New market share from each strategy in Year 2 0.39% 0.18% 0.81% 0.49% 0.79% 0.20% 1.19% 0.44% New market share from each strategy in Year 3 0.78% 0.38% 1.35% 1.15% 2.11% 0.67% 2.65% 0.98% New market share from each strategy in Year 4 1.04% 0.65% 1.80% 2.25% 2.81% 1.59% 4.41% 1.64% New market share from each strategy in Year 5 1.30% 0.72% 1.80% 2.25% 2.81% 2.48% 5.52% 1.64% Converting projected market share increases into incremental revenue flows
New sales volume flows from each strategy
IS Year 1: 425 0.33 0.14 0.92 0.61 0.75 0.11 1.50 0.56 IS Year 2: 450 1.75 0.81 3.65 2.19 3.56 0.89 5.36 1.99 IS Year 3: 475 3.70 1.80 6.42 5.48 10.03 3.18 12.58 4.68 IS Year 4: 500 5.19 3.24 9.01 11.26 14.07 7.95 22.07 8.20 IS Year 5: 525 6.81 3.78 9.46 11.82 14.77 13.04 28.97 8.61 New sales dollar flows from each strategy (in US$M),
assuming a price of US$100/unit (in constant Year 1 dollars) (except for Low Price Strategy—US$80)
Year 1 US$33 US$14 US$92 US$61 US$60 US$11 US$150 US$56 Year 2 US$175 US$81 US$365 US$219 US$285 US$89 US$536 US$199 Year 3 US$370 US$180 US$642 US$548 US$802 US$318 US$1258 US$468 Year 4 US$519 US$324 US$901 US$1126 US$1126 US$795 US$2207 US$820 Year 5 US$681 US$378 US$946 US$1182 US$1182 US$1304 US$2897 US$861 Five-year sales US$1777 US$977 US$2944 US$3135 US$3454 US$2517 US$7049 US$2405 Five-year present value incremental revenue flow from each strategy
(assuming discount rate of 8%)
US$1319 US$721 US$2212 US$2311 US$2568 US$1810 US$5191 US$1783
J.A. W eber / Industrial Marketing Managemen t 3 1 (2002) 705–717 710
Adding costs to the model
New assets employed (investment required (in US$M) for strategy development, added capacity and other strategy related investment costs)
Year 1 US$150 US$100 US$300 US$500 US$100 US$150 US$600 US$200 Year 2 US$150 US$100 US$200 US$400 US$200 US$150 US$500 US$100 Year 3 US$150 US$75 US$100 US$200 US$300 US$100 US$400 US$100 Year 4 US$150 US$50 US$50 US$200 US$50 US$50 US$300 US$100 Year 5 US$150 US$0 US$50 US$200 US$0 US$50 US$200 US$100 Five-year Present Value of New Assets required for each strategy
(assuming discount rate of 8%)
US$599 US$275 US$599 US$1,248 US$539 US$418 US$1,658 US$492 Variable Cost (assumed here to only include Cost of Goods Sold,
with direct cost per unit estimated at US$20)
Year 1 US$7 US$3 US$18 US$12 US$15 US$2 US$30 US$11 Year 2 US$35 US$16 US$73 US$44 US$71 US$18 US$107 US$40 Year 3 US$74 US$36 US$128 US$110 US$201 US$64 US$252 US$94 Year 4 US$104 US$65 US$180 US$225 US$281 US$159 US$441 US$164 Year 5 US$136 US$76 US$189 US$236 US$295 US$261 US$579 US$172 Five-year Present Value of Variable Costs related to each strategy
(assuming discount rate of 8%)
US$264 US$144 US$442 US$462 US$642 US$362 US$1,038 US$357 Total costs (Present Value of New Assets employed plus Total Variable Costs)
Year 1 US$157 US$103 US$318 US$512 US$115 US$152 US$630 US$211 Year 2 US$185 US$116 US$273 US$444 US$271 US$168 US$607 US$140 Year 3 US$224 US$111 US$228 US$310 US$501 US$164 US$652 US$194 Year 4 US$254 US$115 US$230 US$425 US$331 US$209 US$741 US$264 Year 5 US$286 US$76 US$239 US$436 US$295 US$311 US$779 US$272 Five-year Present Value of Total Costs required for each strategy
(assuming discount rate of 8%)
US$863 US$419 US$1,042 US$1,710 US$1,181 US$780 US$2,697 US$848
Comparing the return per assets employed for each strategy Alternative return on investment comparisons
Total Profits = Total Pres Val Revenue minus Total Pres Val Cost US$456 US$302 US$1,171 US$601 1,387 US$1,031 US$2,495 US$935 Present Value Profits/Present Value Costs 53% 72% 112% 35% 117% 132% 93% 110%
Per year 11% 14% 22% 7% 23% 26% 19% 22% Rank Order of Return) 7 6 3 8 2 1 5 4 Net Sales Dollars per Dollar of New Assets Employed
(Net Sales = NPV RevenueNPV Variable Costs)
US$1.73 US$2.09 US$2.65 US$1.30 US$2.16 US$2.85 US$2.40 US$2.62 Rank Order of Return) 7 6 2 8 5 1 4 3
J.A. W eber / Industrial Marketing Managemen t 3 1 (2002) 705–717 71 1
to improve price performance for current resellers and final customers;
catering more attentively and creatively to both tradi-tional and emerging reseller markets in order to simply maintain the company’s current level of availability and reseller push for the company’s key products and services; and
maintaining the current level of brand equity, awareness and loyalty among the company’s present reseller and final customer base amidst the deluge of global competition.
These incremental efforts and related increases in marketing expenses will continue to be required in order to simply retain current customers. A firm is naive indeed if its budget
assumes that the company can maintain current market shares in more intensely competitive markets without a commitment of additional marketing resources. For each of its key markets, the company should require its brand, product and category managers to systematically project what level of competitive intensity is anticipated over the relevant planning horizon. The marketing controller should use this information as an important decision factor when adjusting and allocating the future marketing budget.
Enlightened marketing controllers can challenge brand, product and category managers to use efficiency strategies to generate a significant portion of the additional resources required to respond effectively to competitive pressures. For example, marketing managers can be encouraged to lever-age technology, to partner with suppliers and resellers and to
Fig. 3. (a) PMA Market Profile summaries. (b) A significantly different Served Market for each door type. J.A. Weber / Industrial Marketing Management 31 (2002) 705–717
consider other creative cost-cutting tactics for each line item of the their marketing budgets. Cost savings thus realized can be used to help respond to growing competitive pres-sures.
7.3. Projecting changes in the ‘Served Market’
Over the years, marketing analysts have used the term ‘Served Market’ to describe a variety of marketing measures (e.g., Refs. [24,27,32 – 34]). While varying somewhat in detail, in all cases, the term Served Market attempts to
describe that portion of a market for which a company is directly competing.
The operational definition used here for defining the Served Market is that used in the PMA process intro-duced earlier. In PMA, the Served Market equals residual IS remaining after a company’s specific weaknesses in its product, pricing and distribution strategies have been accounted for. This Served Market itself includes the firm’s own sales (FS) plus a residual, referred to as the ‘direct competitive gap.’’ An analysis of prospective changes in the Served Market can provide the marketing Fig. 3 (continued).
controller with shareholder-sensitive criteria for determin-ing appropriate increments and allocations for the mar-keting budget. (Note: As with other sales projections models based upon aggregate market response functions, the usefulness of PMA is heavily dependent upon the accuracy of the estimates of likely changes in the individual components of the PMA market profiles over the relevant time horizon. Projecting alternative strategic scenarios and overlaying related projections of PMA profile components with sensitivity analysis, Bayesian analysis and other risk adjustment techniques can reduce dependency on the accuracy of individual data points. See Ref. [24] for further discussion.)
8. Example of insights from focusing on projected changes in the Served Market
A national manufacturer of commercial and residential doors had its product managers apply PMA for some of the company’s most important door products. The result-ing PMA Market Profiles for three of the company’s door products in the construction market (commercial garage doors, residential garage doors and fire doors) appear in
Fig. 3a and b.
The market profiles in Fig. 3a show that the firm faced substantially different marketing problems and opportunities for each door type. Note, for example, that the firm’s product, price and distribution gaps ranged from 10% to 25% of IS—depending upon the door type. The firm’s Served Market for the current year ranged from 35% for the commercial garage door market to 55% for residential garage doors (Fig. 3b).
In addition to profiling the Unserved Market, PMA provides two important measures describing a firm’s position against direct competition (i.e., against the Served Market): the size of the direct competitive gap1 and the ‘Share of Served Market’ (SSM). The size of the direct competitive gap is calculated as a residual of the Served Market less the firm’s own sales (SMFS). In the example (Fig. 3a and b), the company’s direct competitive gap (or ‘promotion gap’—see footnote 1) equals 23%, 48% and 36% for commercial garage doors, residential garage doors and fire doors, respectively. The second PMA measure describing a company’s direct competitive position is the SSM. The SSM equals the firm’s own sales (FS) divided by the Served Market (i.e., FS/SM). The SSM measure indicates how competitive the firm is against direct head to head competition (i.e.,
against that portion of IS for which the firm faces no significant weaknesses in its product, price or distri-bution). A company’s SSM in a specific market is influenced by factors such as how long the firm has competed in the market, the number and intensity of competitors, the firm’s brand equity and how well the company has mapped out and communicated its strategic value proposition for the relevant Served Market. In the example, the SSM measure indicates that the company is most competitive head to head in the commercial garage door market (SSM = 34%) and least competitive head to head in the residential garage door market (SSM = only 13%).
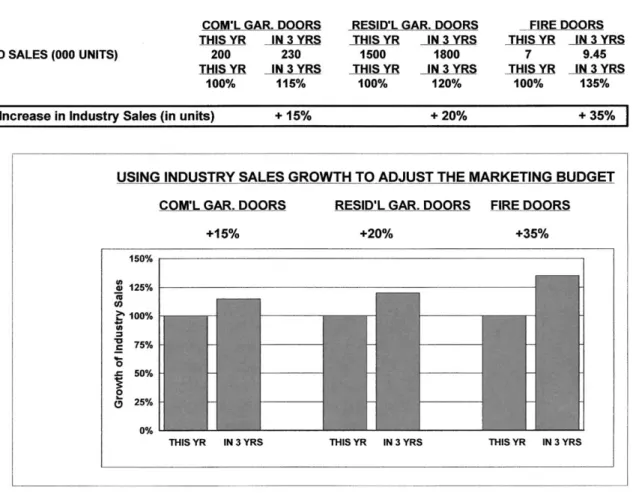
In the context of the current discussion concerning adjust-ment and allocation of the future marketing budget, the challenge this specific company faced was to determine whether and how to change the future marketing budget for each of the three product managers. For lack of a better approach, in markets where the company was fairly well established, as in the three markets in the example, the company typically used projected IS growth as the primary criteria for setting its sales growth targets. The subsequent criteria for evaluating product managers each year had been whether or not the firm maintained its current market share (by growing no slower than the industry). The current marketing plan projected IS increases over the next 3 years of 15% for commercial garage doors, 20% for residential garage doors and 35% for fire doors(Fig. 4). In the example, therefore, using IS growth as the primary criteria yielded sales growth targets of 15%, 20% and 35% for commercial garage doors, residential garage doors and retail barriers, respect-ively.
To accomplish such sales objectives (i.e., at a min-imum, to maintain current market shares), the company also used projected IS growth as the primary criteria for adjusting and allocating marketing budget increases. New marketing budget adjustments and allocations were deter-mined by using these differential IS growth projections. Thus, under this old criterion, the fire door product manager was to receive the greatest percentage budget increase ( + 35% of the current budget), while the com-mercial garage door manager was to receive the smallest increase ( + 15%).
As the company discovered, continuing the PMA process to the next phase provided important supplement-ary perspectives for adjusting both sales growth targets and marketing budget allocations. The next phase involved estimating the Unserved Market gaps for the projected future PMA Market Profile for each product line. The future market profiles were built to reflect projected environmental dynamics such as changing cus-tomer preferences, economic growth rates, technological progress and competitive strategies. Such trends might cause natural increases or decreases in the size of any or all of the company’s current Unserved Market profile gaps. Importantly, the projected PMA Market Profiles
1
Efforts to reduce the direct competitive gap typically focus on refining and/or expanding promotion efforts, including field sales promotions, reseller promotions, trade shows, advertising to end users, etc. Therefore, in some instances, the gap between the Served Market and the firm’s sales can be labeled appropriately as a ‘promotion gap’ in the market profile.
J.A. Weber / Industrial Marketing Management 31 (2002) 705–717 714
also incorporated planned modifications in the company’s own marketing strategies—modifications designed to address the size of some current gaps in the Unserved Market for the three product markets studied. Because the company previously had no way to catalog and system-atically evaluate the potentially complex interrelationships among and between the various projected environmental changes and the company’s own planned strategies, these important factors had not been systematically used as inputs for adjusting sales targets or for marketing budget planning. As indicated above, both sales goals and budget allocations were historically adjusted primarily in line with projected changes in IS growth.
The projected PMA Market Profiles gave the market-ing controller new perspectives for adjustmarket-ing sales growth targets and for planning the marketing budget. Fig. 5
presents the PMA Market Profiles that the company projected for the three door markets introduced in the previous figures. The projected profiles start with IS growth projections and then also incorporate projected changes in the size of the firm’s product, price and distribution gaps. Reflecting such anticipated changes, the firm’s Served Market volume was projected to increase at rates of 130%, 42% and 20% for commercial garage doors, residential garage doors and fire doors, respectively. Note the sharp contrast between these pro-jections and respective projected increases in IS (15%, 25% and 35%).
These projected increases in the Served Market became important inputs for establishing new sales growth targets for each product manager. Combined with formal consideration of potential efficiency strategies and the dynamics of com-Fig. 4. Using projected increases in industry sales volume to determine appropriate marketing budget adjustments.
petitive pressures, these projected Served Market increases also became key inputs for planning the future marketing budget for each product manager. In the final budget, the revised budget allocations for each product manager pro-vided specific resources for adding new potential customers to the served markets, for penetrating these newly served markets and for defending the company’s already established positions (i.e., to maintain current SSM) in its already served markets.
9. Summary and conclusions
Marketing costs have been rising rapidly, increasing from only 20% of total corporate costs 50 years ago to 50% today. Reflecting this dramatic transition in costs and the increas-ing pressures to improve shareholder returns, CEOs are demanding more from each marketing dollar spent and a higher level of accountability from marketing managers. Addressing this critical challenge calls for strategies to improve both the efficiency and the productivity of the marketing effort.
Strategies addressing these high marketing costs have focused primarily on efforts to improve efficiency through reducing costs. Among other efforts, companies are down-sizing the sales force, closing regional sales offices, trans-ferring marketing personnel and functions to the sales force and cutting back on unproven promotion programs and tactics. Such efforts continue to generate considerable cost savings each year in most major companies.
Improving the productivity of marketing expenditures offers even more promising potential benefits for share-holders. To accomplish this, new measures are needed to evaluate the relative productivity of specifically proposed marketing budget expenditures. Several approaches were reviewed, with an example of one process, Path Marketing Analysis (PMA), presented in some detail. That example showed that PMA not only includes measures for estimating the prospective return of alternative potential marketing strategies and strategic scenarios, but also provides useful financial perspectives for adjusting the marketing budget to contribute more directly to company and shareholder value. PMA does this by focusing on prospective changes in the Served Market in order to determine more realistic sales Fig. 5. Using projected increases in Served Market volume to help determine appropriate marketing budget adjustments.
J.A. Weber / Industrial Marketing Management 31 (2002) 705–717 716
growth goals and appropriate future marketing budget allocations.
While none of the approaches reviewed here completely resolves the dilemma of trying to measure marketing pro-ductivity, each contributes insights which help link market-ing measures more closely with marketmarket-ing productivity and, ultimately, with shareholder return.
References
[1] Day G, Fahey L. Valuing marketing strategies. J Mark 1988;52: 45 – 57 (July).
[2] Srivastava RK, Shervani TA, Fahey L. Market-based assets and shareholder value: a framework for analysis. J Mark 1998;62:2 – 18 (January).
[3] Sheth JN, Sisodia RS. Feeling the heat: marketing is under fire to account for what it spends. Mark Manage 1995;4:8 – 23 (Fall). [4] Boles JS, Donthu N, Lohtia R. Salesperson evaluation using relative
performance efficiency: the application of data envelopment analysis. J Pers Selling Sales Manage 1995;15(3):31 – 49.
[5] Schultz DE. Can you improve marketing results by spending less? Mark News 1996;4 and 10 (4/8/96).
[6] Murphy JA. Marketers are productive—they just need to prove it. Mark News 1997;1 and 3 (9/1/97).
[7] Bhargava M, Kim J. Advertising research: a framework for moving from effectiveness to efficiency. In: Donthu N, Johnston W, editors. Keys to marketing effectiveness: working smarter, not harder, vol. 1. Atlanta (GA): Center for the Study of Business and Industrial Markets, Georgia State University, 1998. pp. 1 – 5.
[8] Cook WA, Dunn TF. The changing face of advertising research in the information age: an ARF Copy Research Council survey. J Adverti-sing Res 1996;36(3):55 – 71.
[9] Mehta A. How advertising response modeling can increase ad effec-tiveness. J Advertising Res 1994;34(3):62 – 74.
[10] Rossiter JR, Eagleson G. Conclusions from the ARF’s copy research validity project. J Advertising Res 1994;34(3):19 – 32.
[11] Wiersema F. More bang for the buck. In: CSI index presentations on lean marketing: the immediate imperative. Executive forum, Tucson, 1993. [12] Reichheld F. Loyalty-based management. Harv Bus Rev 1986;64:
59 – 66 (March – April).
[13] Hunt SD, Morgan RM. The comparative advantage theory of compe-tition. J Mark 1995;59:1 – 15 (April).
[14] Aaker DA. Managing brand equity: capitalizing on the value of a brand name. New York: Free Press, 1991.
[15] Keller KL. Conceptualizing, measuring, and managing customer-based brand equity. J Mark 1993;57:1 – 22 (January).
[16] Shocker AD, Srivastava RK, Ruekert RW. Challenges and opportu-nities facing brand management: an introduction to the special issue. J Mark Res 1994;31:149 – 58 (May).
[17] Anderson EW, Sullivan M. The antecedents and consequences of customer satisfaction for firms. Mark Sci 1993;12:125 – 43 (Spring). [18] Yi Y. A critical review of customer satisfaction. In: Zeithaml V, editor.
Review of marketing. Chicago: American Marketing Association, 1990. pp. 68 – 123.
[19] Anderson JC, Narus JA. Rethinking distribution: adaptive channels. Harv Bus Rev 1996;74:112 – 22 (July/August).
[20] Bucklin LP, Sengupta S. Organizing successful co-marketing alli-ances. J Mark 1993;57:32 – 46 (April).
[21] Anderson JC, Narus JA. Business market management: under-standing, creating, and delivering value. Englewood Cliffs (NJ): Prentice-Hall, 1999.
[22] Fornell C. The American Customer Satisfaction Index: nature, pur-pose, and findings. J Mark 1996;60(4):7 – 18.
[23] Anderson JC, Narus JA. Business marketing: understanding what cus-tomers value. Harv Bus Rev 1998;76:53 – 67 (November – December). [24] Weber JA, Dholakia U. Planning market share growth in mature in-dustrial markets. Ind Mark Manage 1998;27:401 – 28 (September). [25] Weber JA. Using purchase influence niching for better focus in
in-dustrial marketing plans: observations and examples. Ind Mark Ma-nage 1994;23:419 – 38 (December).
[26] Weber JA. Planning corporate growth with inverted product life cycles. Long Range Plann 1976;9:12 – 29 (October).
[27] Weber JA. Growth opportunity analysis. Englewood Cliffs (NJ): Reston/Prentice-Hall, 1976 (256 pp.).
[28] Weber JA. Using market structure profiles to compare strategic growth opportunities. Calif Manage Rev 1977;20:34 – 48 (Fall).
[29] Cooper R, Kaplan RS. Profit priorities from activity-based costing. Harv Bus Rev 1991;69:130 – 7 (May – June).
[30] Foster G, Gupta M. Marketing, cost management, and management accounting. J Manage Account Res 1994;6:43 – 77 (Fall).
[31] Turney PB. What an activity-based cost model looks like. Cost Ma-nage Concepts Princ 1992;10:54 – 60 (Winter).
[32] Kotler P. Marketing management: analysis, planning, implementation, and control. Englewood Cliffs (NJ): Prentice-Hall, 1999.
[33] Abell DF. Defining the business: the starting point of strategic plan-ning. Englewood Cliffs (NJ): Prentice-Hall, 1980.
[34] Ramaswamy V, Gatignon H, Reibstein DJ. Competitive marketing behavior in industrial markets. J Mark 1994;58:45 – 55 (April). J.A. Weber / Industrial Marketing Management 31 (2002) 705–717 717