Original article:
PREDICTION OF AROMATASE INHIBITORY ACTIVITY
USING THE EFFICIENT LINEAR METHOD (ELM)
Watshara Shoombuatong1, Veda Prachayasittikul1,2, Virapong Prachayasittikul2, Chanin Nantasenamat1,2,*1
Center of Data Mining and Biomedical Informatics, Faculty of Medical Technology, Mahidol University, Bangkok 10700, Thailand
2
Department of Clinical Microbiology and Applied Technology, Faculty of Medical Technology, Mahidol University, Bangkok 10700, Thailand
* Corresponding author:E-mail: [email protected] (C.N.); Phone: +66 2 441 4371; Fax: +66 2 441 4380
http://dx.doi.org/10.17179/excli2015-140
This is an Open Access article distributed under the terms of the Creative Commons Attribution License (http://creativecommons.org/licenses/by/4.0/).
ABSTRACT
Aromatase inhibition is an effective treatment strategy for breast cancer. Currently, several in silico methods have been developed for the prediction of aromatase inhibitors (AIs) using artificial neural network (ANN) or support vector machine (SVM). In spite of this, there are ample opportunities for further improvements by de-veloping a simple and interpretable quantitative structure-activity relationship (QSAR) method. Herein, an effi-cient linear method (ELM) is proposed for constructing a highly predictive QSAR model containing a spontane-ous feature importance estimator. Briefly, ELM is a linear-based model with optimal parameters derived from genetic algorithm. Results showed that the simple ELM method displayed robust performance with 10-fold cross-validation MCC values of 0.64 and 0.56 for steroidal and non-steroidal AIs, respectively. Comparative analyses with other machine learning methods (i.e. ANN, SVM and decision tree) were also performed. A thor-ough analysis of informative molecular descriptors for both steroidal and non-steroidal AIs provided insights in-to the mechanism of action of compounds. Our findings suggest that the shape and polarizability of compounds may govern the inhibitory activity of both steroidal and non-steroidal types whereas the terminal primary C(sp3) functional group and electronegativity may be required for non-steroidal AIs. The R code of the ELM method is available at http://dx.doi.org/10.6084/m9.figshare.1274030.
Keywords: efficient linear method, genetic algorithm, aromatase, aromatase inhibitors, QSAR, data mining
INTRODUCTION
Cancers are important health issues due to their life-threatening consequences and impacts on the quality of life. Breast cancer is the most common cancer in women and is ranked as the second most common cause of death in women worldwide (Yeo et al., 2014). The incidence of breast cancer has continuously increased despite improved
di-agnostic and surgical techniques (May, 2014). Therefore, worthy attention has been drawn to the treatment and prevention of this cancer to improve the survival rates and quality of life. Estrogen is a steroidal hor-mone that is essential for many physiological functions (Couse and Korach, 1999; Cutolo and Wilder, 2000; Martín-Millán and Castañeda, 2013; Michet Jr et al., 1985; Pettersson and Gustafsson, 2001; Straub,
2007). However, estrogen can facilitate the growth of many estrogen-dependent cancers, including breast (Osborne, 1998; Simpson et al., 2000) and endometrial cancer (Watanabe et al., 1995; Yamaki et al., 1985; Yang et al., 2002). The synthesis of estrogen is a multi-step process in which the rate-limiting multi-step of production is facilitated by the aromatase enzyme (Recanatini et al., 2002). Thus, the inhibition of the aromatase enzyme leads to a decreased amount of estrogen products and is considered an effective treatment strategy for breast cancer (Brueggemeier et al., 2005). Recently, many aromatase inhibitors have been developed and clinically used for breast cancer treatment with favorable treatment outcomes (Sainsbury, 2013). Aromatase in-hibitors are classified according to their che-mical structure and mechanism of action into steroidal and non-steroidal types (Recanatini et al., 2002). It should be noted that the in-herent properties of each type might govern the interaction with the aromatase enzyme, rendering the inhibitory activity.
Computational approaches have become versatile tools in drug development. Recent-ly, quantitative structure-activity relationship (QSAR) was utilized for predicting the aro-matase inhibitory activity of steroidal and non-steroidal AIs using a decision tree meth-od with acceptable prediction results (Nantasenamat et al., 2013). Although useful and interpretable, the aforementioned model affords performance with significantly dif-ferent values between the training and 10-fold cross-validation (10-10-fold CV) sets with accuracies of 92.22 % and 71.67 % for ste-roidal AIs as well as 93.88 % and 76.79 % for non-steroidal AIs. It can be assumed that either the molecular descriptors or the learn-ing method (Nantasenamat et al., 2013) was not optimal for predicting the activity of ste-roidal and non-steste-roidal AIs. Previously, support vector machine (SVM) had been successfully used to model a wide variety of biological activity. In fact, such SVM-based model is well recognized as one of the most powerful learning approach outperforming
other learning methods such as artificial neu-ral networks (ANN) and multiple linear re-gression (MLR) (Attar and Bulun, 2006; Brueggemeier et al., 2005, 1990). The limita-tion of this model is its low interpretability whereby prediction is performed in a black-box manner, i.e., practitioners may not gain insights into which molecular descriptors highly influenced the activity/inactivity of chemical compounds.
To alleviate those problems, building a QSAR model should greatly concern the fol-lowing: (i) develop a generalized QSAR model that is established from the efficient optimization approach; (ii) construct a QSAR model that can automatically identify informative features from a large pool of mo-lecular descriptors for providing a better un-derstanding of the mechanism of chemical compounds; and (iii) provide a white-box approach that is simple, user-friendly and af-ford acceptable prediction results.
In this study, we propose an efficient lin-ear method (ELM) that can be utilized for both estimating the feature importance and constructing the QSAR model. Particularly, the ELM method estimates informative fea-tures from their score usage. Consequently, the ELM model is constructed in a straight-forward fashion by considering only the weighted-sum product and the threshold. Prediction results indicated that the proposed ELM method was comparable to that of the SVM-based method and yielded an outstand-ing performance when compared to ANN-based method. Remarkably, these results in-dicated that the selected molecular de-scriptors provided improvements over the previous study (Nantasenamat et al., 2013). The molecular descriptor importance was analyzed to provide insights in correlating molecular descriptors with their aromatase inhibitory activity. Results from performance comparison demonstrated that the proposed ELM method is an efficient and effective learning approach for predicting the aroma-tase inhibitory activity for steroidal and non-steroidal AIs thereby improving upon the
previous approach. Furthermore, the ELM method could be used to analyze other chem-ical compounds a priori.
MATERIALS AND METHODS
Data set
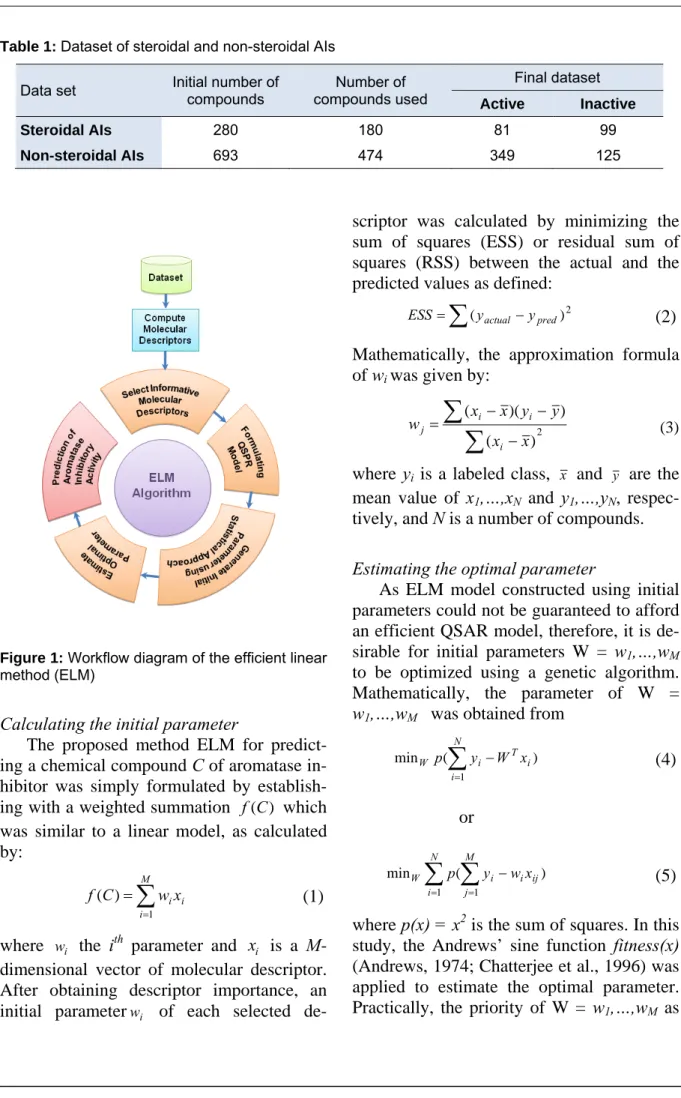
A large dataset of compounds affording aromatase inhibitory activities was obtained from our previous compilation (Nantaseamat et al., 2013). This set contained 973 non-re-dundant compounds in which 280 and 693 were steroidal and non-steroidal AIs, respec-tively. Removing the intermediate activity with pIC50 values in the range of 5 to 6
re-sulted in a final set of 180 steroids (81 active and 99 inactive) and 474 non-steroids (349 active and 125 inactive) as summarized in Table 1.
Molecular descriptors were also obtained from the aforementioned study in which they were based on low-energy conformers com-puted at the semi-empirical AM1 level. The descriptors constituted two subsets: (i) quan-tum chemical and (ii) molecular descriptors. Briefly, the former subset was comprised of mean absolute charge (Qm), energy, dipole
moment (μ), highest occupied molecular or-bital (HOMO), lowest unoccupied molecular orbital (LUMO) and the energy gap of the HOMO and LUMO states (HOMO-LUMO). The latter set is made up of 3,224 molecular descriptors that were computed from Dragon version 5.5.
Efficient Linear Model
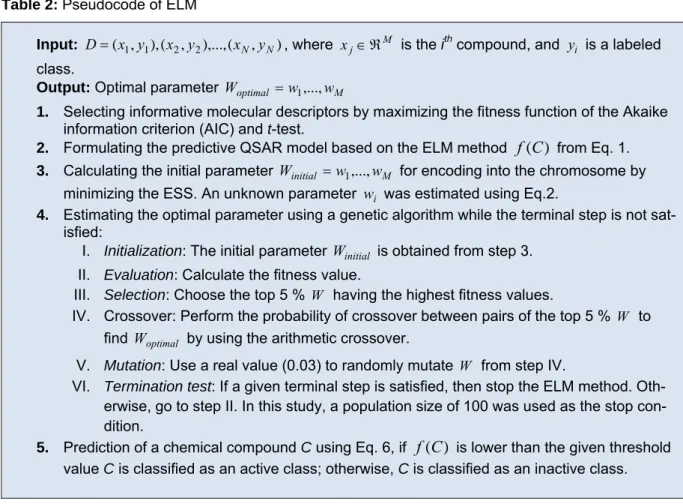
The proposed ELM is a general-purpose method for establishing a QSAR model by identifying important descriptors that are well correlated with the activity. The predic-tive result was directly obtained from the weighted-sum product and threshold. A flowchart of the proposed ELM method is shown in Figure 1 and its pseudocode is shown in Table 2. The R code of the ELM algorithm is available at http://dx.doi.org/ 10.6084/m9.figshare.1274030. The procedu-re of the ELM method consists of the
fol-lowing steps: (i) selecting informative mo-lecular descriptors, (ii) calculating an initial parameter using a statistical approach, (iii) estimating an optimal parameter for enhanc-ing the performance of the ELM method, and (iv) predicting steroidal and non-steroidal AIs. Establishing the ELM model for pre-dicting steroidal and non-steroidal AIs was very simple by replacing the compound data of steroidal AIs with those of non-steroidal AIs without significantly modifying the ar-chitecture of the QSAR model.
Selecting informative molecular descriptors
The identification of informative molecu-lar descriptors provides an accurate and non-overfitting predictive QSAR model while al-so providing deeper insight into steroidal and non-steroidal AIs of the aromatase inhibitor (Nantasenamat et al., 2009; Saeys et al., 2007; Shoombuatong et al., 2012).
Herein, GA was used to select important molecular descriptors (Scrucca, 2012). The foundations of GA were originally devel-oped by Holland (1992) and were based on the evolutionary processes of biological or-ganisms in nature. In this study, selection of informative molecular descriptors was per-formed such that the ELM model was estab-lished through the fitness function of the Akaike information criterion (AIC) and t-test (set at a p-value < 0.001). The compound was first encoded as molecular descriptors into 637-dimensional and 905–dimensional vectors for steroidal and non-steroidal AIs, respectively, as directly obtained from the previous study (Nantasenamat et al., 2013). Our proposed method offers an easy way to rank and identify informative molecular de-scriptors using the usage frequency. In this study, the probability of the population size was set at 100 (Scrucca, 2012). Thus, molec-ular descriptors with 100 and 0 feature usag-es are the busag-est and worst dusag-escriptors of im-portance, respectively. Finally, a descriptor having high feature usages was then used as a set of informative descriptors to construct the ELM model.
Table 1: Dataset of steroidal and non-steroidal AIs
Data set Initial number of compounds compounds used Number of Final dataset
Active Inactive
Steroidal AIs 280 180 81 99
Non-steroidal AIs 693 474 349 125
Figure 1: Workflow diagram of the efficient linear
method (ELM)
Calculating the initial parameter
The proposed method ELM for predict-ing a chemical compound C of aromatase in-hibitor was simply formulated by establish-ing with a weighted summation f(C) which was similar to a linear model, as calculated by: i M i ix w C f
1 ) ( (1)where wi the ith parameter and xi is a M -dimensional vector of molecular descriptor. After obtaining descriptor importance, an initial parameterwi of each selected
de-scriptor was calculated by minimizing the sum of squares (ESS) or residual sum of squares (RSS) between the actual and the predicted values as defined:
2
) (yactual ypred
ESS (2)
Mathematically, the approximation formula of wiwas given by:
2 ) ( ) )( (
x x y y x x w i i i j (3)where yi is a labeled class, x and y are the
mean value of x1,…,xN and y1,…,yN,
respec-tively, and N is a number of compounds.
Estimating the optimal parameter
As ELM model constructed using initial parameters could not be guaranteed to afford an efficient QSAR model, therefore, it is de-sirable for initial parameters W = w1,…,wM
to be optimized using a genetic algorithm. Mathematically, the parameter of W =
w1,…,wM was obtained from
) ( min 1 i N i T i W p
y W x (4) or
N i M j ij i i W p y wx 1 1 ) ( min (5)where p(x) = x2 is the sum of squares. In this study, the Andrews’ sine function fitness(x) (Andrews, 1974; Chatterjee et al., 1996) was applied to estimate the optimal parameter. Practically, the priority of W = w1,…,wM as
Table 2: Pseudocode of ELM
Input: D(x1,y1),(x2,y2),...,(xN,yN), where xjM is the ith compound, and yi is a labeled class.
Output: Optimal parameter Woptimal w1,...,wM
1. Selecting informative molecular descriptors by maximizing the fitness function of the Akaike
information criterion (AIC) and t-test.
2. Formulating the predictive QSAR model based on the ELM method f(C) from Eq. 1.
3. Calculating the initial parameter Winitial w1,...,wM for encoding into the chromosome by
minimizing the ESS. An unknown parameter wi was estimated using Eq.2.
4. Estimating the optimal parameter using a genetic algorithm while the terminal step is not
sat-isfied:
I. Initialization: The initial parameter Winitial is obtained from step 3. II. Evaluation: Calculate the fitness value.
III. Selection: Choose the top 5 % W having the highest fitness values.
IV. Crossover: Perform the probability of crossover between pairs of the top 5 % W to find Woptimal by using the arithmetic crossover.
V. Mutation: Use a real value (0.03) to randomly mutate W from step IV.
VI. Termination test: If a given terminal step is satisfied, then stop the ELM method. Oth-erwise, go to step II. In this study, a population size of 100 was used as the stop con-dition.
5. Prediction of a chemical compound C using Eq. 6, if f(C) is lower than the given threshold value C is classified as an active class; otherwise, C is classified as an inactive class.
ranked according to the fitness values that were calculated based on the fitness function
p(x). By maximizing the fitness values gen-eration by gengen-eration, the optimum parame-ter with the highest fitness values could be found in the terminal process. To perform the proposed ELM method, the probability of mutation in the parent chromosome, the population size, and the maximum number of generations were set as 0.03, 100, and 1000, respectively (Scrucca, 2012).
Prediction of steroidal and non-steroidal AIs
For predicting the aromatase inhibitory activity of a chemical compound C, the pre-diction results (Pred(C)) were obtained using the weighted summation f(C) and conse-quently discriminated using only the thresh-old, as obtained from
Pred(C) otherwise inactive threshold C f active , ) ( , (6)
where the threshold was obtained by sub-tracting the average total weighted summa-tion in the inactive class from the average of total weighted summation in the active class. Because active and inactive classes were en-coded with 1 and 2, respectively, a com-pound with a low-weighted summation
) (C
f tended to be an active class.
Performance evaluation
Four measurements were used to assess the performance of our proposed ELM method, namely accuracy (Acc), sensitivity (Sen), specificity (Spec), and the Matthews correlation coefficient (MCC) defined as Sen=TP/(TP+FN)*100, Spec=TN/(TN+FP) *100 and Acc=((TP+TN)/(TP+FN+TN+FP)) *100, where TP, TN, FP and FN are the number of true positives, true negatives, false positives and false negatives, respec-tively. The MCC parameter is used in ma-chine learning for evaluating a computational method’s performance in binary
classifica-tion (Vihinen, 2012). The performance of ELM was evaluated using a 10-fold cross-validation (10-fold CV) procedure. For the 10-fold CV process, a dataset was randomly split into ten subsets of roughly the same size. During the experiment with the 10-fold CV, nine of the ten subsets were used for training, and the remaining subset was used for validation. This is carried out iteratively and the final results were averaged across the 10 validated subsets.
RESULTS AND DISCUSSION In this study, we propose a simple and general-purpose learning method for predict-ing active and inactive steroidal and non-steroidal AIs. The ELM method was further used in selecting informative molecular de-scriptors owing to its built-in function for descriptor importance estimation. Due to the non-deterministic characteristics of the ELM method, 10 individual experiments were used to optimize the ELM model. The ELM method was benchmarked with previously reported approach (Nantasenamat et al., 2013). Furthermore, well-known learning methods, i.e., support vector machine (SVM) and artificial neural network (ANN), are also used for comparison with the proposed ELM method. Finally, important molecular de-scriptors derived from the ELM method were analyzed to further gain insights into the mo-lecular basis of the aromatase inhibitors.
Prediction accuracy of steroidal AIs
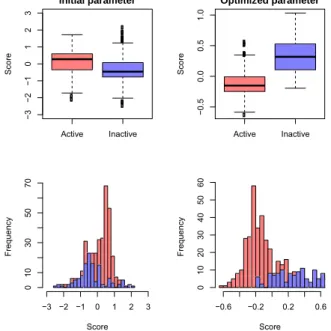
Informative molecular descriptors are critical for designing an accurate QSAR model and providing a good understanding of the aromatase inhibitory activity (Nanta-senamat et al., 2009, 2010; Saeys et al., 2007; Shoombuatong et al., 2012). After de-scriptor selection, the list of selected molecu-lar descriptors for constructing the ELM model is shown in Supplementary Table S1. The performance of ELM as a function of parameter optimization can be seen from the histogram and box plot (Figure 2) in which the distribution of the weighted summation
) (C
f between the initial (left) and optimized
(right) parameters are shown. As observed, the box plot shows that the distribution of
) (C
f using the optimized parameter was well separable compared to using the initial parameter. Furthermore, the histogram clear-ly shows the decrease of f(C) in the over-lapping region when using the optimal pa-rameter. It can be assumed that the ELM method could provide an improvement in the performance after optimizing the initial pa-rameter.
The performance of the ELM method us-ing the initial parameter afforded 67.78 % accuracy, 90.12 % sensitivity, 49.49 % spec-ificity, and 0.42 MCC. The QSAR model of ELM using the initial parameter is given be-low: f (C)initial = 0.13(C-025) (7) + 6.70(ESpm13r) + 2.95(ESpm14u) + 5.84(ESpm10r) + 5.49(ESpm12x) + 0.12(ESpm15d) + 6.33(ESpm10x) + 0.07(H-050) + 0.04(nBM) + 1.52(MATS6p) + 1.52(MATS6e) + 0.94(GATS6m) + 1.03(GATS6p) + 0.29(piPC07) + 0.08(GGI1)
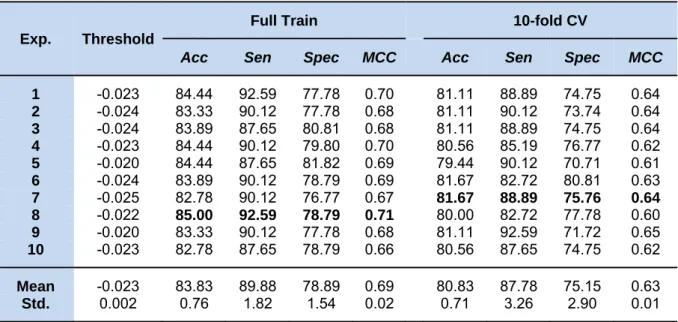
where the threshold was denoted as -0.883. After optimization, the prediction results from 10 individual experiments of ELM us-ing the 10 sets of optimized parameters are given in Table 3. As observed, the 8th exper-iment yielded the best performance on the full training data with 85.00 % accuracy, 92.59 % sensitivity, 78.79 % specificity, and 0.71 MCC, and the average result of those 10 individual experiments was in the range of 83.83 ± 0.76 % accuracy, 89.88 ± 1.82 % sensitivity, 78.89 ± 1.54 % specificity, and 0.69 ± 0.02 MCC. As for the result of the 10-fold CV procedure, the threshold of -0.025 in the 7th experiment showed superiority in pre-dicting steroidal AIs by achieving the highest performance of 81.67 % accuracy, 88.89 % sensitivity, 75.76 % specificity, and 0.64 MCC. Meanwhile, the average result of those 10 individual experiments was 80.83 ± 0.71 % accuracy, 87.78 ± 1.82 % sensitivi-ty, 75.15 ± 2.90 % specificisensitivi-ty, and 0.63 ± 0.01 MCC. The efficient QSAR model de-rived from ELM using the optimized para-meter is given below:
f (C)optimized = 0.13(C-025) (8) –15.24(ESpm13r) + 9.23 ESpm14u) + 5.30(ESpm10r) – 5.94(ESpm12x) + 0.15(ESpm15d) + 5.43(ESpm10x) + 0.13(H-050) + 3.85 (MATS6p) – 3.15(MATS6e) – 2.32(GATS6m) + 1.58 (GATS6p) + 0.23(piPC07) – 0.03(GGI1)
The prediction results of other experi-ments and their optimal parameter sets are given in Table 3 and Supplementary Table S1, respectively. As observed from Table 3, the prediction results from the full training data and the 10-fold CV procedure were not obviously different. These results indicate that our proposed ELM method could allevi-ate the overfitting problem.
Prediction accuracy of non-steroidal AIs
In this study, the establishment of the ELM model for predicting non-steroidal AIs was very simple by replacing the compound of steroidal AIs with non-steroidal AIs. The 15 important molecular descriptors were selected for designing an accurate ELM model, as shown in Supplementary Table S2. In the same way as in the analysis of steroi-dal AIs, the distribution of the prediction re-sults based on the weighted summation f(C)
Figure 2: Box and histogram plots of the
weighted summation f(C) of steroidal AIs ob-tained using the initial parameter (left) and the optimal parameter (right).
(removed from Eq. 2) based on the weighted summation f(C) (removed from Eq. 2) using the initial and optimized parameters are rep-resented with a histogram and box plot, as shown in Figure 2. The overview distribution between the active and inactive compounds
Table 3: The 10 independent experiments of our proposed ELM method for predicting steroidal AIs
Exp. Threshold
Full Train 10-fold CV
Acc Sen Spec MCC Acc Sen Spec MCC
1 -0.023 84.44 92.59 77.78 0.70 81.11 88.89 74.75 0.64 2 -0.024 83.33 90.12 77.78 0.68 81.11 90.12 73.74 0.64 3 -0.024 83.89 87.65 80.81 0.68 81.11 88.89 74.75 0.64 4 -0.023 84.44 90.12 79.80 0.70 80.56 85.19 76.77 0.62 5 -0.020 84.44 87.65 81.82 0.69 79.44 90.12 70.71 0.61 6 -0.024 83.89 90.12 78.79 0.69 81.67 82.72 80.81 0.63 7 -0.025 82.78 90.12 76.77 0.67 81.67 88.89 75.76 0.64 8 -0.022 85.00 92.59 78.79 0.71 80.00 82.72 77.78 0.60 9 -0.020 83.33 90.12 77.78 0.68 81.11 92.59 71.72 0.65 10 -0.023 82.78 87.65 78.79 0.66 80.56 87.65 74.75 0.62 Mean -0.023 83.83 89.88 78.89 0.69 80.83 87.78 75.15 0.63 Std. 0.002 0.76 1.82 1.54 0.02 0.71 3.26 2.90 0.01
The 7th and 8th experiments yielded the highest accuracy and MCC for full train validation and 10-fold cross-validation.
Active Inactive − 10 − 50 5 10 Initial parameter Sc o re Active Inactive − 1. 0 − 0. 5 0. 0 0. 5 1. 0 Optimized parameter Sc o re Score Fr eq uen cy −10 −5 0 5 10 0 5 10 15 2 0 Score Fr eq uen cy −1.0 −0.6 −0.2 0.2 0 5 10 15
showed that the distribution of f(C) was well separable and mitigated the overlapping re-gion after the initial parameter was opti-mized using the ELM method. This result demonstrates the ability of the ELM method to provide an efficient parameter.
The performance of the proposed ELM method construction with the initial parame-ter was 61.81 % accuracy, 71.35 % sensitivi-ty, 35.20 % specificisensitivi-ty, and 0.06 MCC. The QSAR model based on the ELM method us-ing the initial parameter is given below:
f (C)initial = 0.01(nAB) + (9) 0.31(piPC05)+ 0.37(BEHp4) + 0.24(Yindex) + 0.02(F04[O-O]) + 0.09(EEig09x) + 0.08(GATS5e) + 0.03(nCp) + 0.16(ATS5p) + 0.16(piPC08) + 0.14(EEig04x) + 0.31(piPC06) + 0.53(ESpm01x) + 0.13(F04[C-O]) + 0.38(BEHe4)
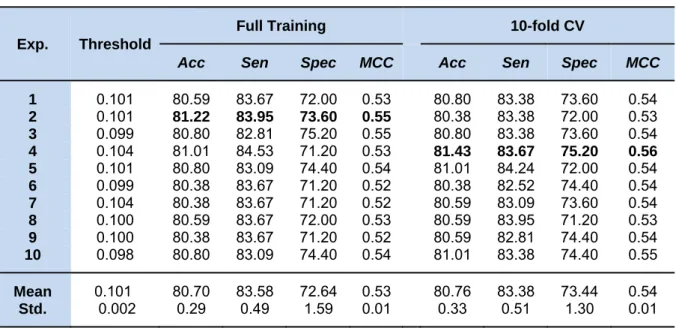
where the threshold was set at -0.912. Meanwhile, Table 4 shows the prediction re-sults of 10 individual experiments of ELM using the 10 sets of optimized parameters. After the optimization process, the 2nd exper-iment provided the optimum performance of the full training data with 81.22 % accuracy,
83.95 % sensitivity, 73.60 % specificity, and 0.55 MCC, and the average results of those individual experiments were in the range of 80.70 ± 0.29 % accuracy, 83.58 ± 0.49 % sensitivity, 72.64 ± 1.59 % specificity, and 0.53 ± 0.01 MCC. For the performance of the ELM method with the 10-fold CV proce-dure, the 4th experiment showed superiority in predicting non-steroidal AIs with a threshold of 0.104. The highest performance was 81.43 % accuracy, 83.67 % sensitivity, 75.20 % specificity, and 0.56 MCC. The av-erage results of accuracy, sensitivity, speci-ficity, and MCC were 80.76 ± 0.33 %, 83.38 ± 0.51 %, 73.44 ± 1.30 %, and 0.54 ± 0.01, respectively. The QSAR model based on the ELM model using the optimized pa-rameter is given below:
f (C)optimized = -0.02(nAB) (10) + 2.10(piPC05) -2.19 (BEHp4) + 1.08 (Yindex) + 0.13 (F04[O-O]) + 0.23 (EEig09x) + 0.15 (GATS5e) + 0.11 (nCp) -0.46 (ATS5p) + 0.95 (piPC08) -0.40 (EEig04x) – 3.00 (piPC06) + 1.25 (ESpm01x) – 0.01 (F04[C-O]) + 2.14 (BEHe4)
Table 4: The 10 independent experiments of our proposed ELM method for predicting non-steroidal
AIs
Exp. Threshold
Full Training 10-fold CV
Acc Sen Spec MCC Acc Sen Spec MCC
1 0.101 80.59 83.67 72.00 0.53 80.80 83.38 73.60 0.54 2 0.101 81.22 83.95 73.60 0.55 80.38 83.38 72.00 0.53 3 0.099 80.80 82.81 75.20 0.55 80.80 83.38 73.60 0.54 4 0.104 81.01 84.53 71.20 0.53 81.43 83.67 75.20 0.56 5 0.101 80.80 83.09 74.40 0.54 81.01 84.24 72.00 0.54 6 0.099 80.38 83.67 71.20 0.52 80.38 82.52 74.40 0.54 7 0.104 80.38 83.67 71.20 0.52 80.59 83.09 73.60 0.54 8 0.100 80.59 83.67 72.00 0.53 80.59 83.95 71.20 0.53 9 0.100 80.38 83.67 71.20 0.52 80.59 82.81 74.40 0.54 10 0.098 80.80 83.09 74.40 0.54 81.01 83.38 74.40 0.55 Mean 0.101 80.70 83.58 72.64 0.53 80.76 83.38 73.44 0.54 Std. 0.29 0.49 1.59 0.01 0.002 0.33 0.51 1.30 0.01
The 2nd and 4th experiments yielded the highest accuracy and MCC for full train validation and 10-fold
Figure 3: Box and histogram plots of the
weighted summation f(c) of non-steroidal AIs ob-tained using the initial parameter (left) and the optimal parameter (right).
Table 4 and Supplementary Table S2 provide details of other experiments and their optimized parameter sets, respectively. As observed in Table 4, the overall predic-tion results from the full training data and the 10-fold CV procedure were not only obvi-ously different but also performed well in the 10-fold CV procedure.
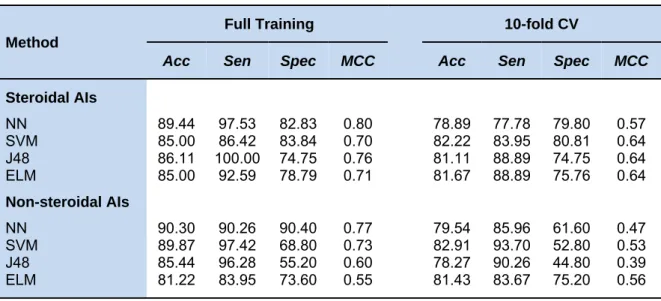
Performance of ELM versus the existing and related QSAR methods
A large QSAR model of steroidal and non-steroidal AIs was first proposed by us (Nantasenamat et al., 2013). The decision tree based on the 13 molecular descriptors was applied to discriminate between the ac-tive and inacac-tive steroidal and non-steroidal AIs. The prediction results of steroidal AIs yielded as high as 92.22 % accuracy, 93.81 % sensitivity, and 90.36 % specificity when using the full training dataset of AIs, and the results of the 10-fold CV procedure dramatically decreased to 71.67 % accuracy, 76.09 % the ELM method as given in Sup-plementary Table S1 (7th experiment) and S2 (4th experiment) for steroidal and non-ste-roidal AIs, respectively. The comparison
ac-curacies of the full training dataset and the 10-fold CV procedure were not very differ-ent, ranging from 86.11 % to 81.11 % and from85.44 % to 78. % for predicting steroi-dal and non-steroisteroi-dal AIs, respectively. The-se results demonstrate that the QSAR model that was established from our selected de-scriptors afforded significant improvements (Nantasenamat et al., 2013). Furthermore, the well-known learning methods comprising of SVM and ANN were also used to com-pare with our proposed ELM method. For fair comparisons, the SVM and ANN model were constructed with our selected molecular descriptors and tuned with their optimum pa-rameter. In this study, the SVM model with a radial basis kernel function exp(||xi xj||2) from LIBSVM (Chang and Lin, 2011) was used, where xi and xj are the ith and jth com-pounds of aromatase inhibitors, and is a kernel parameter. The parameters y
} 2 ,..., 2 , 2 { 8 7 8
and the cost parameter
} 2 ,..., 2 , 2 { 8 7 8
C were determined using the grid search method. Meanwhile, the ANN model was optimized by estimating the number of hidden layers (Kuhn, 2008). The comparison results are shown in Table 5.
As observed, the QSAR model based on SVM using C = 4.0 and = 0.0625 provided the best accuracy, specificity, and MCC, which were as high as 82.22 %, 80.81 %, and 0.64, respectively, as evaluated with the 10-fold CV procedure for predicting the ac-tivity of steroidal AIs. Meanwhile, the pro-posed ELM method could afford a compara-ble prediction results with 81.67 % accuracy, 75.76 % specificity, and 0.64 MCC and also yielded a greater sensitivity. For predicting the activity of non-steroidal AIs, the QSAR model based on SVM using C = 32.0 and = 0.0312 and that of our proposed ELM meth-od were comparable and provided higher performances than other QSAR models. The QSAR model based on SVM yielded the highest accuracy and sensitivity at 82.91 % and 93.70 %, respectively, and the ELM method achieved a specificity and MCC of 75.20 % and 0.56, respectively. Active Inactive − 3 − 2 − 10 1 2 3 Initial parameter Sc o re Active Inactive − 0.5 0. 0 0.5 1 .0 Optimized parameter Sc o re Score F req ue n cy −3 −2 −1 0 1 2 3 0 1 03 05 07 0 Score F req ue n cy −0.6 −0.2 0.2 0.6 0 1 02 03 04 05 0 60
Table 5: Performance comparison of the proposed ELM method with existing and other related
meth-ods
Method
Full Training 10-fold CV
Acc Sen Spec MCC Acc Sen Spec MCC
Steroidal AIs NN 89.44 97.53 82.83 0.80 78.89 77.78 79.80 0.57 SVM 85.00 86.42 83.84 0.70 82.22 83.95 80.81 0.64 J48 86.11 100.00 74.75 0.76 81.11 88.89 74.75 0.64 ELM 85.00 92.59 78.79 0.71 81.67 88.89 75.76 0.64 Non-steroidal AIs NN 90.30 90.26 90.40 0.77 79.54 85.96 61.60 0.47 SVM 89.87 97.42 68.80 0.73 82.91 93.70 52.80 0.53 J48 85.44 96.28 55.20 0.60 78.27 90.26 44.80 0.39 ELM 81.22 83.95 73.60 0.55 81.43 83.67 75.20 0.56
These results indicated that the proposed ELM method could address the following three characteristics: 1) achieve a simple model with acceptable performance at the specified threshold, 2) providing a built-in feature importance estimator and 3) prevent-ing and alleviatprevent-ing the overfittprevent-ing problem.
Analysis of important molecular descriptors
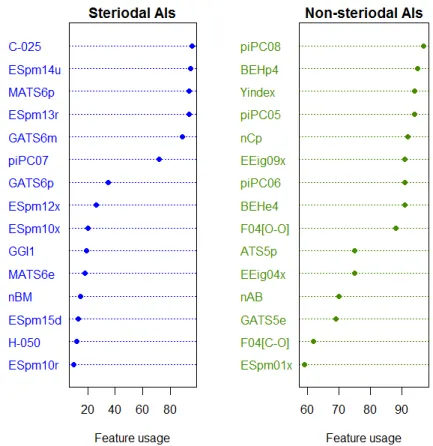
Molecular descriptors play an important role in improving the QSAR model and providing the essential information of a mol-ecule in terms of its physicochemical proper-ties (Nantasenamat et al., 2009). Thus, the identification of informative molecular de-scriptors will provide insight into the under-lying mechanism of aromatase inhibitors. In this study, a molecular descriptor with the largest feature usage was deemed to be the most efficient descriptor. Figure 4 shows the value of the feature usage: steroidal (left) and non-steroidal (right) AIs. The top-four in-formative molecular descriptors of steroidal AIs were C-025, ESpm14u, ESpm13r, and MATS6p, with usage values that were great-er than 90. The most important molecular descriptor was C-025, with a feature usage value of 96. Interestingly, 8 out of 15 in-formative molecular descriptors of non-steroidal AIs had usage values that were
greater than 90, and the most important mo-lecular descriptor was piPC08, with a feature usage value of 96. The definition of an in-formative molecular descriptor is provided in Table 6. The steroidal and non-steroidal AIs exerted their inhibitory activity via a distinct mechanism. Steroidal AIs competitively and covalently bind the active site of the aroma-tase enzyme in an irreversible manner (Brueggemeier et al., 1990), whereas non-steroidal AIs coordinates with the heme iron (Fe) atom of the enzyme thereby giving rise to reversible inhibition (Graves and Salhanick, 1979). For the steroidal type, at-om-centered-fragments, edge adjacency in-dices and 2D autocorrelation descriptors were highlighted as informative descriptors with large usage values. C-025 is the most informative one and is defined by looking at the central carbon atom on an aromatic ring and its neighboring atoms. The edge adja-cency indices descriptors, i.e., ESpm14u and ESpm13r, represent the connectivity or bonding relationships between the atoms, and MATS6p is involved with the polariza-bility of molecules. Polarizapolariza-bility is the per-manent or induced distortion of electron dis-tribution within a molecule (Nogrady and Weaver, 2005), in other words, the ability of a molecule to be polarized. The presence
Figure 4: Important molecular descriptors for steroidal (left) and non-steroidal AIs (right), which are
ranked according to their feature usages
Table 6: Definition of informative molecular descriptorsa of steroidal and non-steroidal AIs
Descriptor Type Definition
Steroidal C-025 Atom-centered
frag-ments R--CR--R
ESpm14u Edge adjacency indices Spectral moment 14 from the edge adj. matrix
ESpm13r Edge adjacency indices Spectral moment 13 from the edge adj. matrix
as weighted by resonance integrals
MATS6p 2D autocorrelations Moran autocorrelation of lag 6 as weighted by
polarizability
Non-steroidal piPC08 Walk and Path Counts Molecular multiple path count of order 8
piPC05 Walk and Path Counts Molecular multiple path count of order 05
piPC06 Walk and Path Counts Molecular multiple path count of order 06
Yindex information indices Balaban Y index
nCp Functional group counts Number of terminal primary C(sp3)
EEig09x Edge adjacency indices Eigenvalue 09 from the edge adj. matrix as
weighted by edge degrees
BEHe4 Burden eigenvalue
de-scriptors
Highest eigenvalue n. 4 of the Burden matrix / as weighted by atomic Sanderson electroneg-ativities
BEHp4 Burden eigenvalue
de-scriptors Highest eigenvalue n. 4 of Burden matrix / weighted by atomic polarizabilities
and/or arrangement of the central carbon at-om and its neighbors as well as the bonding relationships between atoms may indicate the size and shape of the compounds, where-as the polarizability is closely related to the hydrophobicity of molecules, and their rela-tionship was noted to be an influencing fac-tor of biological activities (Cammarata, 1967; Leo et al., 1969). For the non-steroidal type, most of the informative molecular de-scriptors are related with the molecular graph, polarizability, electronegativity of the compound and a certain functional group, i.e., terminal primary C(sp3). The molecular graph represents the structural formula of the compound and may thereby indicate its size and shape. Therefore, it could be hypothe-sized from our findings that the suitable shape and polarizability of a compound may be essential for both steroidal and non-steroidal AIs in interacting at the enzyme ac-tive site and may govern the process of cell entry in reaching the target site of action. In addition, the roles of certain functional groups were noted for the non-steroidal type.
CONCLUSION
Computational approaches for predicting steroidal and non-steroidal AIs can acceler-ate the drug discovery effort and can poten-tially save cost and time. The continual in-crease in breast cancer prevalence drives the search for novel aromatase inhibitors. This study proposes the ELM method for the pre-diction of aromatase inhibitory activity of steroidal and non-steroidal AIs as well as the estimation of its feature importance. This novel algorithm provides a user-friendly QSAR modeling approach with robust pre-dictive performance. Informative molecular descriptors, which were revealed by the fea-ture usage, provided a better understanding on the mechanism of action for the investi-gated compounds. Our findings suggested that the shape and polarizability of com-pounds may govern the inhibitory activity of both steroidal and non-steroidal types, whereas the terminal primary C(sp3)
func-tional group and electronegativity may only be required for the non-steroidal type.
Conflict of interests
The authors have declared that no com-peting interests exist.
Acknowledgements
We gratefully acknowledge financial support from the following agencies: Mahi-dol University Postdoctoral Fellowship Pro-gram (to W.S. under supervisions of V.P. and C.N.), Mahidol University Goal-Orient-ed Research Grant (to C.N.) and the Office of the Higher Education Commission and Mahidol University under the National Re-search Universities Initiative.
REFERENCES
Andrews DF. A robust method for multiple linear re-gression. Technometrics. 1974;16:523-31.
Attar E, Bulun SE. Aromatase and other steroidogenic genes in endometriosis: translational aspects. Hum Reprod Update. 2006;12:49-56.
Brueggemeier RW, Li PK, Chen HH, Moh PP, Katlic NE. Biochemical and pharmacological development of steroidal inhibitors of aromatase. J Steroid Bio-chem Mol Biol. 1990;37:379-85.
Brueggemeier RW, Hackett JC, Diaz-Cruz ES. Aro-matase inhibitors in the treatment of breast cancer. Endocr Rev. 2005;26:331-45.
Cammarata A. An apparent correlation between the in vitro activity of chloramphenicol analogs and elec-tronic polarizability. J Med Chem. 1967;10:525-7. Chang CC, Lin CJ. LIBSVM: a library for support vector machines. ACM Trans Intell Syst Technol. 2011;2:27.
Chatterjee S, Laudato M, Lynch LA. Genetic algo-rithms and their statistical applications: an introduc-tion. Comput Stat Data Anal. 1996;22:633-51.
Couse JF, Korach KS. Estrogen receptor null mice: What have we learned and where will they lead us? Endocr Rev. 1999;20:358-417.
Cutolo M, Wilder RL. Different roles for androgens and estrogens in the susceptibility to autoimmune rheumatic diseases. Rheum Dis Clin North Am. 2000; 26:825-39.
Graves PE, Salhanick HA. Stereoselective inhibition of aromatase by enantiomers of aminoglutethimide. Endocrinology. 1979;105:52-7.
Holland JH. Adaptation in natural and artificial sys-tems: an introductory analysis with applications to bi-ology, control, and artificial intelligence. Cambridge, MA: MIT Press, 1992.
Kuhn M. Building predictive models in R using the caret package. J Stat Softw. 2008;28:1-26.
Leo A, Hansch C, Church C. Comparison of parame-ters currently used in the study of structure-activity relationships. J Med Chem. 1969;12:766-71.
Martín-Millán M, Castañeda S. Estrogens, osteoar-thritis and inflammation. Joint Bone Spine. 2013;80: 368-73.
May FEB. Novel drugs that target the estrogen-related receptor alpha: Their therapeutic potential in breast cancer. Cancer Manag Res. 2014;6:225-52.
Michet CJ Jr, McKenna CH, Elveback LR, Kaslow RA, Kurland LT. Epidemiology of systemic Lupus Erythematosus and other connective tissue diseases in Rochester, Minnesota, 1950 through 1979. Mayo Clinic Proc. 1985;60:105-13.
Nantasenamat C, Isarankura-Na-Ayudhya C, Naenna T, Prachayasittikul V. A practical overview of quanti-tative structure-activity relationship. EXCLI J. 2009;8:74-88.
Nantasenamat C, Isarankura-Na-Ayudhya C, Pracha-yasittikul V. Advances in computational methods to predict the biological activity of compounds. Exp Opin Drug Discov. 2010;5:633-54.
Nantasenamat C, Li H, Mandi P, Worachartcheewan A, Monnor T, Isarankura-Na-Ayudhya C, et al. Ex-ploring the chemical space of aromatase inhibitors. Mol Div. 2013;17:661-77.
Nogrady T, Weaver DF. Medical chemistry: a molec-ular and biochemical approach. 3rd ed. New York: Oxford Univ. Pr., 2005.
Osborne CK. Steroid hormone receptors in breast cancer management. Breast Cancer Res Treat. 1998; 51:227-38.
Pettersson K, Gustafsson J-Å. Role of estrogen recep-tor beta in estrogen action. Annu Rev Physiol. 2001; 63:165-92.
Recanatini M, Cavalli A, Valenti P. Nonsteroidal aro-matase inhibitors: recent advances. Med Res Rev. 2002;22:282-304.
Saeys Y, Inza I, Larrañaga P. A review of feature se-lection techniques in bioinformatics. Bioinformatics. 2007;23:2507-17.
Sainsbury R. The development of endocrine therapy for women with breast cancer. Cancer Treat Rev. 2013;39:507-17.
Scrucca L. GA: a package for genetic algorithms in R. J Stat Softw. 2012;53:1-37.
Shoombuatong W, Hongjaisee S, Barin F, Chaijaru-wanich J, Samleerat T. HIV-1 CRF01_AE coreceptor usage prediction using kernel methods based logistic model trees. Comput Biol Med. 2012;42:885-9. Simpson E, Rubin G, Clyne C, Robertson K, O’Donnell L, Jones M, et al. The Role of local estro-gen biosynthesis in males and females. Trends Endo-crinol Metab. 2000;11:184-8.
Straub RH. The complex role of estrogens in inflam-mation. Endocr Rev. 2007;28:521-74.
Vihinen M. How to evaluate performance of predic-tion methods? Measures and their interpretapredic-tion in variation effect analysis. BMC Genomics. 2012;13: S2.
Watanabe K, Sasano H, Harada N, Ozaki M, Niikura H, Sato S, et al. Aromatase in human endometrial car-cinoma and hyperplasia. Immunohistochemical, in situ hybridization, and biochemical studies. Am J Pathol. 1995;146:491-500.
Yamaki J, Yamamoto T, Okada H. Aromatization of androstenedione by normal and neoplastic endometri-um of the uterus. J Steroid Biochem. 1985;22:63-6. Yang S, Fang Z, Suzuki T, Sasano H, Zhou J, Gurates B, et al. Regulation of aromatase P450 expression in endometriotic and endometrial stromal cells by CCAAT/enhancer binding proteins (C/EBPs): de-creased C/EBPbeta in endometriosis is associated with overexpression of aromatase. J Clin Endocrinol Metab. 2002;87:2336-45.
Yeo B, Turner NC, Jones A. An update on the medi-cal management of breast cancer. BMJ. 2014;348: g3608.