REVIEW ARTICLE
PET-guided delineation of radiation therapy treatment
volumes: a survey of image segmentation techniques
Habib Zaidi&Issam El NaqaReceived: 27 October 2009 / Accepted: 20 February 2010 / Published online: 25 March 2010 #Springer-Verlag 2010
Abstract Historically, anatomical CT and MR images were used to delineate the gross tumour volumes (GTVs) for radiotherapy treatment planning. The capabilities offered by modern radiation therapy units and the widespread avail-ability of combined PET/CT scanners stimulated the development of biological PET imaging-guided radiation therapy treatment planning with the aim to produce highly conformal radiation dose distribution to the tumour. One of the most difficult issues facing PET-based treatment planning is the accurate delineation of target regions from typical blurred and noisy functional images. The major problems encountered are image segmentation and imper-fect system response function. Image segmentation is defined as the process of classifying the voxels of an image into a set of distinct classes. The difficulty in PET image segmentation is compounded by the low spatial resolution and high noise characteristics of PET images. Despite the difficulties and known limitations, several image segmen-tation approaches have been proposed and used in the clinical setting including thresholding, edge detection, region growing, clustering, stochastic models, deformable models, classifiers and several other approaches. A detailed description of the various approaches proposed in the
literature is reviewed. Moreover, we also briefly discuss some important considerations and limitations of the widely used techniques to guide practitioners in the field of radiation oncology. The strategies followed for validation and comparative assessment of various PET segmentation approaches are described. Future opportunities and the current challenges facing the adoption of PET-guided delineation of target volumes and its role in basic and clinical research are also addressed.
Keywords PET . Segmentation . Radiation therapy . Treatment planning . Validation
Introduction
The foundation of molecular imaging-guided radiation therapy (MIGRT) lies in the use of advanced multimodality imaging technology for improved delineation of tumour target volumes, thus relating the absorbed dose information to image-based patient representations. This was made possible by the introduction and clinical acceptance of dual-modality single photon emission computed tomography (SPECT)/computed tomography (CT) and positron eEmis-sion tomography (PET)/CT systems in the clinical setting in the late 1990s which has revolutionized the practice of diagnostic imaging [1,2]. Combined PET/CT systems have been operational for almost a decade since their commercial introduction. The complementarity between the intrinsically aligned anatomical (CT) and functional or metabolic (PET) information provided in a “one-stop shop” and the opportunity to reduce scanning time through the use of CT images for attenuation correction of the PET data contributed to the success of this technology and its wide adoption by the medical imaging community.
H. Zaidi (*)
Division of Nuclear Medicine, Geneva University Hospital, 1211 Geneva 4, Switzerland
e-mail: habib.zaidi@hcuge.ch H. Zaidi
Geneva Neuroscience Center, Geneva University, 1205 Geneva, Switzerland
I. El Naqa
Department of Radiation Oncology, Washington University School of Medicine, St. Louis, MO 63110, USA
On the other hand, radiation therapy has gone through a series of revolutions in the last century [3] advocating today the opportunity to generate highly conformal radiation dose distributions through the use of advanced techniques such as intensity-modulated radiation therapy (IMRT) using tomotherapy [4] and volumetric-modulated arc therapy [5] and many other techniques including CyberKnife, heavy ion therapy [6] and many other radiation therapy devices for dose conformity. The improved dose conformity and steep dose gradients have necessitated enhanced patient localization and beam targeting techniques for radiotherapy treatments.
The most critical component of radiation therapy treatment planning is the delineation of the gross tumour volume (GTV) [7]. Historically, anatomical cross-sectional images (mainly CT and in some instances MR) are used to delineate the treatment volumes [8, 9], and radiation treatment beams are planned to completely cover the treatment volume with the aim to deliver a uniform dose distribution to it. CT can provide useful anatomical information and the electronic density required for dosim-etry calculations for radiation therapy treatment planning. However, it has poor soft tissue contrast, which might be insufficient for target and critical organ delineation. MRI provides different signatures of the human body and presents better soft tissue contrast compared to CT. Many investigators reported significant differences in terms of target volume delineation when using MRI compared to CT [10,11]. It has been argued that coregistered CT/MRI data can be used with confidence for accurate delineation of target volumes and critical organs (using MRI) and dose computation (using CT). However, MRI suffers from spatial distortions, intensity inhomogeneity and does not provide electronic tissue density information required for dose calculation in radiation therapy. Moreover, the criteria followed to delineate the GTV are not standardized leading to high inter- and intra-observer variability [12].
The above-discussed limitations together with the en-hanced capabilities offered by advanced treatment units to deliver nonuniform dose patterns by design stimulated the emergence of the biological target volume (BTV) concept [13] made possible by the commercial availability of multimodality molecular imaging platforms [14]. It has therefore been argued that molecular PET/CT imaging may be of additional value and even allow a more correct delineation of the BTV [15–20]. The most interesting aspect related to the use of PET for BTV delineation is mainly the depiction of functional or metabolic rather than morphological information provided by CT or MRI. However, the application of PET for this purpose is not trivial and has many drawbacks. Among the concerns associated with PET-guided radiation therapy treatment planning is the complexity of the procedures that need to be
developed for accurate delineation of target regions from typical blurred and noisy functional images suffering from many instrumentation- and physics-related factors [16,21]. The most important challenges are image segmentation and imperfect system response function. Image segmentation is defined as the process of classifying the voxels of an image into a set of distinct classes. Medical image segmentation has been identified as the key problem of medical image analysis and remains a popular and challenging area of research [22–25]. The difficulty in PET image segmentation is compounded by the low spatial resolution and high noise characteristics of PET images. Despite the difficulties and known limitations, several image segmentation approaches have been proposed and used in the clinical setting including thresholding, region growing, classifiers, clus-tering, edge detection, Markov random field models, deformable models and many other approaches [26–29]. The number of scientific contributions related to this subject has been increasing steadily, which motivated the writing of this survey as a snapshot of the dynamically changing field of PET image segmentation. A detailed description of the various approaches proposed in the literature is given. We also briefly discuss some important considerations and limitations of widely used techniques. The strategies followed for validation and comparative assessment of various PET segmentation approaches are outlined. Future opportunities and the challenges facing the adoption of PET-guided delineation of target volumes and its role in basic and clinical research will also be addressed.
Molecular PET/CT imaging-guided radiation therapy treatment planning
Early attempts to use nuclear medicine imaging and particularly PET for radiation therapy treatment planning date back to the late 1990s [30–37]. An important contribution came from Ling et al. [13] who established the concept of“biological imaging”and moved forward the role of PET in radiation therapy thus allowing it to enter the clinical arena. Since that time, the technical aspects of PET/ CT-guided radiation therapy have been described more thoroughly in the scientific literature [15, 21,38–45]. The success of these initial studies prompted significant interest from the major medical imaging equipment manufacturers who now all have introduced commercial PET/CT scanners equipped with the required accessories (flat couch insert, positioning system, respiratory gating, ...) and software tools (e.g. virtual simulation, visualization and segmenta-tion tools, support of DICOM RT object definisegmenta-tion, ...) for clinical use. The typical workflow for PET/CT-guided radiation therapy treatment planning usually involves (with
few exceptions) strong collaboration between two clinical departments (nuclear medicine and radiation oncology) [21, 46]. With the growing availability of large bore dual-modality PET/CT scanners of the last generation equipped with fixed radiation therapy positioning laser systems in the scanner room, a“one-stop shop”providing diagnostic PET/ CT and radiation therapy planning CT scan in only one session has become possible. It should however be noted that the 80-cm bore required for stereotactic body radio-therapy planning and to accommodate various other positioning aids is available only from one scanner manufacturer at the present time.
The main motivation stimulating the use of PET/CT in radiation therapy is the efficacy of18F-fluorodeoxyglucose (FDG) PET imaging in a wide variety of malignant tumours with sensitivities, specificities and accuracy often in the high 90th percentile range [47]. In that sense, it might provide superior visualization compared to CT simulation, which in some cases might miss some areas that light up on the PET study including the detection of distant metastases, or shed light on the actual lesion volume, which might in reality be smaller on the PET study than on the CT alone. Moreover, discrepancies between anatomical (CT/MRI) and metabolic (PET) findings are very often reported in the literature where the addition of PET significantly impacted patient management and changed the treatment plans in 25– 50% of the cases [16,20,27,38,39,48–53]. Last and not least, inter- and intra-observer variability was considerably reduced when PET information was available for target volume delineation [54–58]. Both state-of-the-art FDG PET and novel PET probes’ applications in the process of radiation therapy treatment planning can be found elsewhere [21, 44, 45, 59] and are beyond the scope of this review, which is solely focused on FDG PET.
Current indications for18F-FDG PET/CT-guided radi-ation therapy treatment planning fall under two classes: established and experimental. Well-established indications include head and neck cancer, lung cancer, gynaecological and oesophageal cancer whereas experimental indications comprise colorectal cancer, breast cancer, lymphoma and malignant melanoma and many other malignancies.
A technical discussion of issues related to margin set-up and link between GTV, clinical treatment volume (CTV), planning treatment volume (PTV) and the BTV is beyond the scope of this review. Interested readers could consult the International Commission on Radiation Units and Measure-ments (ICRU) report defining the relationship between the above-mentioned quantities for use with conventional imaging modalities [7] and updates by other groups following incorporation of PET information [13, 52]. We emphasize that the discussed PET image segmentation algorithms tend to capture the BTV while CTV margins are related to micro-disease extensions. Moreover, due to the
varying biodistribution and contrast of the various probes (see“Challenges and future directions”), different segmen-tation methods might have to be used in the era of multitracer multimodality imaging [60].
Among the many physical degrading factors impacting image quality and quantitative accuracy, partial volume effect is recognized as one of the most important factors impacting tumour imaging [61]. Owing to the limited spatial resolution of clinical PET systems, the resulting images will be blurred by the system response and as a consequence smaller lesions will appear larger. Although the total number of counts is preserved, they are distributed over a larger volume. Partial volume is usually addressed in the context of“small”objects, i.e. with dimensions smaller than around 2–3 times the full-width at half-maximum of the scanner’s point spread function [62]. Several techniques and corrective measures have been developed to address this problem in the context of molecular PET imaging which operate either directly on reconstructed images or are incorporated within the image reconstruction framework with many of them relying on an adjunct coregistered anatomical image (CT or MRI). It should be noted that their availability and implementation in clinical packages for use in the clinical setting are still lacking. Respiratory motion is another challenging issue for lesions located in the thorax and upper abdomen that has been addressed in many different ways [63, 64]. The most successful approaches attempt to overcome the limitations of the traditional approach, which allows obtaining individually reconstructed noisy images through respiratory gating by incorporating motion estimation and correction within the image recon-struction process to obtain images of enhanced quality [65–70].
Survey of PET image segmentation techniques
Over the past few years, several methods have been proposed for target volume definition in radiotherapy treatment planning based on incorporating PET physiolog-ical information. In particular, FDG PET, a glucose analogue, is currently used in many cancer centres around the world to improve BTV definition, which is traditionally identified on CT simulation images in radiotherapy clinical routine. Accurate volume definition is particularly impor-tant in radiotherapy because it constitutes the target of the radiation beam; under-dosing of tumour may lead to recurrence while over-dosing of surrounding normal tissues might lead to severe and possibly lethal side effects to the patient such as brain or lung injury [71]. There are several ways to categorize PET segmentation approaches such as the cancer site, the injected radiotracer or the image processing technique. It is noted that there could be
differences and overlaps between the sites, the tracers or the techniques. Nevertheless, in this survey, we find that it would be pedagogically convenient to categorize PET segmentation based on the techniques used and refer to differences in sites or tracer-specific variations as appropriate. There is a plethora of segmentation methods that could be applied to nuclear medicine imaging, particularly in cardiovascular imaging; the interested reader is referred to [24]. According to our literature survey of existing methods, we identified four broad categories of PET segmentation methodologies: (1) image thresholding methods, (2) variational approaches, (3) learning methods and (4) stochastic modelling-based techniques. The main charac-teristics and limitations of these categories are summarized in Table1.
Thresholding methods
This is by far the most widely used PET segmentation approach in clinical practice for BTV delineation for radiotherapy planning. The only competing approach with thresholding is possibly visual interpretation of PET scans and identification of lesion boundary by consensus reading of an experienced nuclear medicine physician and radiation oncologist [33]. However, visual inspection is susceptible to the window level settings and suffers from inter-observer variability (Fig.1). Therefore, several segmentation meth-ods based on thresholding have emerged to reduce this subjectivity. In the thresholding approach, a threshold value (T) is selected to make a hard decision of separating the lesion foreground from the noise background within the
whole image or a selected region of interest (ROI) within the imageI(x), thus:
Lesion¼T I½ ð Þx ¼ 1;0;Ið Þ x T
Ið Þx <T
ð1Þ whereIis the intensity image andxis the spatial coordinate (x, y, z). Various methods have been proposed in the literature to determine the “optimal” threshold value [72– 75]. However, almost uniformly across all PET thresh-olding applications, the PET image voxels are converted into standardized uptake values (SUVs) prior to threshold selection. SUV is a decay-corrected measurement of activity per unit mass of tissue adjusted for administered activity per unit of body weight [76]:
SUV ¼ Mean ROI concentration MBqð =gÞ Injected dose MBqð Þ=Body weightðgÞ
1
decay factor
ð2Þ Several technical and patient-related factors can affect the reliability of SUV [77]. These include but are not limited to (1) time interval between injection and PET scanning, (2) degree of infiltration of administered tracer at the site of injection, (3) the often neglected residual activity in the syringe, (4) correction for radioactive decay of the injected tracer and (5) partial volume effects due to limited spatial resolution of the PET scanner [78, 79]. The interested reader is referred to Table 1 in both above-referenced reviews.
Table 1 Summary of main pros/cons of the various categories of PET image segmentation techniques
Category Characteristics Limitations
Manual techniques
Visual interpretation and manual delineation of contours. Very simple to use. Tools to transfer RT objects to treatment planning systems available from most vendors
Time consuming. Susceptibility to window level settings. Suffer from intra- and inter-observer variability. Consensus reading by nuclear medicine physician and radiation oncologist hardly practical in busy clinical departments Thresholding
techniques
Most frequently used due to their simple implementation and high efficiency
Hard decision making. Too sensitive to PVE, tumour heterogeneity and motion artefacts. Some methods focus on volume, others focus on intensity differences. Combination of both seems to provide best results [95]
Variational approaches
Subpixel accuracy, boundary continuity and relatively efficient. They are mathematically well developed and allow for incorporation of priors such as shape
Sensitive to image noise. As a PDE, stability and convergence could be subject to numerical fluctuations, especially if the parameters are not properly selected
Learning methods
Utilize pattern recognition power. Two main types: supervised (classification) and unsupervised (clustering)
Computational complexity especially in supervised methods, which require time-consuming training. Feature selection besides commonly used intensity is a flexibility but can also be a challenge
Stochastic models
Exploit statistical differences between tumour uptake and surrounding tissues. Most natural to deal with the noisy nature of PET
Effect of initialization and convergence to local optimal solutions are concerns, especially when compromises are made to improve efficiency
Among the earliest thresholding methods used is thresh-olding by percentage of 40–50% of the maximum SUV based on phantom studies of stationary spheres with FDG [80]. Subsequently, a value of 40% was adopted by several groups for BTV delineation of non-small cell lung cancer (NSCLC) [48], cervical cancer [81] and head and neck cancer (HNC) [40], for instance. However, later studies have shown that the optimal fraction selection for accurate quantification is dependent on the tumour volume [82,83]. Furthermore, Biehl et al. have shown a logarithmic relationship between the tumour volume and the optimal selected threshold using manually delineated CT simulation data as gold standard in a cohort of NSCLC patients (Fig.2):
%Threshold¼59:118:5log 10 tumour volumeð Þ ð3Þ This inverse relationship between threshold and volume confirms the observations seen in phantom studies [84,85]. An alternative method based on the absolute 2.5 SUV isocontour was proposed by Paulino et al. [86]. Proponents of this threshold argue that this is a value that distinguishes between benign and malignant tumours. However, tumour inhomogeneity and motion artefacts may hinder the application of this approach. The choice of an empirical SUV threshold-based cut-off to differentiate malignant lesions is controversial and an isocontour of a 2.5 SUV has been shown to fail to provide successful delineation in a large number of cases (45% for FDG PET [87] and 78% for FET PET [88]), particularly when using tracers presenting with low uptake in the target. Among the problems
associated with the use of fixed thresholding techniques is that they do not take the background into consideration. In addition, the threshold required for accurate edge location is a function of the source size. Inhomogeneity of tumours is a further confounding factor for the optimal percentage thresholding [89]. In order to avoid the controversies associated with fixed thresholds, some authors suggested adapting the threshold value to the signal to background ratio (SBR) [90, 91]. This technique requires calibration data that are applicable for quantification of tumour volumes in clinical oncology. This is usually carried out using a body phantom consisting of an elliptical water-filled cavity Fig. 1 Illustration of the
operator dependence of manual delineation of the contours on the window level settings (SUV thresholding) used for display of PET images. The images show a representative slice of a NSCLC patient.aAnatomical CT image. bFused PET/CT image and example PET images displayed using two different percentages of the maximum threshold (SUVmax) (c,d). Note the
differences in the maximum diameters estimated on the horizontal axis of the transaxial images: 5.36 cm on the CT (a) vs 3.47 and 5.48 cm on the two PET images displayed using different window level settings (c,d)
Fig. 2 Optimal percentage maximum SUV threshold selection in NSCLC. Reprinted with permission from [82]
with spherical inserts suspended by plastic rods of various inner diameters filled with activity concentrations in the range of SBR observed in clinical conditions to derive the parameters required for implementation of the adaptive thresholding algorithm based on SBR estimates. The mea-sured SBR and the resultant threshold are then fitted using an inverse functionðThreshold¼aþb1=SBRÞto yield the best regression parameters for the equation which allows estimation of the optimal threshold independent of any a priori knowledge of the lesion characteristics and tumour location.
Black et al. proposed using the following function to define the optimal threshold [90]:
Threshold¼ð0:307meantargetSUVþ0:588Þ ð4Þ According to this function, the threshold value is dependent on the mean target SUV and is not related to the background concentration or the target volume. This is in contrast to the multivariate analysis results by Brambilla et al. [92] and the discussion above. A different function that depends on each slice-specific image contrast defined as the difference between maximum voxel intensity within the target (ITmax) and effective mean voxel intensity of the background region (IBmean) was also reported by Drever et al. [93]:
Threshold¼ðContrast levelðITmaxIBmeanÞ þIBmeanÞ
ð5Þ Nestle et al. [94] used the following formulation:
Threshold¼bImeanþIbkg ð6Þ
whereβ=0.15,Imeanis computed as the mean intensity of all pixels surrounded by the 70% Imaxisocontour within the
tumour and Ibkg is the mean intensity in a neighbouring organ sufficiently far from the target and having the highest tracer uptake. The above formulation was slightly revised more recently and optimized using specially designed phantoms containing spheres of different diameters [95]:
Threshold¼ aSUVmeanð70%ÞþbBKG
=SUVmax ð7Þ wherea andb are sphere size and PET scanner-dependent parameters reported in this paper as a=b=0.50 for large spheres (diameter≥3 cm) and witha=0.67 andb=0.60 for small spheres (diameter <3 cm) for the ECAT ART system (Siemens Medical Solutions, Knoxville, TN, USA). An iterative thresholding scheme to the SBR approach was
introduced by Jentzen et al. [96], in which the authors suggested the following initialization:
%Threshold¼7:8%=V mlð Þ þ61:7%B=Sþ31:6% ð8Þ An alternative iterative technique based on a mathematical fit derived from Monte Carlo simulation studies to estimate the thresholds uses the following formulation [97]:
%Threshold¼a0þexp½aþðb=VÞþclogV ð9Þ where the parameters resulting from the least-squares fit describing the correlation between the lesion volume (V) and the corresponding optimum threshold are a0=5, a=3.568,
b=0.197 andc=−0.1069.
Despite their limitations, thresholding approaches have an intuitive basis that the other methods lack. Specific review of thresholding applications for target definition in HNC could be found in [87,98] and for NSCLC in [94]. Variational approaches
These methods attempt to exploit information provided by intensity variation (gradient differences between the fore-ground lesion and the backfore-ground) for the segmentation task. Several methods fall under this category [99–101]. This includes simple edge or ridge detectors such as the Sobel operator and the Watershed transform (WT) evaluated in [102]. However, their results did not show improvements compared with thresholding methods. This is in contrast with the results obtained by Geets et al. [103], in which the WT was applied in conjunction with cluster analysis on pre-processed images using a bilateral denoising filter and a Landweber’s deblurring filter with a Gaussian kernel. This pre-processing reduced the known sensitivity of the WT to noise amplitude in PET images.
More recently, there has been more focus on applying deformable active contour models to PET segmentation [104–106]. These models are geometric representations for curves (in 2D) or surfaces (in 3D) and are defined explicitly or implicitly in the imaging domain. The active models move (deform) under the influence of so-called internal force-like equations, which represent the curve or the surface bending characteristics, or so-called external forces, which are computed from the image data, typically as directional gradients [107,108]. The idea is that contours are characterized by sharp variations in the image intensity. Hence, the objective is to match deformed and reference contours by means of energy minimization (or dynamic force equilibrium). Mathematically, if the deformable contour/surface is represented by CðsÞ ¼fxðsÞ;yðsÞ;
zðsÞg; s2½0;1, then its movement is governed by the following function: J Cð ðtÞÞ ¼ Z1 0 aðsÞ@C s;ð Þt @s 2þbðsÞ@ 2C s;ð Þt @s2 2dsþg Z1 0 P C s;ð ð ÞtÞds ð10Þ where the first term corresponds to internal energy and controls the tension and rigidity of the contour.1The second term corresponds to the external energy, wherePrepresents the potential energy given asg(|∇I|), andgis selected to be a monotonically decreasing function of the image intensity (I) gradient. Using calculus of variation techniques, the solution to Eq. 10 is obtained by solving the associated Euler-Lagrange partial differential equation (PDE). This type of parametric active contours is known in the literature as “snakes” [109–111]. In order to improve the capture range of the snake-based algorithms, Xu and Prince proposed the gradient vector flow (GVF) snake [112]. This is achieved by replacing the external forces component (rP) by GVF, which is computed as a diffusion of the gradient vectors in the image. Hsu et al. applied this concept to segment liver PET images. However, in their approach they estimated the external forces by solving a Poisson PDE instead and the algorithm was initialized by a Canny edge detection method [105]. To further overcome the limitations encountered in the snake-based parametric deformable models such as initialization requirement and topological adaptation (splitting or merging of model parts as encountered in necrotic tumours), a family of geometric deformable models known as the level set methods were developed [113]. These techniques are based on using the geometric concept of evolving level sets by solving iteratively the following evolutionary PDE:
@f
@t ¼VðkÞ rj fj ð11Þ
wherefis an implicit function (e.g. a signed distance) that represents the evolving level set, where at the contour f(C) = 0. V is a velocity function proportional to the curvature and inversely proportional to the image gradient. The algorithm starts by some initial contour, then the curve evolves under the influence of the internal (contour curvature) and external forces (image gradient) until it reaches the boundary of the object where balance between the internal and the external forces is achieved as governed by the solution of Eq.11. Efficient solutions are developed
by using the marching method [107]. This method was applied to segmentation of PET images in NSCLC [104] and HNC [106]. El Naqa et al. [104] applied an iterative deblurring algorithm while Li et al. [106] used RG as pre-processing steps to improve the active contour robustness. Sample results illustrating application of the level set approach are shown in Fig.3.
Learning methods
These are techniques developed in pattern recognition to estimate dependencies from data [114]. In the case of lesion segmentation in PET, the learning task becomes to discriminate uptakes in the lesion voxels from surrounding normal tissue voxels based on a set of extracted features from these images. There are two common types of statistical learning: supervised and unsupervised [114, 115]. Supervised learning is used to estimate an unknown (input, output) mapping from known labelled samples called the training set (e.g. classification of lesions given a certain number of example images). In unsupervised learning, only input samples are given to the learning system (e.g. clustering or dimensionality reduction).
Commonly used classifiers include k-nearest neighbour (KNN), artificial neural network (ANN) and support vector machine (SVM). These methods have seen limited appli-cation in PET; however, they are widely applied in segmentation of anatomical MR images [116–118] and X-ray images [119]. This is partly due to the high heterogeneity of PET images that complicates the identifi-cation of proper stable patterns for training purposes from a finite number of observations [89]. On the other hand, clustering methods have shown more promise for PET segmentation of tumours [89,120–123] in addition to many other applications in nuclear medicine [124,125]. There are several clustering methods in the literature [126, 127]. Among the frequently used ones are the k-means algorithm, the fuzzy C-means (FCM) algorithm and the expectation maximization (EM) algorithm. The k-means is the most widely used due to its simplicity. The algorithm is first initialized to K-initial cluster centres, which are selected either manually or randomly. Then, the cluster member-ships are updated iteratively by applying a hard decision distance metric (e.g. Euclidean distance). This is achieved by minimizing the following objective function:
Jðx;cÞ ¼X N i¼1 XK k¼1 xick k k 2 ð12Þ whereNis the number of voxels,Kis the number of tissue classes,xiis a feature vector at the ith location andcis the kth class cluster centre. However, such a technique is quite
1
The first-order derivative suppresses stretching and makes the contour behave like an elastic string. The second-order derivative suppresses bending and makes the model behave like a rigid rod.
sensitive to initial cluster selection and is not robust to noise and spatial inhomogeneities. Several modifications have been proposed in the literature to alleviate these problems. One approach is to replace the hard decision approach in the k-means by a soft decision approach by applying the fuzzy set theory [128]. The algorithm proceeds in a similar fashion to k-means, but a voxel would belong to more than one class, and cluster association is built in the algorithm by using fuzzy membership functions [129,130]. The membership function represents the amount of sto-chastic overlap“fuzziness”between the tumour region and surrounding regions. In the FCM case, the fuzzy member function at any iterationnis given by:
uðiknÞ¼ xicðknÞ 2 PK k¼1xicðknÞ 2 ð13Þ
and the update for cluster centres is:
cðknþ1Þ¼ PN i¼1 u ðnÞ ik b xi PN i¼1 u ðnÞ ik b ð14Þ
wherexiagain is the feature vector at the ith location,cðknÞis the kth centroid at the nth iteration andbis an exponent >1. A variation of this method was applied in [124], in which the algorithm starts with an oversized number of clusters to avoid misidentification of conflicting regions. Then, this is
followed by a merging process to reach the desired or natural number of clusters according to a priori anatomical knowledge. Similar clustering techniques were also used for unsupervised lesion segmentation operating on dynamic PET images based on time-activity curve (TAC) shape differences between malignant and healthy tissues [131]. For lesion segmentation, the TAC slope values were k-means clustered into two clusters.
To overcome the above-described limitations of the FCM algorithm, a new fuzzy segmentation technique based on the standard FCM algorithm and adapted to typical oncological PET data was proposed by Belhassen and Zaidi [123]. PET images are first smoothed using a nonlinear anisotropic diffusion filter [132] and are then added as a second input to the proposed FCM algorithm to conduct the objective function optimization with knowledge about spatial con-straint, thus incorporating spatial information (FCM-S). In addition, a methodology was developed to integrate the à trous wavelet transform [133] into the standard FCM algorithm (FCM-SW) to allow handling of heterogeneous lesions’ uptake. This is achieved by adding a regularization term to the FCM objective function using the transformation result of the PET image by the à trous wavelet transform with the aim to incorporate information about lesion heterogeneity. Stochastic modelling
Methods belonging to this category aim to exploit the statistical differences in intensity distribution between Fig. 3 aFused PET/CT with a
necrotic lesion area magnified before and after deblurring.b Auto-segmentation using level set method.Leftinitial contour,
middleevolved contour after 40 iterations andrightthe estimated contour (red). The algorithm converged in 100 iterations
tumour PET uptake and its tissue surroundings. Aristopha-nous et al. proposed a Gaussian mixture model (GMM) for segmenting NSCLC PET images. In this approach, it was assumed that the image intensities are independent and identically distributed with a Gaussian probability density function that could be divided into three regions: back-ground, the uncertain and the target regions [134]. Hence, the likelihood function is written as:
Lðp;m;sÞ ¼Y N i¼1 f xið =p;m;sÞ ¼Y N i¼1 XK k¼1 pk ffiffiffiffiffiffiffiffiffiffi 2ps2 k q e ximk ð Þ2 2s2 k ð15Þ where N is the number of voxels, K is the number of classes, p are the mixing parameters and μ, σ are the Gaussian parameters. The maximum likelihood estimates of the unknown parameters are obtained using the EM algorithm and the probability of voxelxibelonging to class
kis given by: pik ¼ pkfkðxi=mk;skÞ PK m¼1 pmfmðxi=mm;smÞ ð16Þ
It should be noted that EM is a general approach for maximum likelihood estimation. The most widely used approach for image segmentation uses a two-step EM algorithm where the E-step is dedicated to the computation of the probabilities and the M-step estimates the cluster parameters assuming that the intensity distribution of each class may not be Gaussian and assigns belonging probabil-ities according to non-Gaussian distributions, e.g. [135, 136].
On the other hand, the spatial independence assumption could be relaxed by using hidden Markov models [133, 137]: pik ¼ expðH g xð ð Þi ;kÞ PK m¼1 expðH g xð ð Þi ;mÞ ð17Þ
where H is a Gibbs potential function and g is a neighbourhood partition (clique). Hatt et al. utilized a fuzzy membership of the voxels [138] into the Markov chain model in their implementation [137] referred to as FHMC, whereas Montgomery et al. used a multiscale decomposi-tion based on the wavelet transform to improve perfor-mance [133]. More recently, Hatt et al. modified their FHMC algorithm into fuzzy locally adaptive Bayesian (FLAB) to improve segmentation of small objects [89]. This Bayesian approach uses adaptive estimation of priors using a family of distributions from the Pearson’s system.
Contrasting of techniques
There is a large variability in terms of computational complexity and amount of user interaction required by the various image segmentation techniques. Despite their limitations, visual delineation performed by experts is still the most widely used technique [58]. However, manual techniques are labour intensive and suffer from intra-observer variability whereas thresholding techniques are simple to put into practice although scanner-specific calibration might be required for implementation of the adaptive thresholding method. The high computational burden associated with supervised methods which require time-consuming training is also worth emphasizing. In a clinical setting, the balance between algorithmic complexity and the validity of results obtained is an important criterion when selecting a PET image segmentation technique. Even though the techniques which make a large number of assumptions can frequently be undemanding, it is not necessarily true that complex algorithms will always perform better. The extra complexity must be used judiciously and justified for the particular application at hand. In many cases, extra complexity can just as easily result in unreliability as in improved results.
Although thresholding methods are the most frequently used techniques, possibly this is driven by their simplicity to implement and their efficiency for clinical practice. However, application of the proper threshold technique could be a challenging task due to limited resolution of PET images, blurriness due to partial volume effect or motion artefacts and limited statistical noise fluctuations due to limited photon count. In addition, a threshold technique does not take into account variations in tumour heteroge-neity or possible overlap in intensity between the tumour and surrounding normal tissues resulting in under- or over-estimation of the tumour extent depending on the selected threshold value. The comparison study conducted by Nestle et al. indicated the presence of up to 41% variability between the visualization definition of BTV and four different thresholding methods that were attributed to maxi-mum SUV, tumour homogeneity and lesion size [94]. The results of this study and similar ones have motivated the investigation of other segmentation techniques for defining BTVs in PET images for radiotherapy treatment planning purposes. However, such methods need to be carefully applied, otherwise inferior performances could be obtained as revealed in [102], where the authors have noticed that the direct application of the Sobel edge detector or the WT have failed to correctly identify the correct size of experimental volumes compared to thresholding segmentation.
To overcome these difficulties, several authors have explored active deformable models, learning methods and stochastic approaches, which seemed to provide better
results when compared with threshold segmentation meth-ods. For instance, active deformable models allow the incorporation of smoothness and other prior information into the segmentation algorithm, which would make it more robust to boundary gaps in addition to enjoying inherent subpixel accuracy due to its continuum nature. However, variational methods, especially gradient-based methods, suffer from sensitivity to image noise [139]. Therefore, proper pre-processing techniques such as denoising or deblurring could be required. Another approach is to replace gradient-based methods by region-based approaches such as the Mumford-Shah model to improve robustness to noise [140]. Moreover, most deformable models may require the selection of proper parameters to achieve satisfactory results in clinical practice.
Learning methods based on classification require train-ing of the method on data with known labels (ground truth known). However, this could be a challenging task due to variability of PET tracer uptakes and biodistribution depending on the biomarker concentration in the blood (e.g. glucose concentration for FDG), tracer dose, interval between tracer injection and scanning and scanning time. In addition, the PET images need to be labelled properly to identify the ground truth for training purposes (e.g. the structures contoured by a panel of experienced radiologists). Therefore, application of these methods would require extraction of robust features to these effects in addition to a ground truth. The issue of ground truth is partially resolved using unsupervised methods such as clustering techniques; however, these methods may still need incorporation of prior knowledge to estimate the right number of clusters and their connectiveness. Issues related to spatial correlation are mitigated through incorporation of additional neighbourhood constraints.
Stochastic models allow the incorporation of voxel’s intensity uncertainty directly into the model; however, these models require the use of a proper noise model. In many cases, the Gaussian assumption is used because it simplifies the computational burden and speeds up convergence. Spatial constraints could be incorporated by using the Markov property; however, these models may require additional constraints to achieve the smoothness observed in the deformable models.
The introduction of integrated PET/CT scanners has provided new opportunities to develop new methods for defining BTV in radiotherapy treatment planning by combining coregistered physiological information from PET images with anatomical information from CT images [1]. Bradley et al. have shown that a significant reduction in observer variability could be achieved by combining PET and CT for lung cancer target definition [42]. This was also shown in several HNC studies [29,141]. The feasibility of this approach has been also demonstrated for different
cancer sites [142]. Hence, it could be conjectured that the combination of PET with CT will provide an improvement over CT alone for targeting in future radiation therapy treatment planning. Consequently, a framework based on the generalized level set approach and a soft-AND model for concurrent segmentation of multimodality images (e.g. PET/CT) has recently been developed. Measurement of the overlap index (Dice similarity metric), discussed below, showed significant improvement in target definition by using combined imaging information [143].
Validation and comparison of PET image segmentation techniques
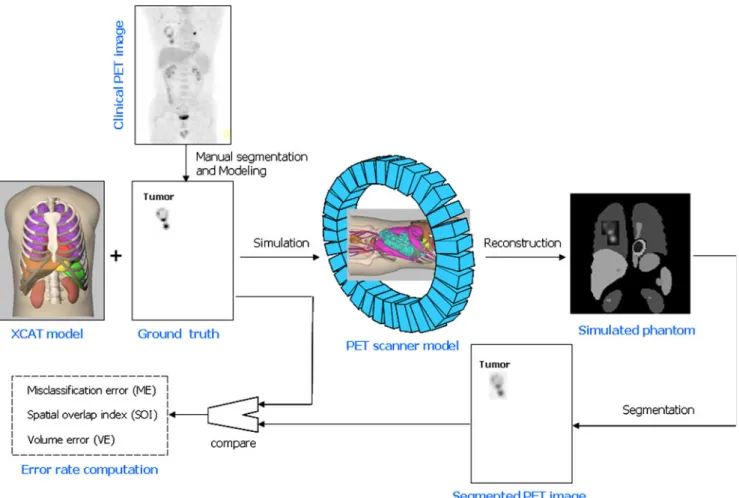
Validation of accuracy (fidelity to the truth) and precision (reproducibility) are very crucial steps for any clinical use of a computer algorithm [144]. However, a rather challeng-ing, even a problematic issue for validation of segmentation algorithms, is the identification of a gold standard (i.e. the benchmark) [25,144]. Segmentation methods yield binary classification results (a voxel belongs to the object or does not). There are basically four different strategies allowing the assessment of the accuracy of PET image segmentation techniques. Table 2 summarizes these strategies and provides a concise summary of their advantages, drawbacks and limitations. These include manual segmentation by experts in the field, the use of simulated or experimental phantom studies where the ground truth (tumour volume) is known a priori, the comparison with correlated anatomical GTVs defined on CT or MRI and the comparison of tumour volumes delineated on clinical PET data with actual tumour volumes measured on the macroscopic specimen derived from histology, in case a PET scan was undertaken before surgery. It should be emphasized that such correlative analysis relies on a high degree of registration accuracy between multimodality images which is still challenging to perform in a clinical setting [145].
Contouring by experts has often been labelled as the “truth”. However, such an approach suffers from intra- and inter-observer variability [58,146,147] besides being time-consuming and exhaustive to carry out. In the second approach, one would rely on constructing phantoms, either physically or digitally. Evaluation and validation of quantitative analysis procedures using simulated or exper-imental phantom studies is very popular in medical imaging physics research. Physical phantoms are typically con-structed for a specific standardization task (e.g. NEMA phantoms). Such physical phantoms have been widely used for testing and evaluating PET segmentation algorithms with static [80, 148] or dynamic constructions [149,150]. For testing PET image segmentation methods, a realistic anthropomorphic thorax phantom (Radiology Support
Devices Inc., Long Beach, CA, USA) that is depicted in Fig.4could be used. This phantom was thoroughly used by Montgomery et al. [133] for assessment and characteriza-tion of their novel segmentacharacteriza-tion algorithm. This phantom consists of lungs, cardiac insert and a liver compartment that can be filled independently. In addition, there is a plastic vial placed in the pelvis to simulate the bladder and thus take into account out of field of view activity. Techniques similar to those suggested by Turkington et al. [151] were used to fabricate a set of tumours of different size that can be used to produce wall-less small radioactive
lesions using moulted wax. This design has many advan-tages compared to using commercial plastic or glass spheres that have an inactive wall as they do not reflect the real situation in the patient and lead to quantification errors in the presence of background activity [152]. The lesions can be mixed with 18F activity and embedded in the various compartments/organs provided (e.g. left and right lungs to mimic lung cancer studies) within the physical anthropomor-phic thorax phantom. This arrangement provides properties similar to the human thorax suitable for mimicking whole-body oncological FDG PET studies.
Table 2 Outlined strategies for validation and comparison of PET image segmentation techniques and their main advantages/disadvantages
Category Key advantages Limitations/drawbacks Representative
references Manual contouring
by experts
Current gold standard Time-consuming, subjective, large intra-and inter-observer variability
[53–58,212,216] Simulation studies Controlled study with known conditions
and segmentation ground truth, flexibility in adjusting experimental parameters
Simulation conditions may not be
representative of complex real-life PET/CT imaging conditions and varying patient anatomy and physiology
[83,89,123]
Experimental phantom studies
Better representation of scanner imaging and physical conditions (e.g. PVE) than could be simulated numerically with known ground truth
Human anatomy is too complex and cannot be represented by simple materials or geometrical shapes, difficulty in designing dynamic phantoms that mimic respiratory motion [51,80,83,85,90, 91,95–97,133, 148,217–221] Clinical studies (without macroscopic specimen)
Real-life clinical images of patient disease are used
Ground truth unknown [38,48,82,87,88,
98,142,182,183,
207,222–229] Clinical studies
(with macroscopic specimen)
Real-life clinical images of scanner capability and patient disease are produced with an independent ground truth
Need to carefully account for specimen shrinkage artefacts in vitro in order to match the in vivo conditions
[50,57,103,123,
170–178,186]
Fig. 4 Photograph of the anthropomorphic thorax phantom (a), rendered CT image of the phantom (b) and wall-less small radioactive lesions of different shape and size fabricated using moulted wax beeswax tumours (c) that can be inserted into the lungs of the phantom to simulate typical lesions in lung cancer patients
Simple and more sophisticated computational anthropo-morphic anatomical and physiological models are also widely used in the literature [153,154]. Among the most popular models for functional imaging is the 4D nonuni-form rational B-splines (NURBS)-based cardiac-torso (NCAT)—now known as the 4D extended cardiac-torso (XCAT)—phantom [155]. This computational model was developed to realistically model human anatomy based on the“Visible Human”data. Dynamic cardiac and respiratory models are incorporated into the phantom to mimic real heart and breathing motion. The organ shapes are formed using NURBS [156] and now include more realistic modelling of normal and abnormal variations in anatomy and in the respiratory motion [157]. Typical strategies used in simulation-based generation of realistic oncological PET data to assess the performance of image segmentation techniques showing a simulated tumour in the right lung at end of exhalation with a hypothetical average SUV=6.5, a typical average SUV in NSCLC, are shown in Fig. 5. Accurate simulation techniques combining Monte Carlo modelling techniques and clinical data are now becoming
available and being exploited for comprehensive assess-ment of segassess-mentation algorithms [158–160]. Modelling combined PET/CT systems using dedicated PET [161–163] and X-ray CT [164–166] simulators as performed by Ay and Zaidi [167] might offer some additional advantages, partic-ularly when respiratory motion is addressed. Recent develop-ments describing more realistic dynamic 4D anatomical models incorporating accurate modelling of respiratory and cardiac motions might help to achieve this goal [153,154].
Notwithstanding the advantages offered by phantom studies, some solutions to the problem of PET segmentation are less suitable for routine clinical applications than they are in phantom simulations. The accuracy reached in phantom studies is unlikely to be reached in clinical investigations. The true clinical feasibility of the methods described in the previous section has yet to be fully investigated. The results reported in the literature about the accuracy of PET segmentation very much depend on the type of phantoms, lesion size, noise, type of scanner, etc.
The application of PET image segmentation in the clinical setting requires a rigorous assessment in order to
Fig. 5 Principle of simulation-based validation of PET image segmentation techniques showing the 4D NCAT anatomical model representing typical tracer distribution in the body to which a lesion of known characteristics was added. The 3D rendered simulated FDG
PET image with a lesion in the right lung at end of exhalation with an SUV=6.5 is also shown. For lung cancer studies, motion could be simulated using a respiratory cycle of 5 s and diaphragm extent of 2 cm
define the most appropriate algorithm for a specific combination of a probe and targeted application and give an estimate of expected accuracy. There is no single figure of merit that summarizes algorithm performance, since performance ultimately depends on the diagnostic task being performed. Well-established figures of merit known to have a large influence on many types of task perfor-mance are generally used to assess the perforperfor-mance of image segmentation procedures [168,169].
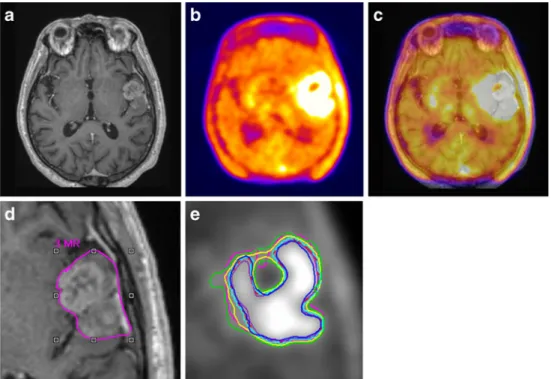
It has been argued that when using clinical data where the ground truth is not known a priori, it is generally unacceptable to use an imaging modality as gold standard against which results from another imaging modality are compared. However, comparisons of GTVs delineated on structural imaging (CT or MRI) with BTVs obtained using various strategies for functional PET-based image segmenta-tion techniques might provide some useful hints. One such example is shown in Fig.6which illustrates a patient study presented with a glioblastoma exemplifying differences in target volume definition obtained by using various segmen-tation methods as compared to GTV defined manually on MRI [88]. PET image segmentation techniques included manual delineation of contours, a 2.5 SUV cut-off, a fixed threshold of 40 and 50% of the maximum signal intensity, SBR-based adaptive thresholding (BTVSBR), gradient find
(BTVGF) and RG (BTVRG). For this particular patient, all
PET-based techniques define almost similar contours on this plane, but overall the estimated lesion volume is different.
Yet another attractive approach would be to use registered histological specimens [170]. Only very few studies reported on the use of macroscopic surgical specimens for validation
of PET-based BTV delineation techniques [50,57,103,171– 177]. The only studies where the 3D volumetric macroscopic specimen (in contrast to lesion volume or size defined on the one to three major axes) was available clearly demonstrated the superiority of PET compared to other structural modal-ities for pharyngolaryngeal squamous cell carcinoma [171]. More studies are still required before claiming superiority of PET for other tumour types and localizations. However, one needs to be cautious about ex vivo tumour shrinkage in such cases where timing between imaging and surgery play a significant role. In the study by Daisne et al., a special procedure was developed to allow a three-dimensional coregistration of the macroscopic specimen with the imaging modalities [171]. Fresh surgical specimens were placed in a polystyrene cast containing three longitudinally placed wood rods that were equally spaced in the transverse plane of the specimen and the cast was filled with a 16% gelatin solution and kept at−20°C for 48 h and thereafter at −80°C for at least 72 h. The authors suggest that such fixation and freezing procedures resulted in no retraction compared to other methods as evident by their animal data. Radiology-pathology correlation is even more challenging in the lung. A limited number of NSCLC patients (5) were investigated in a feasibility study that highlighted that ignoring deformations of the lung might result in under-estimation of the microscopic spread [50]. Dahele et al. developed an original framework allowing the 3D recon-struction of resected NSCLC specimens [178]. The proce-dure incorporates a number of distinctive features, including agar embedding of the specimen and whole-mount digital histopathology.
Fig. 6 Gadolinium-enhanced T1-weighted MRI (a),
corresponding18F-FET PET (b) and fused PET/MR (c) transaxial slices of a clinical study with a glioblastoma showing differences in target volume definition. Indicated aredthe GTV delin-eated on MRI (GTVMRI) ande
enhanced details of PET-based BTVs obtained by manual delineation of contours (BTVman;
magenta), an isocontour of a SUV of 2.5 (BTV2.5;purple), a
fixed threshold of 40% (BTV40%;
green) and 50% (BTV50%;cyan)
of the maximum signal intensity, SBR-based adaptive thresholding (BTVSBR;yellow), gradient find
(BTVGF;blue) and RG (BTVRG;
red) segmentation algorithms. Note that GTVMRIoverestimates
the tumour extension relative to BTVman. Reprinted with
The inherent difficulty of the procedure related to shrinkage of the specimen outside after surgical excision restricted the use of this methodology in clinical research. As a result, only few studies were published so far covering pharyngolaryngeal squamous cell carcinoma [171], NSCLC [50] and oropharyngeal and oral cavity cancer [175]. Such deformations need to be accounted for properly before use in comparison studies [178]. Moreover, some preclinical studies reported discrepancies between PET images and the underlying microscopic reality derived from autoradiography owing to the finite resolution of PET scanners [179].
A limited number of studies reported the comparative evaluation of PET image segmentation techniques using clinical data [57,86–88,94,102,148,171,174,176,177, 180–184]. The main difference between the segmentation methods is the underlying empirical derivation or mathe-matical model used to differentiate between the tumour and background. Comparison studies underlined the importance of the PET segmentation technique without definitively suggesting a particular procedure for clinical use [87,88]; however, it has clearly been shown that PET segmentation using the adaptive thresholding technique outperformed structural imaging procedures (CT and MRI) for GTV delineation where macroscopic surgical specimen derived from histology served as gold standard for assessment [171]. Thus, it can be argued that at present PET image segmentation is still an open research area that requires further research and development efforts where users are applying the most reliable technique available to them, although ultimately it may become clear which method is best for a particular application.
To provide better insight into the performance of the different categories of PET image segmentation techniques described in the preceding sections, we show qualitative and quantitative results using clinical data. It should be noted that none of the methods proposed so far is well enough developed or understood to allow it to be used clinically without a careful knowledgeable check. A recent study compared nine segmentation techniques [148]. Representative segmentation results of an FDG PET/CT image of a patient presenting with histologically proven NSCLC are shown in Fig.7. The GTV/BTVs defined on the irregularly shaped non-homogeneous lesion using nine segmentation techniques are depicted on both the CT and FDG PET transaxial slices. These include manual delineation performed by an experienced radiation oncologist on both the CT (CTman) and PET (PETman) images, four semi-automated
methods comprising the SBR-based adaptive thresholding technique [91], RG [28], Black et al. technique [90], Nestle et al. technique [94] and three fully automated methods: standard FCM [120], the FCM-S which incorporates nonlinear anisotropic diffusion filtering thus allowing the integration of spatial contextual information and the
FCM-SW algorithm which also considers inhomogeneity of tracer uptake through the use of the à trou wavelet transform [123]. Table 3 summarizes the results obtained using the various PET image segmentation techniques for the clinical study shown in Fig. 7 (maximum diameter determined by histology is 7 cm). The overlap fraction used to assess geographic mismatch between the BTVs delineated using the different techniques with respect to the BTVSBR is also
shown. The overlap volume of BTVX(X refers to one of the
above-referenced segmentation techniques) and BTVSBR is
expressed as the overlap volume of BTVX and BTVSBR
relative to BTVSBR.
For extraction of quantitative metrics of segmentation accuracy, besides the comparison of spatially independent volume changes that is commonly practiced, several spatially dependent statistical metrics could be used. The following metrics recommended for general segmentation analysis [185] could be further adopted to better assess the accuracy of the different PET segmentation methods with respect to a predefined benchmark.
The two most common techniques currently used to assess the performance of image segmentation techniques are linear regression and Bland-Altman analysis. The first consists in performing paired correlation between two segmentation algorithms by computing the slope, intercept and the correlation coefficient for the regression plot using lesion volume [103, 175] or maximum lesion diameter along one of the three axes as a figure of merit [57,148, 186]. A large correlation coefficient (which actually reflects the spread of the data points around the regression line) is always associated with strong agreement. On the other hand, Bland-Altman analysis attempts to quantify the level of agreement between the estimates resulting from the use of two algorithms using a statistical method consisting in depicting the difference between the estimates against the average of the estimates [187]. The two estimation methods are assumed to“agree”if the differences lie within the 95% confidence interval (limits of agreement) defined as mean ± 1.96×SD In such case, one technique could, in theory, replace another with confidence for estimation of the same parameter. Despite their popularity, such approaches have many shortcomings and caution should be observed for interpretation of the results.
Receiver-operating characteristics (ROC) curve This is a plot of the sensitivity (true classification fraction) versus specificity (false-positive fraction) for a continuum of threshold values. The overall accuracy is summarized by the area under the ROC curve (AUC). An extension of this metric called localization ROC (LROC) is used to resolve the spatial localization issue [188].
The ROC technique could be used as a metric to evaluate the performance of a “continuous classifier” and
is a popular visual method for assessing the overall classification accuracy. Numerous ROC techniques were developed including non-parametric, semi-parametric and parametric transformation models for estimating and com-paring ROC curves derived from continuous data as described in [185, 189]. A significant advance in ROC analysis in the absence of a gold standard (i.e. without knowing the ground truth) was reported by Henkelman et al. who demonstrated that ROC parameters could be assessed by using additional tests on the same patients [190]. The statistical basis of this approach was verified and its relevance further confirmed in subsequent studies [191]. More recently, a more sophisticated technique using the maximum likelihood approach allowing the assessment and comparison of various estimation methods without the use of a gold standard was suggested [192, 193]. The method estimates the relative accuracy and consistency of the assessed algorithms without a priori knowledge of the gold standard approach. Simulated studies seem to suggest that the technique is capable of estimating accurately the parameters of a regression line without a gold standard Fig. 7 Representative segmentation results of FDG PET/CT image of
a patient presenting with histologically proven NSCLC. The GTVs defined on the non-homogeneous lesion with irregular shape (maxi-mum diameter determined by histology is 7 cm) using nine segmentation techniques are depicted on both the CT (left) and FDG PET (right) transaxial slices. These include manual delineation performed by an experienced radiation oncologist on both the CT (CTman) and PET (PETman) images, four semi-automated methods
comprising the SBR-based adaptive thresholding technique [91], RG [28], Black et al. technique [90], Nestle et al. technique [94] and three fully automated methods: standard FCM [120], the FCM-S which incorporates nonlinear anisotropic diffusion filtering to incorporate information about the spatial context and the FCM-SW algorithm which also considers inhomogeneity of tracer uptake through the use of the à trou wavelet transform [123]
Table 3 Summary of comparative PET image segmentation results of the clinical study shown in Fig.7(maximum diameter determined by histology is 7 cm) showing the maximum diameter and volume of the lesion estimated by each segmentation technique. The overlap fraction used to assess geographic mismatch between the GTV/BTVs delineated using the different techniques with respect to the BTV delineated using the SBR technique is also shown. Note the large differences between the estimated volumes despite the small differ-ences between the maximum diameters measured by the various segmentation techniques Segmentation method Max. diameter (cm) Volume (cc) Overlap fraction w.r.t. SBR CTman 6.5 98 0.60 PETman 7.5 80 0.70 RG 6 61 0.95 Nestle et al. 7 138 0.47 Black et al. 6.5 117 0.55 SBR 6.5 65 -FCM 4.8 32 0.49 FCM-S 5.5 45 0.66 FCM-SW 6.5 76 0.87
(i.e. without the x-axis). The technique seems appropriate for evaluation of image segmentation techniques, particularly that the approach was successful in estimating the volume of a physical phantom using two imaging modalities (SPECT and CT) [194].
Spatial overlap indexTypically, the Dice similarity coeffi-cient (DSC) is used, which is defined in terms of pixel ratio of the overlapping regions, where at any given threshold DSC values would range from 0, indicating no spatial overlap between two sets of binary segmentation results, to 1 indicating complete overlap [169]:
DSC¼2 Að \BÞ AþB
ð Þ ð18Þ
The multiclass type I (TI) and type II (TII) errors were also suggested to quantify the error based on mis-segmented voxels [168,195]. The percentages of the two error types are given by:
TI¼100Number of voxels of class k not classified as k
Total number of voxels of class k
ð19Þ TII¼100Number of voxels of other classes than k classified as k
Total number of voxels of other classes than k ð20Þ
Mutual information This is a measure of uncertainty (entropy), which is routinely used with registration algo-rithms [196]; however, the metric is applicable to segmen-tation analysis as well [197]. Entropy measures, and particularly mutual information, have found widespread use in nuclear medicine applications. There are many variants of mutual information and joint entropy measures; however, they do not seem to be widely used for this purpose. In a recent assessment of voxel similarity measures, Holden et al. have demonstrated clear preference for those based on entropy measures including mutual information [198]. A normalized version of this metric is recommended, which is given by:
NMI¼HðAÞ þHðBÞ
H Að ;BÞ ð21Þ
whereH(·) is the Shannon entropy.
Challenges and future directions
An overview of current state-of-the art developments in PET image segmentation techniques is provided in this
review. Approximate methods suitable for clinical routine applications and more sophisticated approaches for research applications, where there is greater emphasis on accurate quantitative analysis, have been proposed. It is gratifying to see in overview the progress that PET image segmentation has made in the last decade following the successful introduction of PET/CT in the radiation therapy treatment planning process, from operator-dependent manual delin-eation of structures, through simple thresholding, the use of classifiers and fuzzy clustering, and more recently active contour models, dynamic PET data analysis and atlas-guided approaches incorporating prior information [24]. Recent developments have been enormous particularly in the last 5 years, the main opportunities striving towards improving the accuracy, precision and computational speed through efficient implementation in conjunction with decreasing the amount of operator interaction. The application of PET image segmentation is well established in research environments and is still limited in clinical settings to academic institutions with advanced physics and technical support. As the above-mentioned challenges are met, and experience is gained, implementation of validated techniques in commercial software packages will be useful to attract the interest of the clinical community and increase the popularity of these tools. It is expected that with the availability of computing power, more complex and ambitious computer intensive segmentation algorithms will become clinically feasible.
Despite the remarkable progress that image segmentation has made during the last few years, performance validation in a clinical setting remains the most challenging issue [144]. Notwithstanding the outstanding growth achieved as can be witnessed by the enormous number of publications in the field, many challenging issues still remain to be solved through research. There is no shortage of challenges and opportunities for PET image segmentation today. Tumour heterogeneity and stability of tracer uptake is one of the challenges facing automated delineation of BTVs [199]. Very few studies have addressed the issue of tumour heterogeneity which cannot be appropriately handled using simple thresholding techniques [89, 123]. It should be noted that most published studies reporting on the use of image segmentation in the context of PET-guided radiation therapy focused on FDG as tracer whereas very few investigations paid attention to other probes. Evolving areas for application of other promising radiotracers for this purpose [200–203] include but are not limited to markers of tumour proliferation (e.g. 18F-fluorothymidine, FLT), amino acid metabolism (11C-methionine, 11 C-tyrosine and18F-fluoroethyltyrosine, FET), cell membranes and fatty acid metabolism (11C-acetate or 11C-choline and
18
F-choline), somatostatin receptors (68Ga-DOTA-TOC) and hypoxia (18F-FMISO, 18F-FAZA, 64Cu-ATSM and
18
F-EF5) which have already shown their potential in patient management or dose painting in radiation therapy [204, 205]. In addition, novel tracers have been developed that specifically bind to certain intra- or extracellular compounds of various tumours, such as18F-DOPA (metab-olism of amine precursor uptake and decarboxylase, APUD) which is now widely adopted as a diagnostic tool for the imaging of neuroendocrine tumours [206]. Published reports so far involved the use of tracers such as11C-methionine [53, 180, 207], 18F-choline [208–210], 18F-FLT [211] and
18
F-FET [88, 212]. In addition, while the role of hypoxia markers was demonstrated in dose painting techniques [205], its relevance is not well established in target volume definition. Experiments performed on animal models have shown the limitations of PET-guided dose painting tech-niques which should be considered with caution given the finite spatial resolution of current clinical PET scanners [179]. It would be interesting to explore optimal strategies aiming at tailoring image segmentation techniques to match the specificity of each particular cancer imaging probe and tumour type [60]. Despite the worthwhile research carried out and the remarkable achievements, the field is still in its infancy and plenty of research opportunities still exist particularly in connection with the design of experimental clinical protocols and tracers or combinations of tracers to be used for each application, which remain open research questions.
PET image segmentation methods developed so far were rather general and as such were not optimized to address a specific problem or type of tumour and/or localization. The availability of integrated PET/CT imaging systems provides new opportunities as well as new challenges in radiotherapy treatment planning and delivery; they have also presented many technical challenges on how to integrate different modalities information properly affecting their visualization and delineation. One of the challenges faced by scanner manufacturers is to provide commercial platforms that can easily handle multimodality images from any DICOM-compatible imaging modality including hybrid PET/CT and incorporate this information with minimum effort into the radiation therapy treatment planning software. There is still a lack of commercial tools available in treatment planning systems allowing importation and realignment of functional PET images and display of SUV units for user-defined automatic thresholding. Some investigators have argued for a potential role of PET/MRI to replace PET/CT as a platform of choice [213]. Besides the soft tissue discrimination, blood flow measures and indirect bio-chemical content could be incorporated [214]. Currently MRI is still in its infancy for radiotherapy application. However, its role is more in relation to better soft tissue discrimination compared to CT. In addition, functional MRI (fMRI) and its ability to compete with PET in
radiation oncology as a delineation tool has not been well demonstrated yet.
PET will undoubtedly continue to play an important role in the management of patients with cancer [215]. In this regard, it should be emphasized that many different computational approaches and algorithmic design paths have been and continue to be pursued in both academic and corporate settings, which offer different compromises in terms of performance and versatility but in most cases improve the clinical workflow efficiency. It is still uncertain which algorithms will be the most successful to deserve incorporation into future software supplied by either medical imaging or radiation therapy treatment planning vendors, but it is certain that technical advances will continue and will enable more accurate quantification of molecular targets using PET. In the clinical setting, it has become standard practice to use simplified techniques compared to the often complex methods developed for research where there is greater emphasis on quantitative accuracy. As a general guideline, fixed thresholding techniques should not be used as adaptive thresholding techniques which take into account the background could be easily implemented in the clinic following careful implementation of the experimental calibration procedure required to derive imaging protocol- and scanner-specific parameters. For those departments with limited physics support, manual delineation techniques are to be preferred to fixed thresholding approaches. Fully automated PET image segmentation techniques remain the best option and will likely find their way to the clinic in the near future. Acknowledgements This work was supported by the Swiss National Science Foundation under grant SNSF 3152A0-102143 and the National Institutes of Health under grant 1K25CA128809-01A1.
References
1. Townsend DW. Multimodality imaging of structure and function. Phys Med Biol 2008;53:R1–39.
2. Hasegawa B, Zaidi H. Dual-modality imaging: more than the sum of its components. In: Zaidi H, editor. Quantitative analysis in nuclear medicine imaging. New York: Springer; 2006. p. 35–81.
3. Bernier J, Hall EJ, Giaccia A. Radiation oncology: a century of achievements. Nat Rev Cancer 2004;4:737–47.
4. Fenwick JD, Tomé WA, Soisson ET, Mehta MP, Rock Mackie T. Tomotherapy and other innovative IMRT delivery systems. Semin Radiat Oncol 2006;16:199–208.
5. Ling C, Zhang P, Archambault Y, Bocanek J, Tang G, Losasso T. Commissioning and quality assurance of RapidArc radiotherapy delivery system. Int J Radiat Oncol Biol Phys 2008;72:575–81. 6. Jäkel O, Karger CP, Debus J. The future of heavy ion
radiotherapy. Med Phys 2008;35:5653–63.
7. ICRU. Prescribing, recording and reporting photon beam therapy. ICRU Report 62. Washington: International Commission on Radiation Units and Measurements; 1999.

![Fig. 2 Optimal percentage maximum SUV threshold selection in NSCLC. Reprinted with permission from [82]](https://thumb-us.123doks.com/thumbv2/123dok_us/9546376.2830886/5.892.159.811.76.466/optimal-percentage-maximum-threshold-selection-nsclc-reprinted-permission.webp)