1 / 8
Social Computing for Mobile Big Data
Abstract: Mobile big data contains vast statistical features in various dimensions, including spatial, temporal, and the underlying social domain. Understanding and exploiting the features of mobile data from a social network perspective will be extremely beneficial to the wireless networks, e.g., operation and maintenance (O&M), planning, optimization, and marketing. In this paper, we categorize and analyze the big data collected from real wireless cellular networks. Then, we study the social characteristics of mobile big data and highlight several research directions for mobile big data in the social computing areas.
1.
Introduction
The exponential growth in data services has ushered in the big data era, where expansive mobile wireless systems are major data contributors. Since 2014, the number of connected mobile devices has been more than the world’s population. The surge of mobile traffic in recent years is mainly attributed to the rapid proliferation of mobile social applications running on multimedia mobile devices such as smartphones, mobile tablets, and other smart mobile devices that support mobile broadband applications, e.g., online music, video, and gaming. By 2020, more than three-fifths of all devices connected to the mobile networks will be “smart” devices. With a compound annual growth rate (CAGR) of 53% global mobile data traffic will increase nearly eightfold between 2015 and 2020 [1].
Mobile big data poses many new challenges to the conventional data analytics due to its large dimensionality, uneven qualities, and the complex features therein, e.g., Volume, Variety, Velocity, Value and Veracity [2]. Dealing with big data is a key challenge for many wireless networking applications such as O&M, planning and optimization, and marketing.
In this paper, with the help of real data collected in different aspects of cellular networks, a classification of mobile big data is given. We highlight several research directions for mobile big data in the perspective of social computing based on the data characteristics.
2.
Big Data in Mobile Cellular Networks
The concept of ‘Big Data’ means not only a large volume of data but also other features that differentiate it from the concepts of `huge amount data'. The big data definition given in [2] includes the 5V properties: Volume, Variety, Velocity, Value and Veracity. It’s a new generation of technologies and architectures designed to economically extract value from very large volume of a wide variety of data by enabling high velocity capture, discovery, and analysis. It contains massive volume of both
2 / 8
structured and unstructured data that is difficult to process using traditional database and software techniques.
In addition to the five ‘Vs’ properties, due to the complexity of mobile cellular networks, big data in mobile cellular networks also exhibits several other unique characteristics compared with traditional big data. It provides unprecedented opportunities for us to understand behaviors and requirements of mobile users, which in turn allow the delivery of intelligence for time decision making in various real-world applications. In this section, we will introduce the data categories in mobile cellular networks and their unique characteristics.
2.1 Data Categories in Mobile Cellular Networks
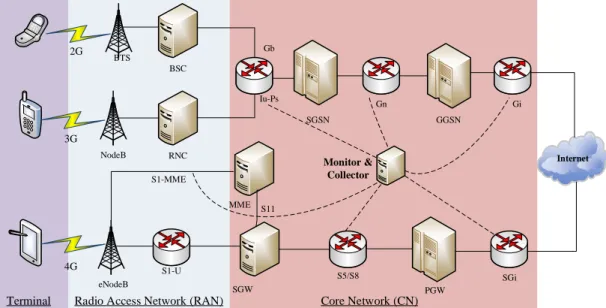
The vast amount of mobile data is collected and extracted from the several key network interfaces, in both Radio Access Network (RAN) and Core Network (CN), as shown in Figure 1. These mobile data can be roughly classified into four categories, including flow record data, network performance data, mobile terminal data, and additional data information, as shown in Table 1.
Internet BSC RNC SGSN GGSN SGW PGW MME BTS NodeB eNodeB 2G 4G 3G S1-U SGi S5/S8 S1-MME Gn Gi Iu-Ps S11 Monitor & Collector
Terminal Radio Access Network (RAN) Core Network (CN) Gb
Figure 1. Mobile Cellular Network Architecture and the data collecting point
Table 1 Data Categories in Mobile Cellular Networks
Data Categories specific item Description
Flow session data Data XDR Flow-type data recording subscribers’ data access attributes during a
connection session Signaling XDR Flow-type signaling information
Network performance data
Data for network KPI (Key Performance
Indicator)
Evaluating the performance and resource utilization of air interface
for both upload and download Measurement Report Air interface channel quality and
3 / 8
(MR) interference information
Device data
Smartphone Data Rich log file recording subscriber’s services and terminal information IoT ( M2M) Data Increasing rapidly with network scale
Additional data User Profile Billing information, subscribers data plan, etc
Geographic Information BS/Cell location, POI
a) Flow Record Data
A flow is a collection of packets between two end nodes defined by specific attributes, such as the well-known TCP/IP five-tuples. The flow record data in cellar networks are typically obtained through Deep Packet Inspection (DPI) and Deep Flow Inspection (DFI), which includes both data record and signaling record, in the form of XDR (call/transaction Detailed Record). The data records contain the main attributes during a data connection session, such as user id (e.g., IMSI, IMEI, MSISDN, etc), locations (e.g., Cell ID and its longitude and latitude), the timestamp of flow begin and end, the total number of packets and bytes, Uniform Resource Identifier (URI ) hostname and server IP, service types, etc. The flow record is perhaps the most important data describing the behavior of subscribers. For a medium-size city (1 million subscribers) in one week, the total flow record data is about 70TB (~1015 records).
b) Network Performance Data
Network performance data are aggregated data sets collected during a certain period (e.g., 5 minutes, 15 min or half an hour). Network performance data mainly include the Key Performance Indicator (KPI) data and measurement report (MR), which describes the performance of wireless networks, especially the air interface. KPIs are widely used in mobile cellular networks with the aim to evaluate the network performance and Quality of Service (QoS) delivered to users. KPIs pave the way for radio network quality, resource utilization and coverage of the wireless networks.
Measurement reports are data that mainly contains information about channel quality. Measurement reports assist the network in making handover and power control decisions. The dataset of network performance reaches several TB for a medium-size city in one week.
c) Device Data
With the development of Internet of Things (IoT) and 4G cellular networks, a rapidly increasing number of devices are connected to the networks, generating large amount of data at the terminals. Two typical categories are smartphone and Internet of Things (IoT). The data at terminals can be collected through a mobile APP [3], which are from different layers, such as application layer, network layer and radio link layer, including the service characteristics, device information, wireless network parameter such as IMSI, CellID/LAC, signal strength, RSRP, SINR, download/upload rate, etc.
d) Additional Data
There also exists some very important basic data information with respect to cellular networks, which can be summarized as subscriber profile and geographic information data. The subscriber profile includes the billing information, and data plan. The
4 / 8
geographic information data contains the location of the Cells/BSs, the point of interest (POI) information. The basic data information is relatively static compared with other data. However, these data contain information which is of vital importance for supporting the analysis of other data.
2.2
Statistical Characteristics of Mobile Big Data
The datasets from the real mobile network have distinctive characteristics, featuring a wide variety of recording scale, temporal granularity, as well as multiple data types. For example, according to the acquisition and recording in mobile networks, we can extract the location, motion, proximity and the information of application usage. However, different from the traditional big data in computer networks, the wireless mobile big data not only has similar natures like volume, variety and veracity, but also has its typical statistical characteristics.
Firstly, the data generated in wireless networks is associated with the underlying social relationship between users. For instance, the interests of users are easily influenced by others, and most of people always keep contact with a few group of friends and family. In this way, various of service technologies, such as broadcasting and proactive caching, and operation and marketing strategies, can be developed and optimized based on the analysis of mobile big data.
Secondly, the interest and habits of each individual tend to keep stable in a certain period of time. By extracting and analyzing the daily trace of individual of users, we can obtain the mobility behavior, time regularity, service requests and content selection with the mobile big data mining. In this way, several technologies can be widely applied, e.g., mobile relay, intelligent internet of Vehicle, device-to-device communication. The deployment and usage of sensors and power beacon based on the mobile big data will help to build a user-centric wireless network. In this paper, the three main statistical characteristics for mobile data are studied.
a) Spatial-Temporal Distribution
The data in mobile network can be partitioned into different granularities, e.g. 5min, 15min, 1hour or even one day. Similarly, in the spatial domain, mobile data can be studied from a whole city, a typical area, one base station (BS) or even one cell. Heterogeneity and fluctuation commonly exist in both spatial and temporal distributions. Mobile traffic in different locations such as stadium, campus and dense residential areas exhibits different patterns in different time slots. Full utilization of such characteristics have already been enforced in the deployment of mobile networks. b) Data Aggregation Property
Usually the characteristics of aggregation property for mobile data are more important for network performance optimization. In the analysis of a metropolitan area in China, the total bytes distribution is highly uneven -- it’s found that 20% subscribers will contribute more than 99% HTTP traffic [4]. From users’ perspective, we focus more on the group user behavior rather thanindividual behavior [5]. For a given geographical area and a certain time period, group subscribers will probably request the same traffics,
5 / 8
thus the data exhibits similar traffic pattern. The aggregation features will be further used in predictive modeling to improve network performance.
c) Social Correlations
In wireless cellular networks, due to the social nature and habits of human-being, users closed in vicinity will exhibit similar habits, behavior and mobility rules [6]. For example, the social correlations of users lead to a larger scale of traffic correlation in both temporal and spatial domain, such as the autocorrelation and cross-correlation properties of mobile traffic. Thus, social correlations are a universal phenomenon in mobile data. How to make full use of social correlations is of great importance to benefit the mobile network.
3.
Social Characteristics of Mobile Big Data
Instead of viewing mobile big data as a pure burden, in this section we investigate the potential performance gain of analyzing mobile big data from the perspective of social network analysis (SNA) [7]. SNA is an interdisciplinary academic field which emerged from sociology, statistics, and graph theory, which is been widely used to study relationship between individuals, groups, organizations, or even entire societies [8]. In this section, we explore the social characteristics of mobile big data with an emphasis on three aspects including the users, base stations and applications.
3.1
Users Social Network
Users social network (USN) describes the social relationship between usersand has received much attention recently in many fields. As for mobile data, several classic methods have been proposed to construct the user social network by using CDRs (Call Detailed Records), which contain calling/called information. In such case, social graph construction approaches are based on using phone numbers (users) for the nodes, and call connection for the graph edges. Recently, as mobile devices are becoming the primary way to access the Internet, including online social networks (OSNs), e.g. Facebook, Twitter, we see a convergence of social and mobile networks. OSN is an important way for users to get in touch with friends and family. People tend to highly value the content recommended by friends or people with similar interests. Thus, the network edges can be easily defined by several ways, such as the number of contents shared between two subscribers, their common interests and the habits of each individual during specific time (weekday, weekend), etc. The established USN can be used to detect community structures, understand true communication behavior, churn prediction and build a user-centric wireless network etc.
3.2
Base Stations Social Network
6 / 8
the location of a base station or a cell tower can provide rough spatial information for wireless traffic which is sufficient from large metropolitan area’s perspective. A base station is an aggregating point for a cell’s traffic. In this paper, we construct a base station social network (BSSN) with the collected traffic data (LTE FDD network in Hong Kong), as shown in Fig.2. Each node in BSSN is a BS, different from USN, the edges in BSSN represent relationship rather than real social ties. To construct a BSSN, firstly the relationship between BSs is quantified with the BSs’ traffic traces by using Pearson correlation coefficient. Pearson correlation coefficient estimates the strength of a linear relationship between two BSs, giving a value between +1 and -1 inclusive. Then, some methods such as Minimum Spanning Tree (MST), Planar Maximally Filtered Graph (PMFG) are proposed to filter the relationship to obtain a network. In our work, PMFG is applied to establish the BSSN.
Several interesting work can be done based on BSSN, such as link prediction, community detection, network evolution, and social influence analysis. We focus on the community structure of BSSN. Community refers to a sub-graph structure within which nodes have a higher density of edges, whereas vertices between sub-graphs have a lower density. As shown in Fig.2, there exists four groups of BSs within which the connections are dense, while sparse between groups. Analytical results show that each community in BSSN corresponds to a typical scenario with a common traffic pattern, which can be used to recognized the typical traffic scenarios to adapt dynamic resource allocation.
Figure 2. Base Station Social Network: BSs of the same color belong to the same community. Four communities including CBD, shopping district, residential area and
subway stations are shown.
3.3
Apps Social Network
With the popularity of smartphones and mobile applications, many uniquely mobile applications continue to emerge, such as location-based services, mobile games, and
7 / 8
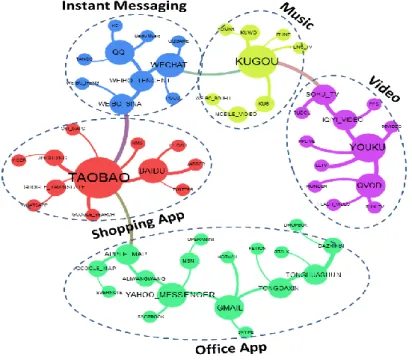
mobile commerce applications. The data traces collected from mobile networks provide a large amount of applications in people’s daily life. With the massive data we try to find the relations between application usages. Using the similar method as BSSN, an App social network (ASN) can also be established with the real spatial-temporal cellular network traffic data (3G network of Shenzhen), as shown in Fig. 3.
In the ASN, each node represents one typical App, and the edges indicate the strength of relationship between various Apps. The App with higher degree has a larger sizeand this App trends to be used with more other applications in a specific time. Apps of the same color belong to the same application community, such as video, Instant Messaging (IM, e.g., WeChat), office applications and others.
Figure 3. Applications Social Network: APPs of bigger size are of larger degree, APPs of the same color belong to the same community. There exist five APP communities: Video, Music, Instant Messaging (IM), Shopping App, Office App.
3.4
Interaction Between Different Social Networks
With the vast mobile data collected from wireless cellular networks, USN, BSSN and ASN are established from the perspective of SNA. The three networks analysize the different aspect of the data. USN mainly concentrates on the social ties between users and models the behavior characteristics of them. BSSN studies the traffic relationship of each base station and ASN describes the usage pattern of diverse apps. Analysis shows that all of them will be extremely beneficial to the wireless networks.
4.
Conclusions
8 / 8
special characteristics compared with traditional big data. This paper first raises the issues for wireless big data, and then the main data categories in mobile cellular networks are reviewed and described. Finally we study the mobile big data from the social network perspective. USN, BSSN and ASN, which can be used to improve the network performance, are established with the traffic data collected from cellular network.
Mobile big data has produced interesting findings and multidisciplinary scientific advances. In this paper, the social computing methods are all based on the previous collected data, and we are now innovating to use the real-time analysis framework to enhance efficiency and value.
References
[1] “Cisco Visual Networking Index: Global Mobile Data Traffic Forecast Update, 2015–2020 White Paper”
[2] Y. Demchenko, et al. “Addressing Big Data Issues in Scientific Data Infrastructure,” in First International Symposium on Big Data and Data Analytics in Collaboration (BDDAC 2013). May 20-24, 2013, San Diego, California, USA.
[3] W. Fan, Y. Peng, Z. Yuan, P. Chen, C. Hu and X. Zhang, "Sensing and Monitoring for Cellular Networks: A Crowdsourcing Platform from Mobile Smartphones," 2015 IEEE International Conference on Data Science and Data Intensive Systems, Sydney, NSW, 2015, pp. 472-473.
[4] Yang, Jie, et al. "Characterizing User Behavior in Mobile Internet." IEEE Transactions on Emerging Topics in Computing 3.1(2015):95-106.
[5] Xing Zhang, Rong Yu, YanZhang, Wenbo Wang, et al,“Energy-Efficient Multimedia Transmissions through Base Station Cooperationover Heterogeneous Cellular Networks Exploiting User Behavior,” IEEE WirelessCommunications, 21(4), August 2014.
[6] Xing Zhang, Wenbo Wang, et al, “Enhancing Spectral-Energy Efficiency for LTE-Advanced Heterogeneous Networks: A Users Social Pattern Perspective,” IEEE Wireless Communications, April 2014
[7] Chen, Kwang Cheng, M. Chiang, and H. V. Poor. "From Technological Networks to Social Networks." IEEE Journal on Selected Areas in Communications 31.9(2013):548-572.
[8] J. Scott, Social Network Analysis: A Handbook. : Newbury Park, 1991.