467
J. Elementol. 2009, 14(3): 467476
prof. dr hab. Józef Koc, Chair of Land Reclamation and Management, University of Warmia and Mazury in Olsztyn, pl. £ódzki 2, 10-719 Olsztyn, phone: 089 523 36 48, e-mail: katemel@uwm.edu.pl
*Supported by the European Union within the European Social Fund.
THE ROLE OF STORAGE RESERVOIRS
IN REDUCING CALCIUM MIGRATION
FROM AGRICULTURAL CATCHMENTS*
Józef Koc, Marcin Duda
Chair of Land Improvement and Environmental Management University of Warmia and Mazury in Olsztyn
Abstract
This study was conducted on a storage reservoir situated in a valley, in the lower course of the Sz¹bruk stream in north-eastern Poland, the Olsztyn Lakeland mesoregion. The catchment area of the Sz¹bruk stream consists of an agricultural and an afforested part. A storage reservoir is found in the lower part of the Sz¹bruk stream valley. The reservoir was built 25 years ago. It is enclosed by a dike and equipped with an outlet box. Outflows from the reservoir pass through the terminal segment of the Sz¹bruk stream to Lake Wulpiñskie.
The results of the experiment indicate that the calcium content of water evacuated from the catchment was determined by the type and intensity of catchment use, ranging from 22.3 mg Ca×dm-3 to 178 mg Ca×dm-3. The highest calcium concentrations, 113 mg
Ca×dm-3 on average, were noted in the agricultural catchment connected to a drainage
network; lower levels, 78.7 mg Ca×dm-3, were found in farming areas drained via ditches,
while the lowest Ca content in water, 38.7 mg Ca×dm-3 on average, was determined in
outflows from afforested catchments. Calcium concentrations were lower during the gro-wing season in all studied catchment types. The calcium load discharged from the catch-ment dependnded on the catchcatch-ment managecatch-ment. The highest calcium loss per area unit was observed in the drained agricultural catchment (76.6 kg Ca×ha-1×year-1), followed by
the catchment drained via ditches (56.3 Ca×ha-1×year-1) and the afforested catchment (31.8
Ca×ha-1×year-1). Despite the inflow of calcium-rich drainage water, calcium concentrations
decreased by 11%, from 56.8 mg Ca×dm-3 to 50.3 mg Ca×dm-3, after the streams waters
passed through the storage reservoir. An increase in Ca levels was noted in the girdling ditch. The flow of water through the ditch minimizes sedimentation, and higher quantities of Ca were supplied with drainage water. The reservoir accumulated 242.4 kg Ca per ha in the course of one year, mostly in the growing season (83%). The above indicates high involvement of biological processes. The reservoir fulfilled the role of a barrier inhibiting calcium loss from the catchment.
Key words: storage reservoir, agricultural catchment, calcium.
ZNACZENIE ZBIORNIKA RETENCYJNEGO W OGRANICZENIU MIGRACJI WAPNIA ZE ZLEWNI ROLNICZEJ
Abstrakt
Badania prowadzono na zbiorniku retencyjnym po³o¿onym w dolinie koñcowego biegu strugi Sz¹bruk po³o¿onej w pó³nocno-wschodniej Polsce, w mezoregionie Pojezierza Olsz-tyñskiego. Zlewnia strugi Sz¹bruk sk³ada siê z czêci lenej i rolniczej. W dolnej czêci doli-ny strugi Sz¹bruk jest po³o¿odoli-ny zbiornik retencyjdoli-ny wykonadoli-ny przed 25 laty, zamkniêty grobl¹ i mnichem. Odp³ywy ze zbiornika kierowane s¹ koñcowym odcinkiem strugi Sz¹-bruk do Jeziora Wulpiñskiego.
W wyniku badañ stwierdzono, ¿e stê¿enie wapnia w wodzie odp³ywaj¹cej ze zlewni zale¿alo od sposobu i intensyfikacji u¿ytkowania i mieci³o siê w granicach od 22,3 mg Ca×dm-3 do 178 mg Ca×dm-3. Najwy¿sze stê¿enie, rednio 113mg Ca×dm-3, wyst¹pi³o w
wo-dach zlewni rolniczych odwadnianych sieci¹ drenarsk¹, ni¿sze, rednio 78,7 mg Ca×dm-3,
w wodach z terenów rolniczych odwadnianych rowami, a najni¿sze, rednio 39,7 mg Ca×dm-3,
w wodach ze zlewni lenej. We wszystkich zlewniach cz¹stkowych mniejsze stê¿enia wap-nia, stwierdzono w okresie wegetacyjnym ni¿ poza nim. £adunek wapnia odprowadzany z obszaru zlewni by³ uzale¿niony od sposobu jej zagospodarowania. Najwiêkszy odp³yw wapnia z jednostki powierzchni stwierdzono w zlewni rolniczej zdrenowanej (76,6 kg Ca×ha-1×rok-1),
mniejszy ze zlewni odwadnianej rowami (56,3 kg Ca×ha-1×rok-1) i najmniejszy ze zlewni
lenej (31,8 kg Ca×ha-1×rok-1). W wyniku przep³ywu wody przez zbiornik retencyjny
na-stêpowa³o zmniejszenie w niej stê¿enia wapnia o 11%, z 56,8 mg Ca×dm-3 do 50,3 mg
Ca×dm-3, pomimo zasilania zasobnymi w wapñ wodami drenarskimi. W wodach
przep³ywa-j¹cych rowem opaskowym stwierdzono wzrost stê¿eñ Ca, gdy¿ w czasie przep³ywu rowem procesy sedymentacji s¹ du¿o mniejsze, a o wzrocie stê¿eñ zadecydowa³o zasilanie wodami drenarskimi. W ci¹gu roku w misie zbiornika zosta³o zakumulowane 242,4 kg Ca na 1 ha jego powierzchni, z czego wiêkszoæ (83%) w okresie wegetacyjnym. wiadczy to o istot-nym udziale procesów biologicznych. Zbiornik retencyjny pe³ni³ funkcjê bariery zatrzymu-j¹cej odp³yw zwi¹zków wapnia ze zlewni.
S³owa kluczowe: zbiornik retencyjny, zlewnia rolnicza, wapñ.
INTRODUCTION
Calcium ions are the predominant ions in water migrating from agricul-tural catchment areas. For farming needs, the calcium content of soil has to be regularly supplemented through the use of calcium fertilizers. Surface waters contain high levels of calcium due to the leaching of this element from soil, which is a natural and unavoidable process. It results from the open circulation of substances in agricultural ecosystems and their environ-mental dispersion at every level of the trophic and geochemical cycles. In addition to intensive farming practices, calcium leaching is also supported by acid precipitation, which leads to soil acidification (BOWSZYS et al. 2005).
a different perspective than typical contamination or eutrophication. Calci-um significantly affects the physical and chemical properties of water, in-cluding its pH (environmental alkalinization), carbonate (carbonate precipi-tation), sulfate and phosphate concentrations, as well as the coagulation of colloids. As a nutrient, calcium also has a profound effect on hydrobiologi-cal processes. Calcium content in water from agricultural catchment areas has been investigated by few researchers, although calcium concentrations contribute to biological, physical and chemical processes that determine the characteristic properties of water and bottom sediments in water bodies. Calcium levels in water are determined mainly by the volume of calcium load evacuated from the catchment area as well as fixation and sedimenta-tion processes. Calcium is precipitated at the bottom of water bodies in the form of carbonates and organic residues as calciferous gyttia deposits (FÖLLMI
1989, KRAJEWSKI 1984). By fixing other elements, including heavy metal
col-loids, precipitated calcium compounds retain various pollutants.
The objective of this study was to investigate the role of storage reser-voirs as barriers reducing the pollution of water evacuated from agricultural catchments, their effect on the migration of calcium compounds from agri-cultural catchments to surface waters, and their contribution to changes in calcium concentrations and accumulation in the environment.
MATERIALS AND METHODS
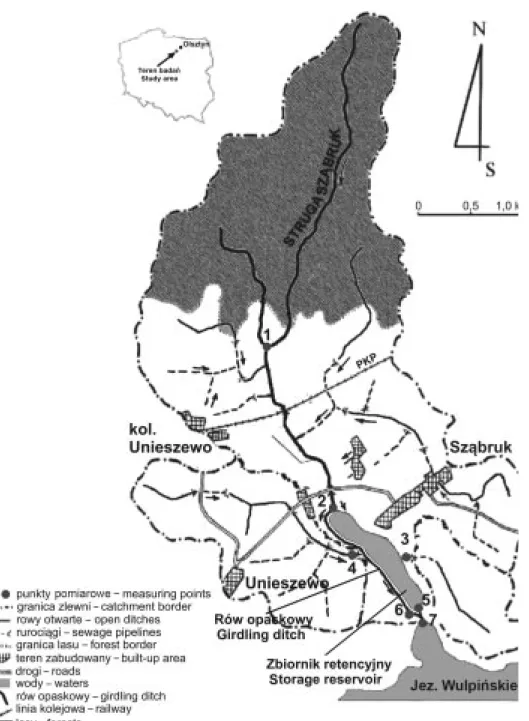
The role of a storage reservoir in calcium migration from an agricultur-al catchment area was anagricultur-alyzed during the hydrologicagricultur-al years 2005/2006 and 2006/2007. The investigated storage reservoir is situated in a valley, in the lower course of the Sz¹bruk stream in north-eastern Poland, in the Masuri-an LakelMasuri-and macroregion Masuri-and in the Olsztyn LakelMasuri-and mesoregion, 10 km south-west of Olsztyn. The catchment area of the Sz¹bruk stream consists of an agricultural and an afforested part. The afforested part of an area of 4.4 km2 occupies 33% of the total catchment area of 13.2 km2 (Figure 1).
The storage reservoir of an area of 24.8 ha and a maximum depth of 1.5 m is found in the lower part of the Sz¹bruk stream valley. It is enclosed by a dike and equipped with an outlet box. The reservoir was built in the 1980s as a fish farming pond, but currently is not used for production purposes. In the western part, the reservoir is enclosed by a girdling ditch which reg-ulates water flow by evacuating excess water to the Sz¹bruk stream. Out-flows from the reservoir pass through the terminal segment of the Sz¹bruk stream to Lake Wulpiñskie. The experiment covered the Sz¹bruk stream and the inflows and outflows of the storage reservoir (Figure 1).
Water flow rates in the Sz¹bruk stream were measured below the affor-ested catchment, at the reservoir inflow (outflow from the agricultural
catch-Fig. 1. Map of Sz¹bruk stream catchment area: 1 Sz¹bruk stream below the afforested catchment, 2 Sz¹bruk stream above the storage reservoir, 3 inflow from the drained catchment to the storage reservoir, 4 inflow from the drained catchment to the girdling ditch, 5 outflow from the storage reservoir, 6 outflow from the girdling ditch, 7 inflow
to Lake Wulpiñskie
ment, inflow to the storage reservoir and to the girdling ditch), at the drain-age outflow to the girdling ditch, at the draindrain-age outflow to the stordrain-age reservoir, at the outflow from the reservoir, at the outflow from the girdling ditch and at the inflow to Lake Wulpiñskie. Flow measurements were per-formed weekly with the use of a VALEPORT electromagnetic flow meter. The volumetric method was applied at low flow levels (below 2 dm3×s-1).
Water samples for physical and chemical analyses were collected every two months at the flow measurement points, and Ca2+ levels were determined
by atomic absorption spectrophotometry in line with the generally observed standards (HERMANOWICZ et al. 1999).
The calcium load evacuated from the catchment, supplied to and dis-charged from the reservoir, was calculated by summing up the product of average monthly flows and the corresponding calcium concentrations.
RESULTS AND DISCUSSION
The results of the study showed significant variations in calcium con-centrations in different segments of the Sz¹bruk stream, in the inflows and outflows from the storage reservoir and the girdling ditch, and in the in-flows to Lake Wulpiñskie, subject to the type of catchment area (Table 1). The lowest calcium levels were noted in the Sz¹bruk stream below the af-forested catchment, which is attributable to the continued leaching of calci-um from the afforested catchment and insufficient calcicalci-um supplementation from precipitation and weathering. Higher calcium levels were determined in stream inflows from the agricultural catchment, at 78.7 mg Ca×dm-3 on
average. The above increased the average Ca content of stream outflows from the combined afforested and agricultural catchments to 56.8 mg Ca×dm-3.
High calcium concentrations, at 113 mg Ca×dm-3 on average, were noted in
outflows from drained catchments. Higher calcium content of outflows from arable land could be attributed to the use of mineral and organic fertilizers (SAPEK 1996). Fertilizer components participate in exchange processes in the
soil, and excess nutrients not absorbed by plants are transferred deeper into the soil and ground waters. The movement of calcium from the soil solution to ground and drainage waters is the main cause of soil depletion. Adequate calcium levels have to be maintained to ensure the soils optimal properties. Calcium concentrations decreased as a result of water flow through the stor-age reservoir by 11% on the annual basis and by 24% in the growing period. The observed calcium content of outflows from the storage reservoir was similar to calcium concentrations in outflows from small, mid-field ponds (54.7 mg Ca×dm-3 and 55.4 mg Ca×dm-3 on average respectively) on brown
and black soils of the Masurian Lakeland (CYMES, SZYMCZYK 2005), and to
in a study carried out in the Olsztyn Lakeland (KOC et al. 2006). A
compari-son of Ca concentrations in the Sz¹bruk stream after passage through the storage reservoir and the girdling ditch showed a greater decrease in the calcium content of reservoir water than of stream water. Once the outflows from the storage reservoir and the girdling ditch were mixed, the average calcium load supplied to Lake Wulpiñskie reached 75.0 mg Ca×dm-3.
An annual calcium balance was developed for different parts of the Sz¹bruk streams catchment area (Table 2). The results of the study indi-cate that along a section stretching from the streams source to a point situated above the storage reservoir, Sz¹bruks waters carried 34.8 t Ca×year-1. The outflows from the afforested catchment carried 13.7 t
Ca×year-1. The above findings supported the conclusion that the Sz¹bruk
stream collected 21.1 t Ca×year-1 during its passage through the
agricultur-al catchment. Annuagricultur-al cagricultur-alcium outflows per hectare of the catchment area increased after the streams waters passed from woodland areas to agricul-tural areas. The calcium loss from afforested areas reached 31.8 kg Ca×year-1,
and it was higher than the amount of calcium evacuated from the catch-ment above the storage reservoir (36.4 kg Ca×ha-1×year-1). The average Ca
outflow from arable land drained via a ditch network was 49.2 kg Ca×ha-1×year-1.
The calcium loss from drained catchments reached 76.0 kg Ca×ha-1×year-1.
1 e l b a T ( s e t i s d e t a g i t s e v n i e h t t a s n o i t a r t n e c n o c m u i c l a c e g a r e v A n=12) n o i t a c if i c e p S g m ( a C ×dm-3) s r a e y l a c i g o l o r d y h d n a 6 0 0 2 / 5 0 0 2 7 0 0 2 / 6 0 0 2 non-growingperiod growingperiod e g a r e v a range average range average range w o l e b m a e r t s k u r b ¹ z S t n e m h c t a c d e t s e r o f f a e h t 39.7 22.3-49.2 36.5 22.3-49.2 42.8 22.3-49.2 e v o b a m a e r t s k u r b ¹ z S r i o v r e s e r e g a r o t s e h t 56.8 43.4-72.4 56.1 43.4-72.4 57.5 43.4-72.4 e h t m o r f s w o lf n I o t t n e m h c t a c d e n i a r d r i o v r e s e r e g a r o t s e h t 112.3 81.0-166.0 120.8 81.0-166.0 102.2 81.0-166.0 d e n i a r d e h t m o r f w o lf n I e h t o t t n e m h c t a c h c t i d g n il d r i g 114.5 86.8-178.0 112.1 86.8-178.0 117.0 86.8-178.0 e h t m o r f s w o lf t u O r i o v r e s e r e g a r o t s 50.3 34.8-67.5 57.0 34.8-67.5 43.6 34.8-67.5 e h t m o r f s w o lf t u O h c t i d g n il d r i g 88.6 65.2-130.0 90.9 65.2-130.0 86.3 65.2-130.0 e k a L o t s w o lf n I e i k s ñ i p l u W 75.0 62.8-126.0 77.3 62.8-126.0 72.3 62.8-126.0
The Sz¹bruk stream was divided above the storage reservoir, as a re-sult of which part of its waters were fed directly to the reservoir, while the remaining flow was evacuated via the girdling ditch. According to the annu-al bannu-alance, the storage reservoir accumulated 31.8 kg Ca×ha-1×year-1
(Ta-ble 3). A decrease in the calcium load could be attributed to the formation of insoluble or sparingly soluble calcium compounds as well as to sedimenta-tion (carbonates, sulfates and phosphates) (FÖLLMI 1989, KRAJEWSKI 1984).
Cal-cium was accumulated mainly in the growing period (83% of annual accu-mulation) when the calcium load in water flowing through the storage reservoir was clearly lower. The reservoir accumulated 1.014 kg Ca×ha-1×year-1. The above suggests that calcium binds with the phosphate
form released during the decomposition of fresh organic matter and deposits in the warm season of the year, and that it forms insoluble calcium carbon-ate that binds with hydrcarbon-ated excess carbon dioxide. Calcium could also be 2 e l b a T t n e m h c t a c e h t f o s t n i o p s u o i r a v t a d a o l m u i c l a C n o i t a c if i c e p S d a o l a C l a t o T g k ( ×year-1) (kg×Chaa-l1o×yaedar-1) l a c i g o l o r d y h s r a e y 6 0 0 2 / 5 0 0 2 d n a 7 0 0 2 / 6 0 0 2 g n i w o r g -n o n d o i r e p gproewriiondg l a c i g o l o r d y h s r a e y 6 0 0 2 / 5 0 0 2 7 0 0 2 / 6 0 0 2 d n a w o l e b m a e r t s k u r b ¹ z S t n e m h c t a c d e t s e r o f f a e h t 13657 5022 8634 31.8 e v o b a m a e r t s k u r b ¹ z S r i o v r e s e r e g a r o t s e h t 34762 137230 21032 36.4 k u r b ¹ z S e h t m o r f s w o lf n I r i o v r e s e r e g a r o t s e h t o t m a e r t s 23418 9183 14236 -k u r b ¹ z S e h t m o r f s w o lf n I h c t i d g n il d r i g e h t o t m a e r t s 11433 4637 6796 -d e n i a r d e h t m o r f s w o lf n I r i o v r e s e r e h t o t t n e m h c t a c ) t n e m h c t a c l a r u t l u c i r g a ( 2719 1163 1556 75.5 d e n i a r d e h t m o r f s w o lf n I h c t i d g n il d r i g e h t o t t n e m h c t a c ) t n e m h c t a c l a r u t l u c i r g a ( 5483 1523 3960 76.6 e g a r o t s e h t m o r f s w o lf t u O r i o v r e s e r 20124 9330 10794 -g n il d r i g e h t m o r f s w o lf t u O h c t i d 19470 9027 10444 -e i k s ñ i p l u W e k a L o t s w o lf n I 39595 18357 21238 38.8
absorbed by the reservoirs vegetation in amounts reaching 16.6 kg Ca×ha-1×
×year-1 (KOC, SZYPEREK 2003). On average, the reservoir accumulated 242.9 kg
Ca per ha, including 201.5 kg (83%) in the growing season and only 40.9 kg (17%) in the winter. A much higher drop in calcium concentrations and loads in the reservoir over the growing period is indicative of intense biological processes during which the investigated element is fixed and accumulated in bottom deposits. The accumulation of calcium compounds in bottom de-posits was also noted during a previous study of the storage reservoir in Sz¹bruk (KOC, SKONIECZEK 2006). The authors found that the calcium content
of a dry deposit sample collected in the terminal segment of the reservoir was 2.5% at a depth of up to 10 cm and 9.3% at a depth of 10 to 20 cm. Different results were reported in respect of calcium concentrations and loads in the girdling ditch parallel to the analyzed reservoir. Ditch water was additionally supplied with calcium by inflows from the drainage net-work (5.3 t Ca×year-1) and by percolation. For this reason, calcium
accumu-lation levels were measured in both the reservoir and the girdling ditch. A total of 45.6 t Ca×year-1 was discharged to the catchment, of which 39.6 t
Ca×year-1 was evacuated from the girdling ditch and the storage reservoir
to Lake Wulpiñskie. The average calcium load discharged from the entire catchment area to the lake decreased by 13%, from 44.7 kg Ca×ha-1×year-1
to 38.8 kg Ca×ha-1×year-1. 3 e l b a T e k a l e h t o t t n e m h c t a c m a e r t s k u r b ¹ z S e h t m o r f s w o lf n i e h t n i e c n a l a b m u i c l a C n o i t a c if i c e p S d a o l a C g k ( ×year-1) d n a m a e r t s g n il d r i g h c t i d e g a n i a r d k r o w t e n w o lf n i e k a L o t e i k s ñ i p l u W e c n e r e f f i d n o i t c u d e r a C ( e h t n i ) r i o v r e s e r r a e y l a c i g o l o r d y H e h t g n i d u l c x e r i o v r e s e r 42889 2719 45608 2 1 0 6 e h t g n i d u l c n i r i o v r e s e r 42889 2719 39596 n o s a e s g n i w o r g -n o N e h t g n i d u l c x e r i o v r e s e r 18210 1163 19373 4 1 0 1 e h t g n i d u l c n i r i o v r e s e r 18210 1163 18359 n o s a e s g n i w o r G excrleusderinvgoirthe 24679 1556 26235 4998
CONCLUSIONS
1. The calcium content of water evacuated from the catchment was de-termined by the type and intensity of catchment use. The highest calcium outflows per area unit were noted in the agricultural catchment connected to a drainage network, lower concentrations were found in the catchment drained via ditches, while the lowest Ca content of water was determined in the outflows from afforested catchments. Calcium concentrations were low-er during the growing season in all studied catchment types.
2. Calcium concentrations decreased by 11%, from 56.8 mg Ca×dm-3 to
50.3 mg Ca×dm-3, following the passage of the streams waters through the
storage reservoir. An increase in Ca levels was noted in the water flowing through the girdling ditch.
3. The reservoir accumulated 242.4 kg Ca per ha in the course of one year, mostly in the growing season (83%). The above indicates high involve-ment of biological processes. The reservoir fulfilled the role of a barrier inhibiting calcium loss from the catchment.
REFERENCES
BOROWIEC S., PIEÑKOWSKI P. 1993. Oddzia³ywanie geochemiczne i antropogeniczne na chemizm
wód obszarów rolniczo-lenych Pomorza Zachodniego [The geochemical and anthropo-genic impact of agricultural and afforested areas in Western Pomerania]. Geoekosys-tem obszarów nizinnych, Ossolineum, Wroc³aw, 19-23. [in Polish]
BOWSZYS T., RUSZKOWSKI K., BOBRZECKA D., WIERZBOWSKA J. 2005. Wp³yw wapnowania i nawozów
wielosk³adnikowych na odczyn i zawartoæ niektórych metali ciê¿kich w glebie [Effect of liming and multicomponent fertilizers on reaction and content of some heavy metals in soil]. J. Elementol., 10(1): 33-40. [in Polish]
CYMES I., SZYMCZYK S. 2005. Wp³yw u¿ytkowania i typu gleby na zawartoæ sodu, wapnia
i magnezu w wodzie ródpolnych ma³ych zbiorników [Effect of land use and type on the content of sodium, calcium and magnesium in water of small mid-field water bodies]. J. Elementol., 10(2): 249-257. [in Polish]
FÖLLMI K. B. 1989. Evolution of the Mid-Cretaceous Triad. Platform carbonates, Phosphatic
sediments, and pelagic Carbonates along the Northern Tethys Margin. Lec. Notes Earth Sci., 23: 1-153.
HAYCOCK N.E., PINAY G., BURT T.P., GOULDING K-W.T. 1996. Buffer zones: Currcnt concems and
future directions. In: Buffer zones: Quest Environmcntal. Hertfordshire, UK, 305-312. HERMANOWICZ W., DOJLIDO J., DO¯AÑSKA W., KOZIOROWSKI B., ZERBE J. 1999. Fizyczno-chemiczne
badanie wody i cieków [Physicochemical examination of water and sewage]. Arkady, Warszawa, ss. 556. [in Polish}
KOC J., KOC-JURCZUK J., SIDORUK M. 2006. Effect of renaturization of a lake on the quality of its
waters: a case study of Ardung Lake in the capture basin of the £yna river. Pol. J. Envi-ron. Stud., 15(5D): 586-591.
KOC J., SKONIECZEK P. 2006. Concentration of trace elements in bottom sediments of a stream,
a pond and a lake loaded with runoffs from an agricultural catchment. Pol. J. Environ. Stud., 15 (2a): 356-363.
KOC J., SZYPEREK U. 2003. Znaczenie szaty rolinnej zlewni i przybrze¿nych pasów rolinnoci
w ochronie ródpolnych oczek wodnych [Role of plant cover in a catchment and shoreli-ne plant belts in protecting mid-field water ponds]. Wiad. Mel. £¹k., 2: 73-75. [in Polish] KRAJEWSKI K.P, 1984. Early diagenetic phosphate cements in the Albian condensed
glauconi-te limestone of the Tatra Mountains, Wesglauconi-tern Carpathians. Sedimentology, 31: 443470. SAPEK A. 1996. Udzia³ rolnictwa w zanieczyszczeniu wody sk³adnikami nawozowymi
[Con-tribution of agriculture in contaminating water with fertilizer components]. Zesz. Eduk., 1: 9-33, Wyd. IMUZ, Falenty. [in Polish]
SZYMCZYK S., CYMES I. 2005. Wp³yw iloci opadów i sposobu u¿ytkowania terenu na odp³yw
sodu wapnia i magnezu sieci¹ drenarsk¹ z gleb ciê¿kich [Effect of precipitation volumes and land use type on outflow of calcium and magnesium through a drainage network from heavy soils]. J. Elementol., 10(2): 395-401. [in Polish]