Abstract
Upper-Cretaceous marls and limestones of the Gosau Group, exposed in an abandoned quarry southwest of Vienna, Austria, show folds of unknown origin. In order to distinguish between a tectonic (Cenozoic Alpine nappe stacking) and gravitational cause for this deformation, we created a 3D model of a representative part of the outcrop.
From more than 500 photographs we generated a point cloud using the software Photosynth™. This freeware is available on www.photosynth.net and only requires a series of overlapping pictures of the same scenery from different perspectives, and pref-erably various distances. The pictures need to be loaded onto a web server, where they are arranged in 3D by pattern recognition, and a coloured point cloud is generated. The RGB- and xyz-values of this point cloud can be downloaded and the latter can also be imported into the 3D geomodelling software GOCAD® (Paradigm). From this dataset, we constructed the quarry walls as trian-gulated surfaces and mapped the folded sedimentary layers. Using a differential GPS, we additionally mapped several prominent bedding planes and were able to georeference the whole setting.
In combination with structural measurements of sedimentary layering, fold axes and axial planes as well as fault planes, the con-structed 3D structural model clearly indicates that the exposed fold train was formed by gravitational slumping and is not related to nappe stacking and folding.
The workflow to generate 3D geological datasets from a series of photographs may be a useful addition or alternative to more sophisticated and cost-intensive tools like laser scanners or total stations.
Oberkretazische Mergel und Kalke der Gosau-Gruppe, aufgeschlossen in einem stillgelegten Steinbruch südwestlich von Wien, zeigen Falten unbekannter Herkunft. Um zwischen einer tektonischen (känozoischer alpiner Deckenbau) und einer gravitativen Ursache dieser Deformation zu unterscheiden, fertigten wir ein 3D-Modell eines repräsentativen Teils des Aufschlusses an.
Aus über 500 Fotos generierten wir mit Hilfe der Software Photosynth™ eine Punktwolke. Diese Software ist kostenlos verfügbar unter www.photosynth.net und verlangt lediglich eine Serie einander überlappender Bilder, welche dieselbe Szenerie aus unter-schiedlichen Perspektiven und möglichst verschiedenen Distanzen zeigen. Die Bilder müssen auf einen Webserver geladen werden, wo sie durch Mustererkennung dreidimensional angeordnet werden und eine farbige Punktwolke erzeugt wird. Die RGB- und xyz-Werte dieser Punktwolke können heruntergeladen und letztere in die 3D-Geomodellierungs-Software GOCAD® (Paradigm) impor-tiert werden. Ausgehend von diesem Datensatz konstruierten wir die Wände des Steinbruchs als triangulierte Oberflächen und kar-tierten die verfalteten sedimentären Schichten. Mit einem differentiellen GPS (Taschen-Gerät von Trimble) karkar-tierten wir zusätzlich einige markante Schichtflächen und waren so in der Lage, das Modell zu georeferenzieren.
In Kombination mit strukturellen Messungen der sedimentären Schichten, Faltenachsen und Axialebenen sowie der Störungsflä-chen, zeigt das konstruierte 3D-Modell klar, dass der aufgeschlossene Faltenzug durch eine gravitative Rutschung geformt wurde, und nicht mit einer späteren Deckenstapelung oder Faltung zusammenhängt.
Geologische 3D-Datensätze mittels Fotoserien zu generieren kann eine nützliche Ergänzung oder Alternative zu höher entwickel-ten und kosentwickel-teninentwickel-tensiveren Methoden wie Laser Scannern oder Tachymetern sein.
_____________________________________________ _____________________________________________________ ___________________________________________________________________________________ ______________________________________________ _____ ________________________________ __________________________________________ _______________________________________ KEYWORDS Photogrammetry Differential GPS Gosau Group 3D modelling Slump fold
3D structural modelling of an outcrop-scale fold train
using photogrammetry and GPS mapping___________________
*)
Andrea SCHOBER & Ulrike EXNER
University of Vienna, Department of Geodynamics and Sedimentology, Althanstrasse 14, A-1090 Wien, Austria;
*)
Corresponding author, [email protected]
1. Introduction
Terrestrial laser scanning has become increasingly popular among geologists for the acquisition of 3D topographic data of outcrops (McCaffrey et al., 2005; Jones et al., 2009; Spahić et.al., 2011). Unfortunately, this highly accurate technology is rather expensive, and requires bulky equipment in the field and a certain level of technical expertise. The aim of this stu-dy was to test and evaluate an alternative method of creating a 3D surface model by using standard digital cameras and a simple photogrammetric software.
For this purpose we selected an outcrop of Upper Cretace-______________________
ous Gosau Group sediments, exposing complex folds of either tectonic or gravitational origin. Since it is essential for the in-terpretation of the observed structures to determine not only their orientation, but also their spatial relationship, we decided to visualize the geological setting in a 3D model.
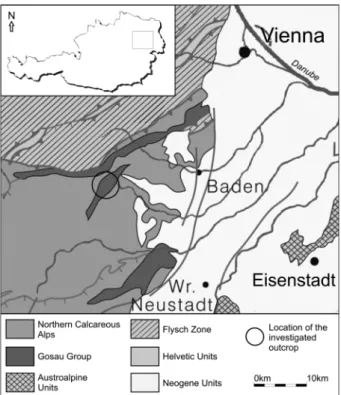
The quarry Tasshof is located ca. 30 km south-west of Vien-na, along a ridge between the villages of Tasshof and Sulz-bach (UTM coordinates: 575545m Easting, 5317025m Nor-__________
2. Geological Setting
thing, UTM Zone 33). The exposed rocks at the northeastern margin of the Northen Calcareous Alps (Fig.1) belong to the Gosau of Furth, which lies on top of the Untersberg- and Reis-alpen-Nappe and below the Göller Nappe. (Faupl, 2003; Wes-sely, 2006). The outcrop exposes sediments of the Nierental Formation, which is part of the Gosau Group of Turonian to Eocene age. The Gosau Group consists of siliciclastic-carbo-nate sedimentary strata that were deposited in small basins after the climax of the Cretaceous Alpine orogeny, lying dis-cordantly above the mid-Cretaceous fold and thrust belt (Wag-reich, 1995; Stanley, 2001; Krenmayr, 2002). The sediments are divided into an upper and a lower Gosau Subgroup. The lower Gosau Subgroup comprises terrestrial to shallow marine deposits whereas the upper subgroup contains deep marine deposits, reaching from bathyal to abyssal (Wagreich, 1995; Wagreich and Decker, 2001; Faupl, 2003; Wessely, 2006). The latter includes the Nierental Formation, which was deposited from Campanian to Maastrichtian. Flow-sediments and slum-ping packages appear frequently and the continental slope above the CCD is inferred as the most likely sedimentological environment. (Wagreich, 1993; Krenmayr, 1999).
In the investigated outcrop calcareous marls with ichnofossils, e.g. Planolites, Chondrites and Zoophycos (Ilickovic, 2011), alternate with fine- to medium-grained, partially thin-bedded and graded calcareous sandstone layers. In some sections relatively massive, graded breccias can be found. The quarry is comprised of two levels, and a sedimentary profile (Ilicko-vic, 2011; see also Wagreich et al., 2011) was logged in the upper level, which coincides with the western part of the 3D-model generated in this study.
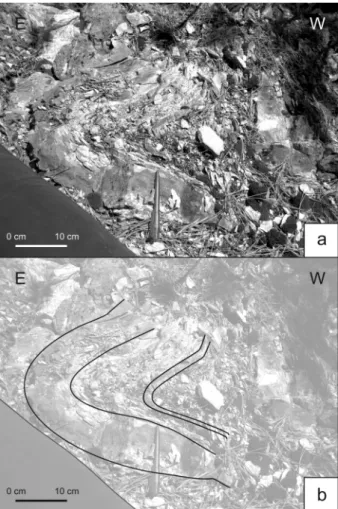
A section of the quarry containing several folds of different size and orientation within a small area was chosen for the construc-tion of the 3D model. In detail, folded sandstone layers (Fig. 2) as well as an isolated fold hinge within sandstone- and marl-layers (Fig. 3) are exposed in this section. In contrast, most other expo-sed layers in the quarry lack this intense folding. Thus, a detailed structural investigation was performed, in order to determine the orientation and relative position of the folds, as well as their rela-tion to other structural and sedimentary features, e.g. slickensi-des and joints or sedimentary breccias, and thereby constrain the either tectonic or gravitational origin of the folds.
For the generation of a georeferenced 3D model, severaltech-niques were combined. Accurate geospatial positions of selec-ted structural features were recorded using a differential GPS (DGPS) receiver. Additionally, a topographic model of the out-crop was generated using the freeware Photosynth . Finally, both datasets were combined in the 3D geological modeling software GOCAD®.
For the DGPS field mapping a GeoXH handheld computer __________
_________________________
________
3. Description of the outcrop
4. Methods
4.1 Differential GPS-Mapping
™™
Figure 1: Geological overview of the eastern margin of the Nor-thern Calcareous Alps (modified after Egger et al., 1999), and location of the studied outcrop.______________________________________
Figure 2: High amplitude folds in calcareous sandstone and marl beds (traced by a black line in the image), exposed in the western part of the studied outcrop. Unfolded, parallel beds are exposed in the lo-wer right of the image.______________________________________
from the GeoExplorer® 2008 series (Trimble®) was used (Pas-schier and Exner, 2010). This device can reach an accuracy of 0.8-0.2 m (horizontal) and 1.6-0.4 m (vertical), respectively. The differential correction was performed with the Trimble® post-processing software GPS Pathfinder Office using refe-rences data from the Trimble Reference Stations.
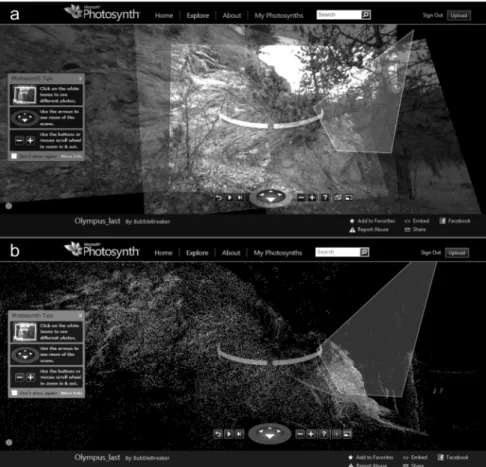
The web-based software Photosynth (http://photosynth.net) generates a 3D model (called synth in the following text) and a corresponding point cloud, in a similar procedure as com-mercial photogrammetric software tools (e.g. ShapeMetriX3D, see e.g. Ebeling (2009) and Pack et al. (2009) for details). Several overlapping photographs taken of the same area at different angles and distances are matched by pattern recog-nition. The software is able to spatially arrange the images accordingly, providing also a visual representation of the indi-vidual vantage point and size of each picture. From this infor-mation, the software is able to retrieve the position of each identified pixel and saves their x, y and z coordinates. The resulting point cloud, i.e. the group of identified pixels, is de-picted in a 3D view and can be downloaded using a simple additional tool (SynthExport, which can be downloaded from http://synthexport.codeplex.com/).
Subsequently, the data can be imported into GOCAD® or __________
______________________
4.2 Photosynth™
any other 3D visualisation software capable of reading xyz data (e.g. AutoCAD, Bentley).
The pictures may be acquired with any camera type and re-solution, even images taken with different cameras at different times may be combined. Nevertheless the quality of the synth can easily be enhanced if some instructions are followed: (i) An overlap of approximately 50% between neighboring images is required as well as the repetition of identical features in se-veral images. (ii) Any photographed object should be displayed in at least three separate pictures taken from different pers-pectives. (iii) When convex objects are to be synthed, a mini-mum of one photo every 15° is required. (iv) Photos from grea-ter distance should be combined with close-up views of the same features, wherever greater detail is desired.
Before starting the 3D reconstruction, one needs to assure that all portrait images are saved with the correct side up. All pictures are then uploaded onto the web-server, where they are arranged in 3D by pattern recognition (Fig. 4.a) and a coloured point cloud is generated (Fig. 4.b). For every point xyz- as well as RGB-information is stored. Once the upload process is finished and the synth is displayed, no additional images can be added to this object.
Photosynth™ is not able to process more than 300 pictures at one time. If more pictures are required, they have to be split up in subgroups and the procedure has to be performed se-veral times. The xyz- and RGB-values of the generated point clouds as well as the camera parameters can be exported using the program SynthExport. This free software can be downloaded from http://synthexport.codeplex.com.
The 3D geo-modelling software package GOCAD® (Para-digm®) is able to import and correctly display the xyz-values of the exported point clouds. Unfortunatly it is not able to read the RGB-information and add this additional information to the individual points. However, the software is still preferred, as it can be used to construct and edit additional data from the original input dataset.
If several point clouds need to be created for a single object, each point cloud is internally consistent, but the different point clouds do not share the same coordinate system. For that reason, they differ in size and orientation, which needs to be corrected using e.g. GPS measurements of distinctive points. Moreover, this method of creating a point cloud inevitably invol-ves a certain level of noise, which needs to be eliminated to create a most accurate representation of the outcrop topogra-phy. One straightforward way to create a surface in GOCAD® is to generate a triangulated surface directly between the points of a cloud. Unfortunately, the point clouds we were able to create in this study are far not accurate enough for this procedure, because the points lie within a range of ca. 20-50 cm from the true outcrop topography in a direction per-pendicular to the respective orientation of the surface. Addi-tionally, the points are not homogeneously distributed along
_________________________
_____________________________
_________ ____________________ _________ _____________________________5. The 3D modelling procedure of the
out-crop topography
Figure 3: Small-sized fold of a sandstone layer and thin-bedded marls in the fold core.______________________________________
the outcrop surface, as the resolution and distance of the pho-tographs to the outcrop is not uniform. Due to the inhomoge-neous distribution and scattering of points, the resulting sur-faces directly triangulated from the original points are very rough. This can be avoided by generating a flat triangulated surface at the correct position in the 3D model and approxi-mate it to the point cloud by interpolation.
For the outcrop investigated in this study, it was necessary to create several synths from different viewpoints of the out-crop, resulting in several point clouds. After creating a surface for each point cloud, different surfaces of various sizes and orientations were obtained. In order to create a single/final surface representing the entire outcrop topography, the vari-ous surfaces were arranged correctly together with the corres-ponding point sets and a new surface was generated from the combined point sets.
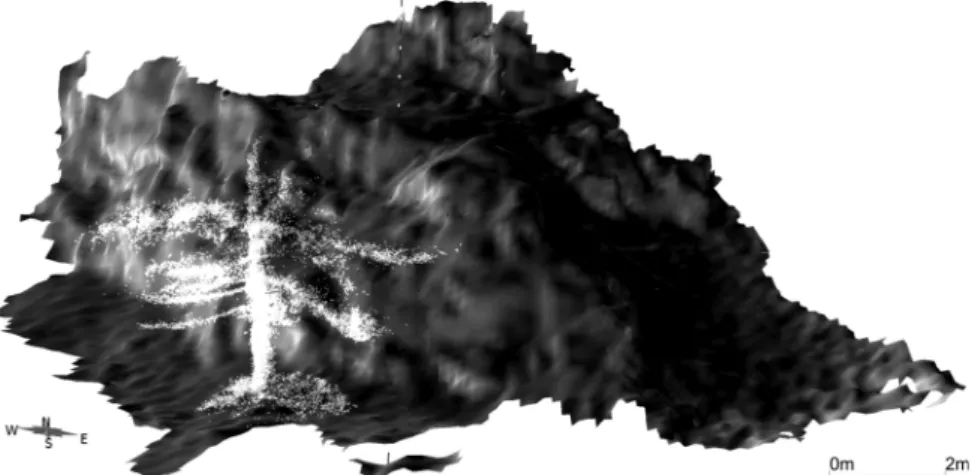
Since in this case the final point cloud consisted of more points than GOCAD® was able to process, it had to be divi-ded into 6 parts. Separate surfaces were generated for each part which were then combined to one overall surface (Fig. 5).
In the field several prominent layers and features were map-ped with a DGPS. The data were imported to GOCAD® and ________________
_________________________________
5.1 Georeferencing and display of
struc-tural data
used to georeference the model. Geological structures can be con-structed within the now correctly po-sitioned model. In order to generate sedimentary layers as triangulated surfaces with accurate dip direction and dip, the layers first need to be digitized on the outcrop surface as a polyline. A copy of this line can then be moved by a simple mathe-matical operation in the desired x, y, and z direction and distance, en-suring the correct position taking in-to account the dip direction and dip angles measured in the field. Finally, a surface can be created between the two parallel curves.
In a similar way, fold axes and axi-al planes can be generated and ented in the correct position and ori-entation (Fig. 6), ideally reconciling both field measurements and struc-tures constructed in GOCAD®.
The majority of the measured se-dimentary layers show dip towards the NW, the average azimuth/dip is 338/49 (Fig. 7.a). The observed folds
__________
____
6. Geological
observa-tions
differ remarkably in size, ranging from amplitudes of several meters (Fig. 2) down to some decimetres (Fig. 3). The larger folds (Fig. 2 and marked as I in Fig. 6) are still connected to the underlying, unfolded beds (lower right of Fig. 2 and II in Fig. 6). In contrast, the layers of the small sized fold shown in Fig. 3 (III in Fig. 6) lack any connection to the neighbouring rock. Both fold axes plunge between 45° and 88° towards the NW (Fig. 7.b); the corresponding axial planes (not displayed in Fig. 6, but plotted as great circles in Fig. 7b) of the different folds are roughly perpendicular with respect to each other. This type of refold structure, with parallel fold axes and orthogonal axial planes can be classified as type 3 (hooks and crescent) interference pattern (Ramsey and Huber, 1984).
Besides the folded layers, structural features also include brittle faults exposed mostly the lower part of the outcrop (mar-ked as area IV in Fig. 6), most of which are shallow NW-dip-ping fault planes with top to the SE thrusting kinematics. Ad-ditionally, steeply dipping, NE-SW trending strike-slip faults with dextral kinematics occur (Fig. 7.c & Fig. 7.d), some of which show a gradual transition from top to the NE thrusting to dextral strike slip by curved slickensides.
At some parts of the outcrop heterogeneous breccias were observed, showing very small (1-5 cm in diameter) to large (up to 50 cm in diameter) components. Several of those large components were identified as fragments of calcareous
sand-___________
______________
Figure 4: TM
a: 3D-view of the overlapping pictures in Photosynth . The software arranges the pic-tures according to the focal length and matched patterns, and thereby creates a panoramic view of the scenery. b: View of the automatically generated point cloud, where every point represents an x-, y- and z position on the outcrop surface._________________________________________________
Figure 5: The complete outcrop surface constructed from several stitched surfaces, including a point cloud of a tree in the foreground._________________________________________________
Figure 6: The final surface and structural model of the outcrop. Sedimentary layers (multi-coloured planes), fault planes (red planes) and fold axes (red lines) are displayed in colour with accurate spatial distribution and orientation. Areas I-V indicate sedimentary and structural features referred to in the text.___________________________________________________________________________________________________________________
stone beds similar to the overlying, continuous beds.
The generally NW-dipping calcareous sandstone and marl beds in the Tasshof quarry are folded, but the origin of the fol-ding is unclear. The purpose of this study was to distinguish between tectonic deformation and sedimentary slumping as deformation process for these structures. Several facts inhibit a straightforward answer to this question in the studied out-crop. Large parts of the outcrop are inaccessible, so direct measurement of the orientation of structural and sedimentary features is impossible. The continuation of bedding planes is not easily recognized, especially as most of the exposed rocks are grey carbonates, with very little optical contrast. Thus, to clarify the orientation and relative position of folded layers, we
_______
__
7. Discussion
7.1 Constraints on a tectonic or
gravi-tational origin of the observed folds
created a 3D-model of a represen-tative part of the outcrop (Fig. 6), which should facilitate the interpreta-tion by providing a comprehensible overview of the entire outcrop. The model highlights the folded sedimen-tary layers (multicoloured planes) and the faults cutting through the rock (red planes) on top of the out-crop topography displayed in grey. Furthermore, fold axes (represented by the red lines) are also displayed.
Detailed mapping of the calcare-ous sandstone and marl beds revea-led that in many areas the beds are fragmented, especially in the upper and lower central parts of the outcrop (above III and around IV in Fig. 6, respectively). In these areas, layers end abruptly or are even completely disrupted from the other beds and em-bedded in a fine grained matrix. In contrast, the lower western part (area II in Fig. 6) contains a more or less coherent strati-fication (Ilickovic, 2011).
The variability of the observed fold axial plane orientation, and partly also the orientation of fold axes, is remarkable. The larger folds (I and V in Fig. 6) are roughly parallel dipping to the NW (Fig. 7b), although the amplitudes and wavelengths are much smaller in area I than in V. In comparison, the axial plane of the smaller sized fold (Fig. 3, III in Fig. 6) is dipping to the WSW, indicating NE-SW compression, and the folded layers are disconnected from the surrounding beds. As the lat-ter fold is located in the limb of the larger folds with NW-dip-ping axial planes, it can be interpreted to be generated earlier, and refolded by the second fold in a later NW-SE compression.
To our knowledge such a complex, polyphase folding by tec-______________________________
tonic compression is not recorded in other outcrops of Gosau Group sediments, whereas slumping has been described by previous studies both in other outcrops of the Upper Gosau Subgroup in the eastern (Wagreich and Krenmayr, 2005) and in the western part (Ortner, 2007) of the Northern Calcareous Alps. Moreover, no genetic connection between the described brittle fault planes and the folded bedding can be identified, as the faults cut across the folded layering and are not found as striations on bedding planes (parallel to the bedding both in the fold limbs and in fold hinges), which would indicate flex-ural slip folding.
From our combined observations of refold structures, tight folds of variable amplitudes, and abundant breccias, we con-clude that the deformation mechanism was most likely gravi-tational slumping shortly after the deposition of the layers, ra-ther than tectonic compression during a later orogenic phase.
The core of this method is the use of photogrammetry to ac-quire a point cloud and subsequently generate a 3D model of the outcrop surface, where structural features can additionally be displayed. Apart from the obvious advantages of the me-thod compared to more sophisticated, expensive techniques, there are several aspects which need to be considered before attempting an application for a geological objective.
(i) Modelling a convex outcrop is far more intricate than a concave quarry wall. Several synths need to be generated and later combined to a representative outcrop surface, which is certainly a source of additional error. (ii) Outcrops with poor contrast in colour or brightness of the individual geological features should be avoided, as the software will have difficul-ties to match identical points in the individual photographs, and will thus not be able to use all images for the 3D recon-struction. (iii) The presence of vegetation around the outcrop (e.g. trees blocking the view) results in a significant amount of surplus work, again requiring the generation of several sub-sets which need to be combined in a later stage.
In this paper we demonstrated that even under suboptimal conditions, this approach can be used to generate a 3D sur-face and structural model. However, the quality of the model _____________________________________
__________
________
__________
7.2 Applicability of the photogrammetric
method for structural geology
and the advantage of a rather rapid method will be significantly higher if the previous suggestions are considered.
The structural data visualized in the 3D model strongly con-firms the synsedimentary origin of the exposed fold train. The variable orientation of axial planes (as well as to a minor ex-tend fold axes), the occurrence of poorly sorted breccias, and the lack of connection to fault structures present in the outcrop, indicates that the folds are caused by gravitational slumping and cannot be related to later tectonic deformation.
Even though some geometry features (e.g. convex shape, vegetation, low colour contrast of the geological features) of the outcrop posed significant difficulties, the final 3D surface and structural model is satisfying for the purpose of this study. Thus, the procedure to create 3D geological datasets from a series of photographs is a useful addition or alternative to more advanced and expensive equipment like laser scanners or total stations.
We thank Michael Wagreich for encouraging this detailed structural work, as well as Tanja Ilickovic, Aleksandra Popovic and Mathias Bichler for collaboration and support in the field and fruitful discussions. Furthermore we acknowledge financial support by the FWF Project V151-N22 and the OMV project "Analysis and correlation of Gosau-type sediments from the Vienna Basin basement and its surroundings in Austria and Slovakia [Gosau Inventory]” and Stephanie Neuhuber for provi-ding geological maps. Thorough reviews by G. Viola and R. Mar-schallinger significantly improved the quality of the manuscript.
Anwendung berührungsloser geologischer Strukturmessungen im Tagebau. In: Marschallinger, R., Wanker, W., Zobl, F. (Eds.). Online Datenerfassung, berührungslose Messverfahren, 3D-Modellierung und geotechnische Analyse in Geologie und Geotechnik. Beiträge zur COG-Fachtagung Salzburg 2009. p 67-74. _________ ________ ______________________________
8. Conclusion
Acknowledgements
References
Ebeling, P., 2009.Figure 7: Sedimentary and structural features in the outcrop (southern hemisphere stereographic projection). a: Bedding planes dip consistently towards NW. b: Fold axes of large folds (open circles, I and V in Fig. 6) and small fold (crossed circle, marked as III in Fig. 6), with the corresponding axial planes and fold limbs (dashed lines). c: Brittle fault planes show dextral strike-slip kinematics. d: Brittle fault planes dipping very shallowly to the NW, with top to the SE kinematics._____________________________________________________________________________________________
Egger, H., Krenmayr H. G., Mandl, G.W., Matura, A., Nowotny, A., Pascher, G., Pestal, G., Pistotnik, J., Rockenschaub, M. and Schnabel, W., 1999.
Faupl, P., 2003.
Ilickovic, T., 2011.
Jones, R.R., McCaffrey, K.J.W., Clegg, P., Wilson, R.W., Holli-man, N., Holdsworth, R.E., Imber, J., Waggott, S., 2009.
Krenmayr, H. G., 1999.
Krenmayr, H.G., 2002.
McCaffrey, K.J.W., Jones, R.R., Holdsworth, R.E., Wilson, R. W., Clegg, P., Imber, J., Holliman, N., and Trinks, I., 2005.
Ortner, H., 2007.
Pack, G., Zangerl, C., Kieffer, S., and Kurz, W., 2009.
Passchier, C.W., and Exner, U., 2010.
Ramsay, J. G. and Huber, M. I., 1984.
Spahić, D., Exner, U., Behm, M., Grasemann, B., Haring, A. and Pretsch, H., 2011.
Geological Map of Austria 1:2.000.000. Geologische Bundesanstalt, Wien.
nd
Historische Geologie (2 Edition). Facultas Universitätsverlag, Wien. 270 pp.
Sedimentologisches Profil der Nierental-For-mation im Steinbruch Tasshof (Niederösterreich). BSc Thesis, Universität Wien, Wien. 37 pp.
Inte-gration of regional to outcrop digital data: 3D visualisation of multi-scale geological models. Computers & Geosciences, 4-18.
Die Nierental-Formation der oberen Gosaugruppe (Oberkreide – Paleozän, Nördliche Kalkalpen) in Berchtesgaden: Definition, Fazies und Environment. Jahr-buch der Geologischen Bundesanstalt, 141(4), 406-447.
Rocky Austria – Eine bunte Erdgeschich-nd
te von Österreich (2 Edition). Geologische Bundesanstalt, Wien. 64 pp.
Un-locking the spatial dimension: digital technologies and the fu-ture of geoscience fieldwork. Journal of the Geological Socie-ty, London 162, 927-938.
Styles of soft-sediment deformation on top of a growing fold system in the Gosau Group at Muttekopf, Northern Calcareous Alps, Austria: Slumping versus tectonic deformation. Sedimentary Geololgy, 196, 99-118.
Photo-grammetric Measurements with Application to the 1999 Huben Slope Failure, Ötztal, Austria. In: Marschallinger, R., Wanker, W., Zobl, F. (Eds.). Online Datenerfassung, berührungslose Messverfahren, 3D-Modellierung und geotechnische Analyse in Geologie und Geotechnik. Beiträge zur COG-Fachtagung Salzburg 2009. p 75-81.
Digital mapping in struc-tural geology – examples from Namibia and Greece. Journal of the Geological Society of India 75, 32-42.
The Techniques of Mo-dern Structural Geology: Strain Analysis. Academic Press, London. 307 pp.
Listric versus planar normal fault geo-metry: an example from the Eisenstadt-Sopron Basin (E Aus-tria). International Journal of Earth Sciences, 100, 1685-1695. ______________________ ______________________ _________________________ ____ _______________________________________ _____________________________ __________ ______________________________ ________________ ____________________________________ Stanley, S. M., 2001. Wagreich, M., 1993. Wagreich, M., 1995.
Wagreich, M., and Decker, K., 2001.
Wagreich, M., and Krenmayr, H.-G., 2005.
Wagreich, M., Ilickovic, T., Popovic, A., Porpaczy, C., Stein-brener, J. and Wessely, G., 2011.
Wessely, G., 2006.
nd
Historische Geologie (2 Edition). Spek-trum Akademischer Verlag, Berlin. 710 pp.
Subcrustal tectonic erosion in orogenic belts - A model for the Late Cretaceous subsidence of the Nor-thenr Calcareous Alps (Austria). Geology, 21, 941-944.
Subduction tectonic erosion and Late Cre-taceous subsidence along the northern Austroalpine margin (Eastern Alps, Austria). Tectonophysics, 242, 63-78 pp.
Sedimentary tectonics and subsidence modelling of the type Upper Cretaceous Go-sau basin (Northern Calcareous Alps, Austria). International Journal of Earth Sciences, 90, 714-726 pp.
Upper Cretaceous oceanic red beds (CORB) in the Northern Calcareous Alps (Nierental Formation, Austria): slope topography and clastic input as primary controlling factors. Cretaceous Research 26, 57-64.
Biostratigraphy and sedi-mentology of Campanian deep-water sections (Nierental For-mation, Gosau Group) in Lower Austria. Austrian Journal of Earth Sciences, 104/2, 108-121.
Geologie der österreichischen Bundeslän-der - NieBundeslän-derösterreich. Geologische Bundesanstalt, Wien. 416 pp. _______________ _____ _____ _______________ _______________________ Received: 14 October 2011 Accepted: 21 November 2011 *)
Andrea SCHOBER & Ulrike EXNER
University of Vienna, Department of Geodynamics and Sedimentology, Althanstrasse 14, A-1090 Wien, Austria;
*)
_________________________ Corresponding author, [email protected]_________________