Quarrying MULTI COLOUR GRANITE (RED MULTI)
Category B2
Project Details
APPLICANT
Thiru P. Ganesan
S/o Perumal Gounder,
No.2/36, Gundalapatti Village,
Hale Dharmapuri-Post,
Dharmapuri District, Tamil Nadu.
Ph: +91 9486347681
CONSULTANT
SURIYA MINING SERVICES
(AN ISO 9001: 2008 Certified and
QCI/NABET Accredited Organization)
3/216, K.S.V, Nagar, Narasothipatti,
Alagapuram, Salem – 636004
Website: suriyamining.com
Email:
[email protected]
,
[email protected]
2016
EXTENT
:
3.44.5 Ha
S.F.NO :
59/2B, 59/3A (P), 59/3B, 60/2A & 3A
VILLAGE :
KARANDAPALLI
TALUK : DENKANIKOTTAI
DISTRICT : KRISHNAGIRI
1 ENVIRONMENTAL CLEARANCE SUMMARY
S.No Particulars Description
1. Name of the Owner/Firm Thiru P.Ganesan S/o Perumal Gounder OWNER
2. Location of the quarry- S.F.No. S.F.No. 59/2B, 59/3A(P),59/3B, 60/2A & 60/3A in Karandapalli Village, Denkanikottai Taluk,
Krishnagiri District, Tamil Nadu.
3. Purpose of Application Proposal for Environment Clearance for Quarrying MULTI COLOUR GRANITE (RED MULTI)
4. Extent of quarry in Ha- 3.44.5 Hectares 5. Modernization/New New
6. Ownership Patta land
7. Topo Sheet No. Topo Sheet No. : 57 H/11 8. Latitude / Longitude – DGPS (Co-ordinates) Pillar name Latitude (Global) Longitude (Global) Elevation (m) 1 N12°27'30.32437" E77°42'49.97812" 916.401 2 N12°27'33.38316" E77°42'50.14173" 915.060 3 N12°27'34.62034" E77°42'51.56148" 913.272 4 N12°27'38.15900" E77°42'49.25246" 904.985 5 N12°27'38.22072" E77°42'48.18542" 904.754 6 N12°27'40.70681" E77°42'48.05634" 892.473 7 N12°27'40.56659" E77°42'46.24304" 891.144 8 N12°27'39.33606" E77°42'46.20249" 895.460 9 N12°27'37.82389" E77°42'47.27176" 904.711 10 N12°27'36.12922" E77°42'48.50710" 907.003 11 N12°27'36.11625" E77°42'46.86662" 904.091 12 N12°27'33.57755" E77°42'48.75586" 912.239 13 N12°27'34.77661" E77°42'43.87888" 895.630 14 N12°27'32.65490" E77°42'46.06459" 902.439 15 N12°27'28.76649" E77°42'45.84802" 897.280
9. Topography of MSL area Coordinates ranges from 12º27’28.76649” to 12º27’40.70681” N and 77º42’45.84802” to
77º42’48.06634 E with elevation ranges 891.144m to 916.401m above MSL.
10. Land Use Pattern The area is comprised of red soil and outcrops of multi colour granite. Water table of the area is said to be fluctuated between 34-36m during a year in the adjacent tube well. The average thickness of top soil is 1-2m occur over granite deposit. 11 Method of Mining Open cast semi-mechanized mining using
Hydraulic excavator and tippers in combination 12 Production (quantity in m3) The Life of Mine at a rate of 1015 M3/year is
estimated as 37 years up to a depth of 21m bgl. Description Quantity
Geological reserves 59221 M3
2
13 Overburden/Waste Year Topsoil (M3) Overburden/ Waste (M3) Granite Rejects (M3) Total I 3417 --- 2030 5447 II --- --- 4061 4061 III --- --- 4061 4061 IV --- --- 4090 4090 V --- --- 4200 4200 Tota l 3417 --- 18442 21859
14 Life of Mine 37 years
15 Climatic condition Average Rainfall – 1000.8 mm Summer – 33°C to 40°C.
Winter – 15°C to 36°C.
16 Proposed Bench Dimensions Year Bench Length (m) Width (m) Height (m)
I I 47 9 6 II I 47 18 6 III I 47 18 6 IV I 27 16 6 II 35 12 6 V II 35 25 6
17 Water table 36 m below ground level 18 Water requirement Purpose Quantity
KLD Source Drinking and Utilities 1.0 Mineral water Industries Dust Suppression and Green belt
2.0 Wells of proponent site
Total 3.0 19 Nearby lake / river/ odai/ channel
etc.
No water bodies nearby. 20 Waste water No generation of waste water.
21 APC Measures Dust expected to be generated from hauling roads, place of excavation etc will be suppressed by periodical wetting of land by spraying.
22 Habitation The Karandapalli Population of 3678 people. Other villages are Kadisihalli i (3942), Padimandoddi (2976) and Malligarjunadurgam (1706).
3
23 Man power 40 employees 24 Ariel distance from Reserve forest,
Sensitive areas, Forest, Bird sanctuaries, Wild
life sanctuaries, National parks, Monuments etc., within 15km
Ulipanda Reserve forest is situated about 5Km on western side and Jowlagiri RF is located about 7km away. The Cauvery North Wildlife Sanctuary is located within 10kms radius.
Bird Sanctuaries – Nil Wild life sanctuaries - Nil Monuments – Nil
25 Interstate boundary The Interstate boundary is situated about 9kms from the proposed site on the western side. 26 Precise area statement Approved
by
The District Collector, Coimbatore in letter No. 14663/ MME.2/2015, dated 06.01.2016 27 Mining plan Prepared by
Approved by
S.SURIYAKUMAR, M.Sc., M.Phil (Geology). F.C.C. (Mining), PGDBA, DIPC (Industrial Pollution Control). RQP/MAS/013/87/A.
The Mining Plan approved by Commissioner of Geology & Mining, Guindy Lr.No.7359/MM5/2015 dated 22.01.2016
29 Environment Plan The land area likely to be degraded due to
quarrying, dumping, forming of haul roads etc. has clearly been indicated in the mine lay out plan 30 Total cost of the Project Project cost / investment : Rs. 138.75 Lakhs
Expenditure : Rs. 10.75 lakhs
1.0
SITE ANALYSIS
1.1 PHYSIOGRAPHY
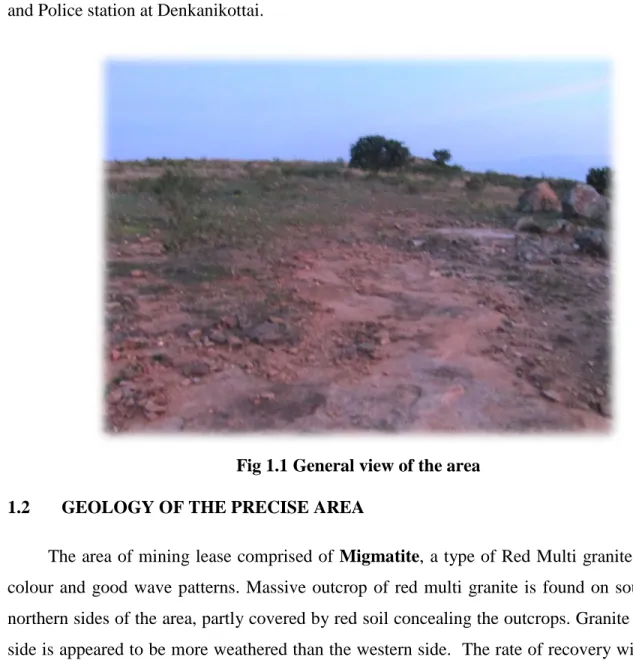
The area applied for mining lease is gently sloping ground due south. The outcrops of multi colour granite are outcrops well exposed on the northern side in proposed area and weathered partly on the eastern side and intermittent top soil capping. The area is surrounded by partly agricultural fields with maize, ground nuts etc. The surface features of the land are shown in the surface plan in Plate V. Water table is located at a depth of 36m from the surface in the neighbour tube wells. Temperature of the region is reported to be 28ºC to a max. of 40º C during summer. Rain fall of this area is about 900 mm during monsoons in a year. Regional crops are maize, ground nuts etc. No other area of public interest is found in the vicinity. Nearest Rail head
4
is located about 25 kms from the site in Kelamangalam. Post office is available at Padiganalam and Police station at Denkanikottai.
Fig 1.1 General view of the area 1.2 GEOLOGY OF THE PRECISE AREA
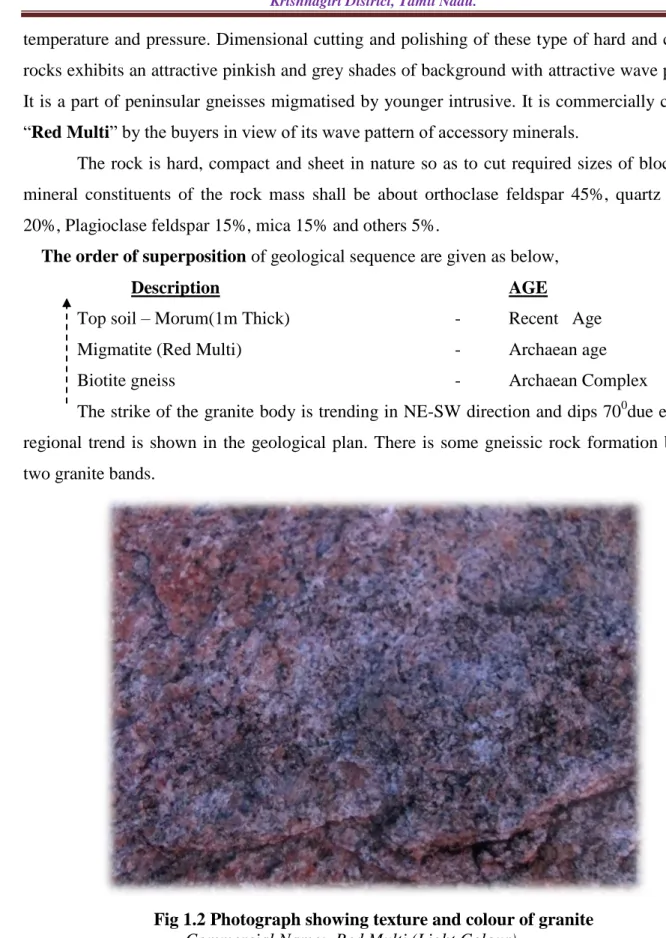
The area of mining lease comprised of Migmatite, a type of Red Multi granite with light colour and good wave patterns. Massive outcrop of red multi granite is found on southern and northern sides of the area, partly covered by red soil concealing the outcrops. Granite on eastern side is appeared to be more weathered than the western side. The rate of recovery will be more on western side than eastern side. Average rate of recovery is taken as 20% based on filed geological and structural aspects.
The mineral constituents are biotite, quartz, orthoclase feldspar and less plagioclase feldspar. The biotite is fine grained and other minerals are medium grained. The graphic texture and intergrowth of quartz and feldspar indicates that younger intrusive were invaded into the pre-existing country rock, which preferably would have been a biotite gneisses (Peninsular Gneisses). Xenolith of schistose rock are also found along the contact of granite band. Therefore, it is clear from the regional flow structure and texture of Xenolith, the rock would be a type of
5
temperature and pressure. Dimensional cutting and polishing of these type of hard and compact rocks exhibits an attractive pinkish and grey shades of background with attractive wave patterns. It is a part of peninsular gneisses migmatised by younger intrusive. It is commercially called as “Red Multi” by the buyers in view of its wave pattern of accessory minerals.
The rock is hard, compact and sheet in nature so as to cut required sizes of blocks. The mineral constituents of the rock mass shall be about orthoclase feldspar 45%, quartz roughly 20%, Plagioclase feldspar 15%, mica 15% and others 5%.
The order of superposition of geological sequence are given as below,
Description AGE
Top soil – Morum(1m Thick) - Recent Age
Migmatite (Red Multi) - Archaean age
Biotite gneiss - Archaean Complex
The strike of the granite body is trending in NE-SW direction and dips 700due east. The regional trend is shown in the geological plan. There is some gneissic rock formation between two granite bands.
Fig 1.2 Photograph showing texture and colour of granite
6 1.3CLIMATIC CONDITIONS
1.3.1 RAINFALL
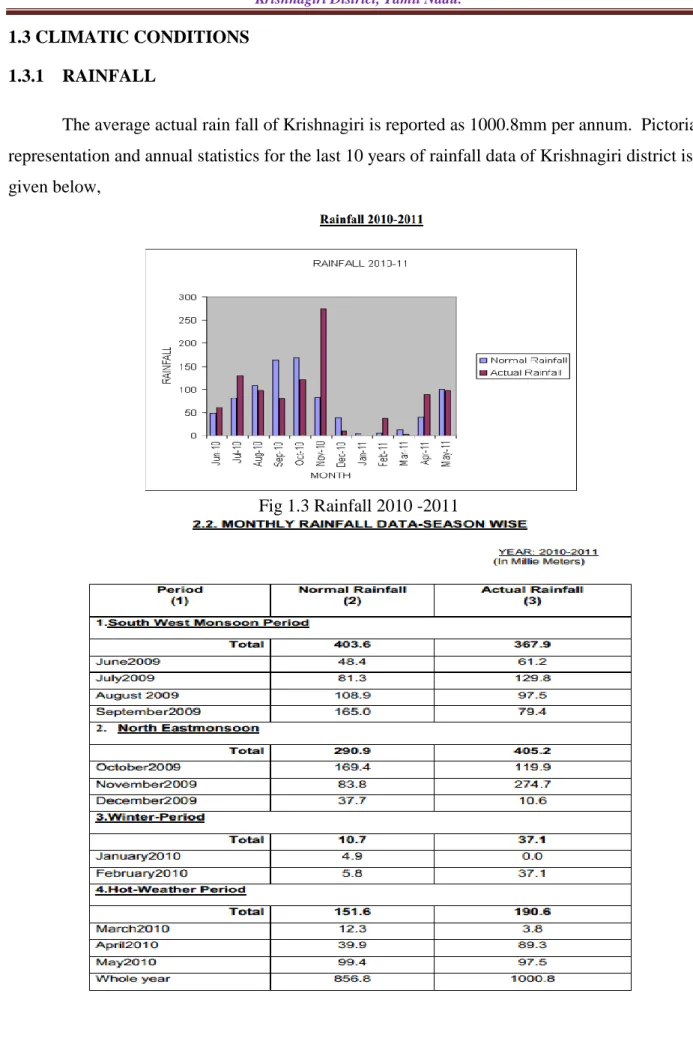
The average actual rain fall of Krishnagiri is reported as 1000.8mm per annum. Pictorial representation and annual statistics for the last 10 years of rainfall data of Krishnagiri district is given below,
7 1.3.2 TEMPERATURE
Throughout the month of May daytime temperatures will generally reach highs of around 33°C that's about 91°F. At night the average minimum temperature drops down to around 22°C, that's 71°F. In recent times the highest recorded temperature in May has been 38°C that's 101°F, with the lowest recorded temperature 15°C, about 60°F.
1.3.3 RELATIVE HUMIDITY
The average daily relative humidity for May is around 64%.
1.3.4 HEAT INDEX
The Heat Index is a measure of how hot it feels when relative humidity is added to actual air temperature. From this a comfort level is calculated providing categories on how heat conditions might adversely affect someone.
1.3.4.1 COMFORT LEVELS
Given average maximum temperatures and humidity levels you can expect dangerous heat conditions. Sunstroke, muscle cramps and heat exhaustion are likely. Heatstroke is possible with prolonged exposure and/or physical activity (see heat index for more information).
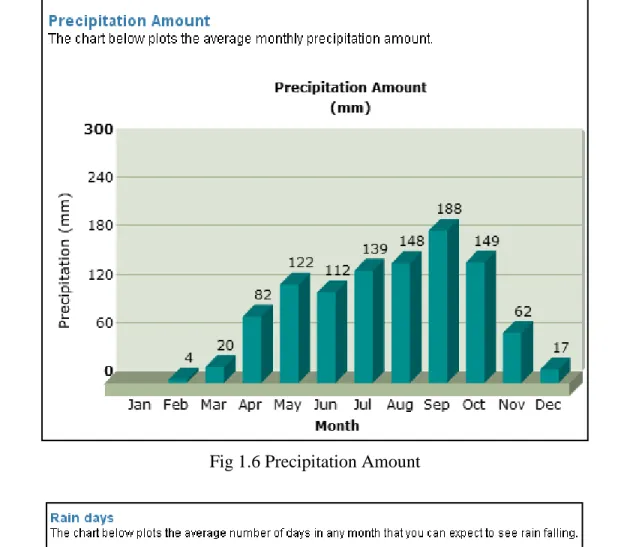
1.3.5 PRECIPITATION
The average monthly amount of precipitation has been recorded at around 122 mm, that's 5 inches. Throughout the month you can expect to see rain or drizzle falling on 10 days of the month.
1.3.6 WIND
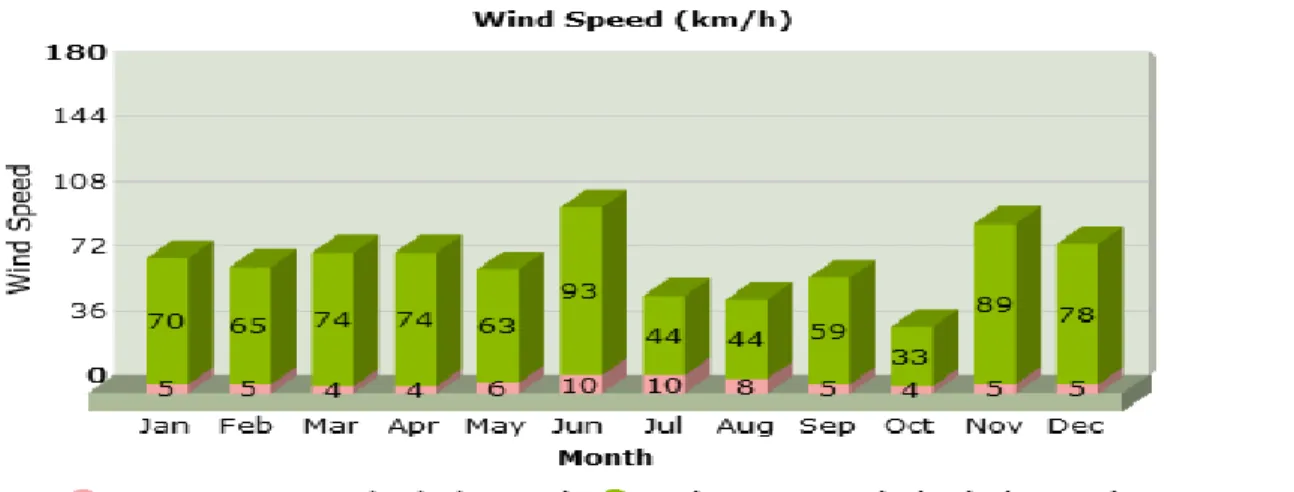
The average daily wind speed in May has been around 6 km/h, that’s the equivalent to about 4 mph, or 3 knots. In recent years the maximum sustained wind speed has reached 63 km/h, that’s the equivalent of around 39 mph, or 34 knots.
8 1.3.7 YEARLY TRENDS: WEATHER AVERAGES & EXTREMES
The following charts show yearly weather trends with information on monthly weather averages and extremes.
1.3.7.1 TEMPERATURE
The chart below plots the average high and low temperature for each month of the year. It also shows the maximum and minimum recorded temperatures.
Fig 1.4 Average Daily Wind Speed
9
Fig 1.6 Precipitation Amount
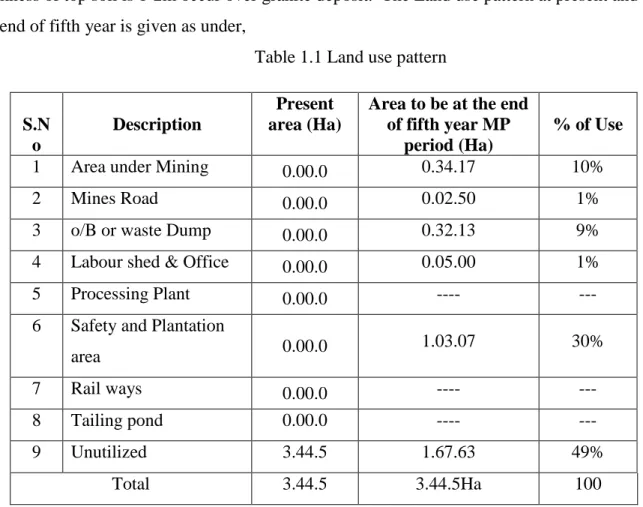
10 1.4 Land use Pattern
The area is comprised of red soil and outcrops of multi colour granite. Water table of the area is said to be fluctuated between 34-36m during a year in the adjacent tube well. The average thickness of top soil is 1-2m occur over granite deposit. The Land use pattern at present and at the end of fifth year is given as under,
Table 1.1 Land use pattern
1.5 WATER ENVIRONMENT
There is Major River found around 5Kms radius. There is no seasonal track and water bodies are located around 500m radius. Water table is located at a depth of 36m and fluctuating between 34-36m in a year where as mining is planned up to a maximum depth of 21m only. Therefore pumping of ground water or surface water does not arise in this mine. A water sample from the open well adjacent to the mine was sent to lab to assess hardness, salinity, colour, specific gravity, PH, turbidity, COD, BOD, fluorine etc…
S.N o
Description
Present area (Ha)
Area to be at the end of fifth year MP
period (Ha)
% of Use
1 Area under Mining 0.00.0 0.34.17 10%
2 Mines Road 0.00.0 0.02.50 1%
3 o/B or waste Dump 0.00.0 0.32.13 9%
4 Labour shed & Office 0.00.0 0.05.00 1%
5 Processing Plant 0.00.0 ---- ---
6 Safety and Plantation
area 0.00.0 1.03.07 30%
7 Rail ways 0.00.0 ----
---8 Tailing pond 0.00.0 ---- ---
9 Unutilized 3.44.5 1.67.63 49%
11 1.6 AIR ENVIRONMENT
As no mining activity is carried out, no dust rise is observed. Dust fall data may be taken from the district observation for threshold values. Base line information on ambient air quality, noise and water has to be collected to test SPM, S02, N0x and C0 both in Core and Buffer Zones.
1.7 NOISE AND VIBRATION
Threshold sound level is reported as 60dB. Noise level has to be studied prior to mining and after opening the quarry for production. Vibration may be negligible due to absence of heavy deep hole blasting.
No activity to test vibration of longitudinal waves and its peak particle velocity.
1.8 FLORA AND FAUNA
Flora as observed and identified in the field are covered by photograph and shown below. Mostly Palm tree, Tamarind, Neem trees, Pungai trees are found more on regional scale. The Proponent has developed trees like Teak, Mango, Tamarind etc with proper nursery garden and plantation on vacant land.
Flora is represented by herbs and shrubs of local species. Fauna is represented by rabbits, rat, scorpion, millipedes etc.
Trees and their botanical terms are given below with numbers
1.8.1 TREES S. No.
Name of trees
Botanical Name Number Remarks
1 Tamarind Tmarindus indicus 2 Growing well
2 Pala Artocarpus integrifolia 3 Growing well
3 palai Mimusops herandra 2 -
4 Pungai Pongamia glabra vent 3 -
5 Moongil Bambusa aurandinacea retz 1 -
12 1.8.2 SHRUBS
S. No. Local Name Botanical Name
1 Korai Elacocarpus aerratas
2 Erukku Calotrophis gigantean
3 indumul Pterolobium indicum
4 thulasi Ocimum santum
1.8.3 HERBS
S. No. Local Name Botanical Name
1 Poolai poondu Aerva lanata
2 Thumbai Calotrophis gigantean
3 Peru Neruji Pedalium murex
4 Kantangkathri Solanum xanthocarpu,
5 Nerunji Tribulus terrestris
1.8.4 LIST OF CULTIVATES CROPS IN THE CORE ZONE (500m) S. No.
BINOMIAL ENGLISH NAME TAMIL NAME
1 Cocos nucifera Coconut Thennai
2 Teak Tectona grandis Tekku
3 Casurina casuarina equisetifolia Savukku
1.9 SOCIO-ECONOMIC ENVIRONMENT
1.9.1 INTRODUCTION
This section of the EIA report deals with Socio-Economic Impact assessment of the proposed Mining Project promoted by Thiru.P. Ganesan, Denkanikottai taluk at Karandapalli village, Sub-district Denkanikottai, District Krishnagiri, Tamilnadu.
The objects of the socio-economic impact assessment are as follows:
a) To study the socio-economic status of the people living in the study area of the proposed mining project.
13 1.9.2 METHODOLOGY
The methodology adopted for impact assessment is as follows:
a) The details of the activities and population structure have been obtained from Census 2001 and 2011 and analyzed.
b) On the basis of a preliminary reconnaissance survey, two questionnaires were developed to make it suitable to fulfill the objectives of the study.
c) Based on the above data, impacts due to mining operation on the community have been assessed and recommendations for further improvement have been made.
1.9.3 RURAL POPULATION CHARACTERISTICS - DENKANIKOTTAI TALUK
Krishnagiri district in Denkanikottai Taluk had a population of 347474 persons in 2011 provisional census. There were about 178989 men (51.51%) according to 2011 census and 168485 women (48.49%) in census 2011.
In Denkanikottai Taluk had a total household 57781 in 2001 which is increased 70781 in according to census 2011. Rural population of 309901 in 2011 census previous census 279430 persons in 2001. There were about 159980 men according to 2011 census and 143780 men in 2001 census marking an increase of 16200 men over the previous census. During 2001 there were about 135650 women (48.55 %), which increased to 149921 (48.38 %) in 2011 census.
Rural literate accounted for 120109 persons (42.98 %) in 2001 and increased to 164783 persons (53.17 %) in 2011. There were about 51.91 percent males in 2001 and 60.09 percent in 2011. There were about 45468 (33.52 %) females increased to 68656 (45.79 %) classes as rural literates during year of 2011.
The average sex ratio in Denkanikottai rural was 943.5 during 2001 and decreased in 937.1 the year of 2011. The lower sex ratio may be either due to the migrants for educational purpose and employment opportunities.
14 Table No.1.3 Rural Population Characteristics - Denkanikottai Taluk, Krishnagiri District
(2001-2011) S.no Characteristics 2001 % 2011 % 1 Rural Household 57781 70781 2 Rural Population 279430 309901 3 Male Population 143780 51.45 159980 51.62 4 Female Population 135650 48.55 149921 48.38
5 Rural Total_ Literacy 120109 42.98 164783 53.17
6 Male Literacy 74641 51.91 96127 60.09
7 Female Literacy 45468 33.52 68656 45.79
8 Sex Ratio 943.5 937.1
15 1.9.4 RURAL OCCUPATIONAL CHARACTERISTICS –DENKANIKOTTAI TALUK
The term workers denote the population engaged in primary, secondary and tertiary activities classified in the census reports of Indian government. During the year 2001 Denkanikottai Taluk had 141967 workers accounting for 50.81 percent of the total rural population of the district. During 2011 there were about 162795 (52.53 %) according to the census. There were about 85148 men (59.22 %) during 2001 which is increased 98162 persons (61.36 %) according to census 2011. There were about 56819 female according to 2001 which is increased 64633 female during 2011 marking an increase of 7814women over the previous census.
In Denkanikottai Taluk had a rural total main workers accounted of 114136 persons during 2001 census which is increased 137529 persons during 2011. There were about 38328 (28.26 %) women in 2001 and 51151 (34.12 %) women according to the census 2011 marking an increase of 12823 women over the previous census.
Study on occupation characteristics of population should analyze the workforce engaged in different type of occupation. Cultivators are the major category of occupation representing the workforce owning land. Denkanikottai Taluk had rural total cultivators 71577 (50.42 % of the total workers) cultivators. The proportion of cultivators to total workers is calculated as a percent for the two census years 2001 and 2011 for the taluk of Denkanikottai in Krishnagiri district. There were about 48865 (57.39 %) men in 2001 which is increase 49031 (49.95 %) according to census 2011. Denkanikottai taluk had female cultivators 22712 (39.97 % of the rural female workers) cultivators during 2001 census which is increased 27157 (42.02 %) during according to census 2011.
The distribution of agricultural laborers in the study area for the two census periods has revealed that the study area has experienced a decline in the proportion of workers classed as agricultural laborers between 2001 and 2011. Denkanikottai taluk had rural agricultural labourers 23185 (16.33 % of the total workers) agricultural labourers. There were about 13015 (15.29% of rural male workers) men in 2001 which is increase 17848 (18.18 % of rural male workers) according to census years 2011. Denkanikottai taluk had female agricultural laborer increased census 2011 compare to the previous year.
16
This group includes the employment of workers in manufacturing activities. Agro based industries, textile based industries, Horticulture, chemical based industries, and engineering industries located in the study area engages a sizeable amount of workers. The distribution of secondary workers in the study area is calculated as percent to the total workers. The proportion of secondary workers to total workers has experienced decreasing trend in the denkanikottai taluk area between 2001 and 2011. Secondary workers during 2001 and 2011 it could be stated that this may be due to the opening of a number of manufacturing units in the study area.
The tertiary workers include the labour force engaged in service sector such as education, medical, judicial, finance, administration, recreation, trade and commerce and transport. In Denkanikottai taluk tertiary workers accounted for about 11.43 percent of the workers during 2001 census it is increased 14.82% according to census 2011.
The study area has experienced a change in the occupational structure in the form of a decline in the proportion of cultivators, agricultural laborers and an increase in the proportion of secondary workers and tertiary workers.
TableNo.1.4 Rural Occupational Characteristics of Population -Denkanikottai Taluk, Krishnagiri District (2001-2011)
S.no Characteristics 2001 % 2011 %
1 Rural population 279430 309901
2 Male population 143780 51.45 159980 51.62
3 Female population 135650 48.55 149921 48.38
4 Rural total workers 141967 50.81 162795 52.53
5 Male workers 85148 59.22 98162 61.36
6 Female workers 56819 41.89 64633 43.11
7 Rural total main workers 114136 40.85 137529 44.38
8 Male main workers 75808 52.72 86378 53.99
9 Female main workers 38328 28.26 51151 34.12
10 Rural total cultivators 71577 50.42 76188 46.80
10 Male cultivators 48865 57.39 49031 49.95
11 Female cultivators 22712 39.97 27157 42.02
12 Rural main agricultural labourers 23185 16.33 34809 21.38
13 Male agri.labourers 13015 15.29 17848 18.18
14 Female agri.labourers 10170 17.90 16961 26.24
17
16 Male HHI 1222 1.44 1076 1.10
17 Female HHI 1926 3.39 1335 2.07
18 Rural main other tertiary workers 16226 11.43 24121 14.82
19 Male other workers 12706 14.92 18423 18.77
20 Female other workers 3520 6.20 5698 8.82
21 Rural nonworkers 137463 49.19 147106 47.47
22 Male nonworkers 58632 40.78 61818 38.64
23 Female non workers 78831 58.11 85288 56.89
Fig.No.1.9
1.9.5 POPULATION CHARACTERISTICS - DENKANIKOTTAI TALUK
Krishnagiri district in Denkanikottai taluk had a population of 347474 persons in 2011 provisional census. There were about 178989 men (51.51%) according to 2011 census and 168485 women (48.49%) in census 2011.
In Denkanikottai taluk had a total household 63846 in 2001 which is increased 79272 in according to census 2011. Person of 347474 in 2011 census previous census 309810 persons in
18
2001. There were about 178989 men according to 2011 census and 159404 men in 2001 census marking an increase of 19585 men over the previous census. During 2001 there were about 150406 women (48.55%), which increased to 168485 (48.49%) in 2011 census. Literate accounted for 138422 persons (44.68%) in 2001 and increased to 189982 persons (54.68%) in 2011. There were about 53.36 percent males in 2001 and 61.33 percent in 2011. There were about 53365 (35.48%) females increased to 80202 (47.60%) classes as literates in 2011.
Sex composition is the most important demographic characteristic that affects the incidence of birth and death. Sex ratio is defined as the number of females per thousand males. It is an important social indicator to measure the extent of prevailing equity between males and females in a society at a given point of time.
The average sex ratio in Denkanikottai taluk was 943.6 during 2001 and decreased in 941.3 the year of 2011. The lower sex ratio may be either due to the migrants for educational purpose and employment opportunities.
Table No. 1.5 Population Characteristics - Denkanikottai Taluk, Krishnagiri District (2001-2011) S.no Characteristics 2001 % 2011 % 1 Total Household 63846 79272 2 Total Population 309810 347474 3 Male Population 159404 51.45 178989 51.51 4 Female Population 150406 48.55 168485 48.49 5 Total Literacy 138422 44.68 189982 54.68 6 Male Literacy 85057 53.36 109780 61.33 7 Female Literacy 53365 35.48 80202 47.60 8 Sex Ratio 943.6 941.3
19 Fig No.1.10
1.9.6 POPULATION CHARACTERISTICS-KARANDAPALLI VILLAGE
In Denkanikottai taluk, Karandapalli village had a total household 784 in 2001 which is increased 863 in according to census 2011. Village had a total person of 3678 in 2011 census previous census 3874 persons in 2001. There were about 1934 men according to 2011 census and 2006 men in 2001 census marking a decrease of 72 men over the previous census. During 2001 there were about 1868 women (48.22%), which is decreased to 1744 (47.42%) in 2011 census.
Karandapalli village had a literate accounted for 1512 persons (39.03 %) in 2001 and increased to 1806 persons (49.10 %) in 2011. There were about 50.50 percent males in 2001 and 59.20 percent in 2011. There were about 499 (26.71 %) females increased to 661 (37.90%) classes as literates in 2011.
Sex composition is the most important demographic characteristic that affects the incidence of birth and death. The average sex ratio in Denkanikottai taluk, Karandapalli village was 931 census of 2001 and decreased in 901 due to census of 2011. The lower sex ratio may be either due to the migrants for educational purpose and employment opportunities and due to low infant of female of this area.
20 Table No. 1.6 Population Characteristics-Karandapalli Village, Denkanikottai Taluk,
Krishnagiri District (2001-2011) S.no Characteristics 2001 % 2011 % 1 Total Household 784 863 2 Total Population 3874 3678 3 Male Population 2006 51.78 1934 52.58 4 Female Population 1868 48.22 1744 47.42 5 Total Literacy 1512 39.03 1806 49.10 6 Male Literacy 1013 50.50 1145 59.20 7 Female Literacy 499 26.71 661 37.90 8 Sex Ratio 931.2 901.8 Fig No.1.11
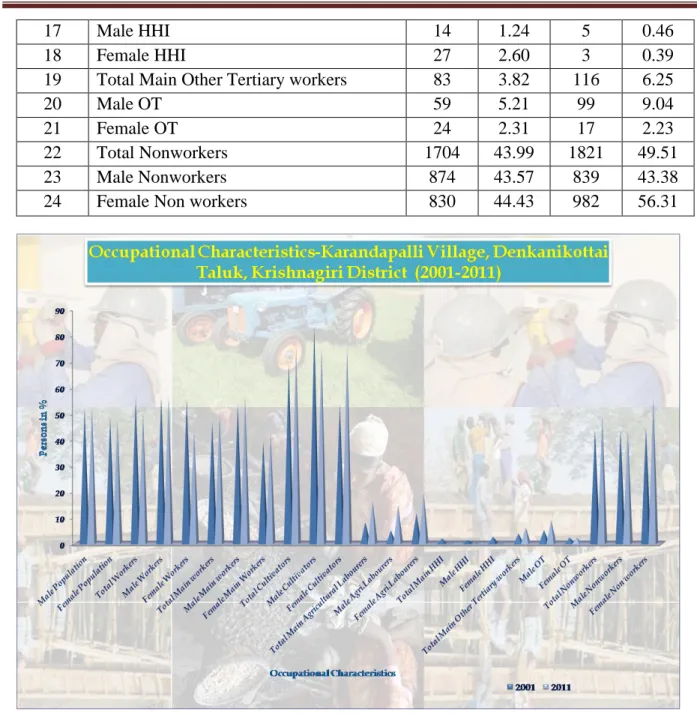
1.9.7 OCCUPATIONAL CHARACTERISTICS- KARANDAPALLI VILLAGE
The term workers denote the population engaged in primary, secondary and tertiary activities classified in the census reports of Indian government. During the year 2001 Karandapalli village had 2170 workers accounting for 56.01 percent of the total population of the Village. During 2011 there were about 1857 (50.49 %) according to the census. There were
21
about 1132 men (56.43 %) during 2001 which is decreased to 1095 persons (56.62 %) according to census 2011. There were about 1038 female according to 2001 which is decreased 762 female during 2011 marking a decrease of 276 women over the previous census.
In Karandapalli village had a total main workers accounted of 1806 (46.62 %) persons during 2001 census which is increased 1836 (49.92) persons during census 2011. There were about 733 (39.24%) women in 2001 and 746 (42.78%) women according to the census 2011 marking an increase of 13 women over the previous census.
Study on occupation characteristics of population should analyze the workforce engaged in different type of occupation. Cultivators are the major category of occupation representing the workforce owning land. Karandapalli village had total cultivators 1504 (69.31% of the total workers) cultivators census of 2001. The proportion of cultivators to total workers is calculated as a percent for the two census years 2001 and 2011 for the taluk of denkanikottai in Karandapalli village. There were about 943 (83.30%) men in 2001 which is decreased about 825 (75.34 %) according to census 2011. Karandapalli village had female cultivators 561 (54.05 % of the female workers) cultivators during 2001 census which is increased 577 (75.72%) during according to census 2011.
The distribution of agricultural laborers in the study area for the two census periods has revealed that the study area has experienced a decline in the proportion of workers classed as agricultural laborers between 2001 and 2011. Denkanikottai taluk in Karandapalli village had agricultural labourers 310 (16.69% of the total workers) agricultural labourers. There were about 57 (5.04% of male workers) men in 2001 which is increase about 161(14.70 % of male workers) according to census years 2011. Karandapalli village had female agricultural labourer increase about (19.55%) census 2011 compare to the previous census year 2001.
This group includes the employment of workers in manufacturing activities. Agro based industries, located in the study area engages a sizeable amount of workers. The distribution of secondary workers in the study area is calculated as percent to the total workers. The proportion of secondary workers to total workers has experienced decreasing trend in the Karandapalli village area between 2001 and 2011. Secondary workers during 2001 and 2011 it could be stated that this may be due to the opening of a number of manufacturing units in the study area.
22
The tertiary workers include the labour force engaged in service sector such as education, medical, judicial, finance, administration, recreation, trade and commerce and transport. In Karandapalli village had tertiary workers accounted for about 3.82 percent of the workers during 2001 census which is increase about 6.25 % according to census 2011. There were about male tertiary workers of 59 (5.21 % of the male workers which is increase 99 (9.04% of the male workers) according to census 2011. 24 women tertiary workers (2.31% of the female workers) during 2001. which is decreased about 17 (2.23% of the female workers) according to census 2011.
The study area has experienced a change in the occupational structure in the form of a decline in the proportion of cultivators, agricultural laborers and an increase in the proportion of secondary workers and tertiary workers.
After development of mine from this area, not only provide employment opportunities but also the industrial culture and civilization to the village people. Beneficiary villages are Thattapalli Madura Kadichipalli/Karandapalli etc..
Table No.1.7 Occupational Characteristics of Population -Karandapalli Village, Denkanikottai Taluk, Krishnagiri District (2001-2011)
Sno Characteristics 2001 % 2011 % 1 Total Population 3874 3678 2 Male Population 2006 51.78 1934 52.58 3 Female Population 1868 48.22 1744 47.42 4 Total Workers 2170 56.01 1857 50.49 5 Male Workers 1132 56.43 1095 56.62 6 Female Workers 1038 55.57 762 43.69
7 Total Main workers 1806 46.62 1836 49.92
8 Male Main workers 1073 53.49 1090 56.36
9 Female Main Workers 733 39.24 746 42.78
10 Total Cultivators 1504 69.31 1402 75.50
11 Male Cultivators 943 83.30 825 75.34
12 Female Cultivators 561 54.05 577 75.72
13 Total Main Agricultural Labourers 178 8.20 310 16.69
14 Male Agri.Labourers 57 5.04 161 14.70
15 Female Agri.Labourers 121 11.66 149 19.55
23
17 Male HHI 14 1.24 5 0.46
18 Female HHI 27 2.60 3 0.39
19 Total Main Other Tertiary workers 83 3.82 116 6.25
20 Male OT 59 5.21 99 9.04
21 Female OT 24 2.31 17 2.23
22 Total Nonworkers 1704 43.99 1821 49.51
23 Male Nonworkers 874 43.57 839 43.38
24 Female Non workers 830 44.43 982 56.31
Fig No.1.12 1.9.8 AMENITIES- KARANDAPALLI VILLAGE 1.9.8.1 EDUCATIONAL FACILITIES
All the villages in the study area are provided with minimum educational facility. There are one primary or elementary school at Palathottanapalli village in the study area. However, there is no senior secondary school, Industrial/Training school and college in the study area. For higher education people have to rush to other towns.
24 1.9.8.2 HEALTH FACILITIES
The Primary health care centre is located in Palathottanapalli village distance about 5 km. Study area of the proposed Multi mineral Granite project is very lacking in medical facilities in this area. There is no hospital any type. The field investigation has revealed that during emergency one rush to district hospital at Krishnagiri. Deep probe made during the field survey has revealed that the health institutions located in the study area are not fully equipped due to paucity of man power, medicines, equipment and ambulances.
1.9.8.3 DRINKING WATER
Drinking water is available in all the villages of the study area. The various sources of drinking water are taps, wells, tanks, hand pumps and rivers.
1.9.8.4 ELECTRICITY
All the villages in the study area are provided with electricity and the same is available for domestic use, agricultural use and industrial use.
1.9.8.5 ROADS
Paved roads are available in eight villages. Where paved roads are not there mud roads are there. They are connected by mud roads only. In the mining lease area there is a paved road.
1.9.8.6 OTHER FACILITIES
Other facilities available in the study area are Post offices available in Padiganalam 3km from the mining area. Further, fire station is near denkanikottai and police station is nearest mining area and nearest railway station taluk of denkanikottai. Bus services are available in 11 above villages.
It is suggested that the project authority may take up the following community development activities in order to uplift the socio-economic conditions of the people in the impact area:
1) Construction of paved roads where mud roads are still in existence. 2) Setting up of an occupational training center at Karanadapalli
25
4) Setting of dispensaries or mobile medical units for providing medical aid to villagers. 5) Protected water supply in villages where drinking water supply is inadequate.
6) Village development by adopting selected villages.
1.9.9 CONCLUSIONS
With the setting up of the proposed mining project the occupational pattern of the people in the study area will change making more people engaged in mining and business activities. This will reduce occupational dependence of people on agriculture. In this study area are the facilities like education up to 10+2 level, health, housing, drinking water, road etc are far from satisfactory. It is expected that same will improve to a great extent due to intervention of the project proponent.
1.10 HUMAN SETTLEMENT
The following villages are found in the buffer zone with population as per 2011 census. The Karandaplli Population of 3678 peoples of both male (1934) and female (1744).
Name of Village Direction Distance from
Mines Population (Approx) Kadishalli North 1 3942 Padimandoddi South 1.5 2976 Malligarjunadurgam East 1 1706 Karandapalli West 1 3678
26 2. Environmental Impact Assessment (EIA) / Environment Management Plan (EMP)
There would not be any adverse impact in the existing environment arising from this mining activity.
2.1 AIR ENVIRONMENT
There is no gaseous matter to be generated in this mine. Dust generation during drilling of shot holes, haul road, smoke from vehicles shall be controlled as given below,
i) Dust extractor or wet drilling to be followed to control dust at source of emission during drilling,
ii) Emission level in all machineries and transport vehicles to be tested once in a year to keep them in control with proper maintenance and service as per TNPCB Standards, iii) Water sprinklers along the sides of haul road shall be fixed to control fly of dust while
transporting minerals and waste,
iv) Avenue trees along roads and green belt around ML boundary shall be planted with density of 1500 trees per Hectare as per the norms of MoEF to control fly of dust, noise etc,
v) In above all, labours engaged in such dust prone areas should be provided with safety devices like ear muff, mask, goggles etc as per the MMR, 1961 amendments and circulars of DGMS under the provisions of occupational diseases.
vi) Labours may be permitted officially to undergo medical checkup to test silicosis and other respiratory check up once in 5 years
And other guidance required under these laws should be strictly adopted.
2.2 WATER ENVIRONMENT
There is surface body of water available within the ML area. Ground water table is located at a depth of 36m and fluctuating between 34-36m in a year where as mining is planned up to a maximum depth of 21m only. Therefore pumping of ground water or surface water does not arise in this mine.
The turbid rain water during rainy season is proposed to settle in a pit before discharging in to the natural stream for settling the suspended particles. No other EMP required for water quality management.
27
The water to be pumped from the quarry shall be treated in sump containing Sand filters before discharging into natural drainage. Granite sheet extraction will not produce any waste which pollutes the ground water. Drinking water to mine labour will be supplied from public source or bore well to be drilled by the applicant.
The rain should be collected by garland drainage around the Lease boundary or pit and to allow settling in a small pit for settling suspended particles before passing to natural drainage system.
2.3 NOISE AND VIBRATION
Generation of noise from blasting shall be controlled by delay arrangements in blasting and use of proper quantity of explosives and strength. Protective devices shall be provided for use of persons employed in the vicinity. Wherever the noise level is found in excess of the stipulated limits (85db), necessary protective devices like ear plug, mask will be provided to the employees exposed to such noisy and dusty conditions.
No deep hole blasting is adopted and only small dia explosives are used for breaking the hard rock and boulders. Where ever necessary muffle blasting shall be followed to control fly rocks from blasting.
2.4 TOP SOIL MANAGEMENT
Top soil is a precious product of the earth which normally forms from the rocks by weathering by millions of years of exposures to the atmosphere with aid of oxygen and water. These top soil causes for development of amino acids and genesis of plant kingdom. Therefore, the top soil should be removed separately before developing the face for granite and waste benches. The top soil should be dumped along the Lease boundary for dump afforestation and use of agricultural purposes. Top soil should not be mixed with other waste or reject materials. It should be conserved by judicious utilization in the mine premises.
28 2.5 PROPOSAL FOR RECLAMATION LAND AFFECTED BY MINING ACTIVITIES DURING AND AT THE END MINING LEASE PERIOD
The depth of granite deposit is not known. However for economical planning, the average depth is taken as 21m from the surface. Immediate reclamation of land does not rise for this deposit. However it pit will be used for miscellaneous purposes like fish pond, rain water storage etc., after completion of mining. All waste and reject materials will be dumped as per the mining plan.
2.6 STABILIZATION AND VEGETATION OF DUMPS
The materials to be dumped shall be very hard in nature and it does not require any grading separately. The materials like rough stone rejects shall be graded automatically during dumping by Excavator and tipper combinations. Part of top soil will be spread over the Non-active dumps along the slope and edges to plant tree sapling to form vegetal cover over the dumps. Such vegetal cover will prevent erosion of dumps during rainy seasons.
2.7 SOCIO-ECONOMIC BENEFITS ARISING OUT OF MINING
The mine area does not cover any habitation. Hence the mining activity does not involve any displacement of human settlement. No public buildings, places, monuments etc exist within the lease area or in the surrounding area. The mining operation will not disturb/ relocate any village or need resettlement. Thus no adverse impact is anticipated. The impact of mining activity in the area is positive on the socio-economic environment of the region. Karandapalli village in Multi colour Granite Mine is providing employment to local population and it will be give preference to the local people whenever there is requirement of man power.
2.7.1 GENERAL
The coming of the project will bring overall improvement in the locality, neighborhood and the state by bringing industry, roads, water supply, electricity, employment, living standard and economic growth.
29 2.7.2 EMPLOYMENT
The socio-economic conditions of the surrounding villages are poor as there is no significant source of earning. The occupational activities are agriculture, cattle rearing and employment in mines but on daily wages. The mining activity will provide employment to local people which will increase socio economic status of the area.
2.7.3 IMPROVEMENTS IN PHYSICAL AND SOCIAL INFRASTRUCTURE
The opening of the proposed project will enhance the socio-economic activities in the adjoining areas. This will result in following benefits:-
Improvements in physical infrastructure.
Improvements in Social Infrastructure.
Increase in Employment Potential
Contribution to the Exchequer.
Prevention of illegal mining.
During and Post-mining enhancement of green cover.
2.8PROPOSAL FOR WASTE MANAGEMENT
The waste to be generated shall be debris of portable size hard rock without any clay soil and connate water and therefore collapse of dumps is not possible for this mine. The waste\Rejects shall be dumped over the safety Zone and barren area as Plate –VI-VIII. Dump quantity at the end of 5th year and at the end of Life of Mine are given as below,
Description End of 5th Year End of Life of Mine
Topsoil Earth bund for plantation
purpose.
Earth bund for plantation purpose.
Reject 18442M3 148962M3
30
All the rejects shall be dumped along western side of the lease area temporarily and back filled over the mined out area in future. Small pieces of granite shall be used for tile and monument industries. Huge gang saw size blocks shall be used for making slabs etc as well as for exports.
2.9TAILING DAM MANAGEMENT
No ground water discharge or slurry from the mine and thereby no tailing or settling tank required for this mine except a small pit for decanting the slurry water.
2.10 PROGRAMME OF AFFORESTATION
Regional trees like Teak, Tamarind and Mango etc will be planted along the Lease boundary and avenues as well as over Non-active dumps at a rate of 60 trees per annum with interval 5m in between. The rate of survival expected to be 80% in this area. Land use and Afforestation Plan is given PlateX. The program of tree planting is given below
Year Place Types of Trees Number Rate of
Survival
I Lease Boundary & Dump Teak, Mango, Tamarind and
other regional trees. etc, 60 80 %
II Lease Boundary & Dump Teak, Mango, Tamarind and
other regional trees. etc, 60 80 %
III Lease Boundary & Dump Teak, Mango, Tamarind and
other regional trees. etc, 60 80 %
IV Lease Boundary & Dump Teak, Mango, Tamarind and
other regional trees. etc, 60 80 %
V Lease Boundary & Dump Teak, Mango, Tamarind and
31 3.0PROJECT COST
3.1Proposed financial estimate / budget for (EMP) Environment Management a) Project cost / investment
i) Land Cost : Rs 15,00,000
ii) Machinery to be used : Rs 121,00,000
iii) Refilling / Fencing : Rs 75,000
iv) Labourers Shed : Rs 75,000
v) Sanitary facility : Rs 50,000
vi) Other items : Rs 75,000
Total Rs 138.75 lakhs
b) Expenditure
i) Drinking water facility for the labourers = Rs 75,000 ii) Sanitary arrangement = Rs 70,000 iii) Safety kits, = Rs 75,000 iv) Dust control = Rs 75,000 v) Afforestation etc. = Rs 3,80,000
vi) Social responsibility = Rs 4,00,000
Total = Rs 10.75 lakhs
Signature of the Applicant Signature of RQP/ EIA Coordinator (Mining)
SURIYA MINING SERVICES, SALEM