Health Insurance for the Aged: Participating
Home Health Agencies
by DAVID ALLEN*
THE 1965 AMENDMENTS to the Social Se- curity Act established a comprehensive program of health insurance for the aged (Medicare). Re- imbursement for home health services rendered under the auspices of organized home health agencies is one of the covered benefits. The pro- gram helps meet the cost of part-time or inter- mittent nursing care and related services furnished by visiting nurse agencies, hospital- based home health programs, and similar agencies. This benefit provides an important and less costly alternative to institutionalization, whether in a hospit,al or extended-care facility, for persons who require medical care but could be taken care of at home. Home health services are offered under both the hospital insurance and supplementary medical insurance part of the program.
The legislation establishing health insurance for the aged under the Social Security Act stimu- lated considerable growth in the number of home health agencies throughout the country. The Public Health Service estimates that in 1963 only about 250 agencies would have met the definition of a home health agency in the Social Security Act,. As of March 31, 1967, close to 1,800 home health agencies had been certified for participa- tion under the Medicare program.
What kinds of agencies are these ? Where are they located! What kinds of services do they provide? This article describes the home health care services covered under Medicare and presents some data on the number and characteristics of agencies certified for participation under the program.
HOME HEALTH AGENCY DEFINED
A home health agency is a public agency or private organization, or a subdivision of such an
* Division of Health Insurance Studies, Offire of Re- search and Statistics.
12
agency or organization, that is primarily engaged in providing skilled nursing and other thera- peutic services.’
To be approved for participation under the program as a home health agency, each facility must meet special requirements, including pro- vision of both skilled nursing care and at least one other therapeutic service rendered directly to patients. Each agency must also have policies established by an advisory group of professional personnel, including at least one physician and one registered nurse, and must be supervised by
. .
a physician or registered nurse. In addition, each participating agency must be licensed in accordance with State or local law where applica- ble. Private profit-making organizations cannot participate in the program unless they are licensed under State law. Under the hospital insurance program, an agency primarily provid- ing care and treatment of patients with mental diseases cannot be defined as a home health agency.*
Services available from the participating agency need not be rendered by staff members
(full time or part time). Contractual arrange- ment for provision of services by nonstaff mem- bers is permitted under the law.
BENEFITS PROVIDED
Home health services are offered under both t,he hospital insurance and supplementary medical insurance programs of Medicare. Under the .former a patient is entitled to as many as 100
visits in a l-year period following his most recent. discharge from a stay of at least 3 consecutive
’ For a detailed detinition of a home health agency, see section 1861 (0) of the Social Security Act as amended July 30, 1965.
‘For a detailed and complete description of the con- ditions of participation, see Wealth 1nsurawe for the
Aged: Conditions of Participation for Home Health.
Agencies (HIM-2), Social Swurity Administration, 1966.
days in a hospital or extended-care facility. in a calendar year without the requirements for Under the supplementary medical insurance pro- previous institutionalization.
gram, a patient is entitled to as many as 100 visits Gnder both programs, a “visit” is defined as a
TABLE l.-Number and percentage distribution of participating home health agencies, by type of agency, geographic division, and State, as of March 1967
Geographic division
and State Total
United States ____________ 1 1,753 549 93
New England ___________ -_-__I
“Z
Maine-.---.--- New Hampshire ______ ____ 29 Vermont-: ______________ ___ 5 Massachusetts.--- ______ -_- 167 Rhode Island. _ _ ____ ______ 1G Connecticut ________________ Middle Atlantic __..__________ :ii New York- _ ________ ______ New Jersey. _______________ 55 Pennsylvania 1.____________ 119East North Central _____ -___- 290
Ohio---.--.---_--_--- 9% Indisna.-.--.__-_-.--- 20 Illinois ____________________ E Michigan _____________ ____ Wisconsin __________________ 51
West North Central __________ 107
Minnesota _________________ 35 Iowa ____-_-___________ ____ 17 Missouri. __________________ North Dakota ______________ 7 South Dakota ______________ 4 Nebraska. _ ________________ KJlnS&S~-. __-___ ____ __ ____ __ 2 South Atlantic _______________ 186 Delaware- _ __ ______________ Maryland _______ _._______ 2i District of Columbia _______ Virginia I--- _______________ West Virginia ______________ ii North Carolina. __ _________
South Carolina 1e-s ________ ii
Georgia..---.-._-_--- 10
Florida ._____ ________ _____ __ 56
East South Central. _________ ‘“i Kentucky __________________ Tennessee _________________
Alabama ’ __________________ 3’:
Mississippi-. ____ ___________ 20
West South Central __________
Arkansas I_________________ ‘Z4 Louisiana 1_________________ 37 Oklahoma ’ ________________ g Texas.-.---.---.--- Mountain ____________________ 51 Montana ___________________ f Idaho- _____________________ Wyoming---.--- I Colorado.~~~.~~~~~~.~~~~~~~ l! New Mexico _______________ Arizona ____________________ f Utah _______________________ Nevada ____________________ Pacitic.----..-.--- 14: J?iashington ________________ 2 orego*-.----...----.--- 2 California __________________ 8 Alaska _____________________ ________ Hawaii _____________________ : 20 4 10 t : 1 19 ii : i 0 1 8 i : a 5 A c 4 1 : : : ; 3; 3: _ _ _ _ _ _ I 1 _______. I I loo. 0 100.0 loo. 0 100.0 100.0 100.0 loo. 0 100.0 loo. 0 loo. 0 100.0 100.0 1w. 0 100.0 loo. 0 100.0 100.0 109.0 109.0 100.0 100.0 100.0 100.0 106.0 100.0 100.0 100.0 100.0 100.0 100.0 100.0 loo. 0 100.0 100.0 100.0 190.0 100.0 100.0 loo.0 loo. 0 100.0 loo. 0 100.0 100.0 100.0 100.0 100.0 100.0 100.0 160.0 loo. a 1w. a loo.0 lW.0 100.0 loo. 0 loo. m E:! - - _ - - - _. 100. ( lOQ.( _ _ _ _ _ _ _. lOO.( loO.( lOQ.( _ _ _ _ _ _ _. - Guam ___________: __________ - - - - _ _ Puerto Rico ________________ I I Virgin lslsnds _____________ (
1 Subunits of State Health Departments certified on a statewide basis counted separately. ‘isiting nnrse ssocia- tion :ombi- stion of :overn- lent and duntarg 120 32 29 59 ii 8 26 ::
Number of agencies Percentage distribution
H P -- , , :ospita1 based
rogmm Other Total
39 Jisiting *“IT? kxocia- tion 31.3 72.9 71.4 79.3 100.0 65.3 92.0 77.7 38.5 23.2 52.7 49.6 27.9 22.9 40.0 33.8 23.9 27.4 18.7 11.4 58.8 16.7 _ _ - _ - _ - 25.0 25.0 4.3 10.2 26.0 5x2 12: 1 10.5 _ _ _ _ _ _ _ _ _. _ - - - 10.0 14.3 3.7 66.7 iA 3.0 1.5 - - - _ - - - - - - _ - 17.4 6.8 - - - _ - _ - . _ _ _ _ _ _ - _ _ _ _ _ _ _ 7.1 0 iii:; _---_- 27.3 11.1 10.7 38.4 - I n VI _. _. _. _. _. _. _. . _ - - _ _ - _ - _ - _ - _ - _ : _ _ . I- : -_ - Combi- lation 0 govern- oent an< oluntar: agency 5.3 2.3 - _ _ _ _ _ _ _ _ _ _ _ _ _ _ _ _ _ _ _ _ 3.6 _ _ __ _ _ 1.9 2: 10.0 5.2 6.5 !E 29: 4 5.6 _ _ _ _ _ _ _ .__-_-_- 25.0 8.7 16.7 20.0 _ - _ - _. _ - _ - _ _ _ _ _ _ _ _ _. _ _ _ _ 5.3 15.4 _____ -__ 20.0 44.6 16.6 _ _ _ - _ _ _ . 42. I _ _ _ _ _ _ _. 11.1 _ - - _ _ _ _. 50.1 4. I 14. I i.! _ _ _ _ _ _ _ _ _ _ _ _ _ _ - - - - _ - _ - - _. _ _ _. _ _ _ _ _ _ _ _ _ _ _ _ _ _ - - _ _ - - _. - f 1 Y -- _- _ _. _. - _. I 1 ._ I ._ ._ 1 t 5 .- - ._ ._ -- - ._ .- _ .- - 19.7 14.3 10.3 4.6 _ _ _ _ _ _ _ 25.1 4.0 19.4 38.8 18.9 44.2 29.0 25.5 16.4 38.7 8.4 58.6 65.6 45.0 51.9 63.0 54.9 62 5.9 33.3 83.3 75.0 15.9 8.6 5.9 _ _ - _ _ _ _ 69.6 33.3 16.7 _. _ - _ - _. 50.0 17.4 69.4 20.0 88.5 FE 84:2 76.9 loo. 0 60.0 37.5 1.6 94.0 . _ _ - _ - _ - 98.6 94.6 90.0 Q4.7 98.5 97.3 ma 69.6 .6 59.3 77.8 44.4 io0.a ii:! 55.6 69.0 5o.c 13.6 22.2 33.3 _ - _ - _ - - _ i: zio _ - _ - _ _ - _ 5l.C 63.C 82.1 37. I - _ _ - - _ - - 50.1 11.1 3.6 7.0 66. i _ _ _ _ _ _ _ 100. ( _ - - - _ _ _ . lOO.( Hospital. based program 7.6 - _- _- _. . _ _ _ _ _ - _ - _ _ _ _ _ _ _ _ _ _ _ - _- , - _ 1 _ __ __ _ _ _ _ _ _
“personal contact in t,he place of residence of a
patient made for the purpose of providing a covered service by a health worker on the staff of the home health agency, or by others under
contract or arrnqenlent ; or a visit by a patient
on an outpatient basis to a participating hospital, extencled-care facility, or rebabilitat ion center.” ”
The following services, when provided by a participating home health agency, are covered under both programs :
-Part-time or intermittent nursing care -Physical, occupational, and speech therapy -Medical social services
-Part-time or intermittent services of a home
health aide
-Medical supplies (except for drugs and biologi- cals) and the use of medical appliances
-Services of interns and residents-in-training -Outpatient services.
All home health services must be provided under a plan established and supervised by a physician and specifying the nature and fre- quency of services to be furnished. The plan must be established within 14 days after discharge from a hospital or extended-care facility.
I-nder the hospital insurance program, the patient does not need to meet. any deductible or coinsurance requirements for home health serv- ices. The cost of the maximum of 100 visits to which a patient may be entitled is covered in full. The home health agency receives payment for covered services based on reasonable costs.
Under the supplementary medical insurance program, the home health agency is reimbursed for 80 percent of the reasonable cost of covered services, after the patient has first incurred s&i- cient expenses to meet the $50 deductible require- ment. The $50 deductible can be met by the patient by incurring expenses for any services covered under this program, not just those for home health services.
As of March 31, 1967, 1,753 home health agencies had been certified to participate in Medi- care. Certifications are made to the Department of Healt,h, Education, and Welfare on the recom-
’ Social Security Administration, Home Health Agency Manual (HIM-11) , page 18.
mendation of State agencies that the providers meet the conditions for participation promulgated by the Secretary of Health, Education, and Wel- fare. ,1L participating provider is a certified institution that has entered into an agreement with the Social Security Administration not to make charges for covered items and services ex- cept deductible and coinsurance amomlts where applicable and to provide services on a nondis- criminatory basis in compliance with title VI of the Civil Rights Act of 1964.
TYPE AND. GEOGRAPHIC DISTRIBUTION
OF FACILITIES
The overwhelming majority of participating home health agencies are either agencies adminis- tered by State or local health departments or visiting nurse associations (table 1). Official health agencies accounted for 54 percent of the
1,753 agencies, and visiting nurse associations rel)reseutecl an :~ddition:~l 31 percent of the total. These two tyl)es of agencies hare traditionally provided the bulk of home health services. Hospi-
tnl-hsed programs, which represented only 8
percent of all participating agencies, are a com- I)aratively recent development iu the field of home health care.
There are regional differences by type of par- t i&pat ing agency. Visiting nurse associations account for 73 percent of all home health agencies in Kew EGiglaiid, compared with 31 percent, in the South Central States. In contrast, only 1 out of every 5 agencies in Bew England is an official liealtli agency, and almost 95 percent of the agencies in the South Central States are adminis- tered by State or local departments of health.
In only three geographic divisions, hospital- based programs represent more than 10 percent of the participating agencies in the program-the &fiddle Atlantic States with 19 percent, the West Nortb Central Slates with 16 percent, and the Mountain States with 14 percent.
In seven States, the State Department of Health has elected to participate as a single state- . wide agency. Technically, each of these health departments constitutes one home health agency. To determine the availability of services with greater geographic precision, each individual
local unit in these States has been identified and counted separately. The number of subunits of statewide agencies counted in this way are: Alabama, 34 counties; Arkansas, 66 counties; Louisiana, 34 parishes ; Oklahoma, 40 counties ; Pennsylvania, 44 counties ; South Carolina, 22 counties; and Virginia, 28 districts.
In the first report of participating home health agencies, each statewide agency was considered one agency because the subunits could not be identified and counted separately. Thus, more than half the increase in the number of agencies- from 1,675 as of October 15, 1966, to 1,753 as of March 31, 1967-reflects this ditference in count- ing procedures.
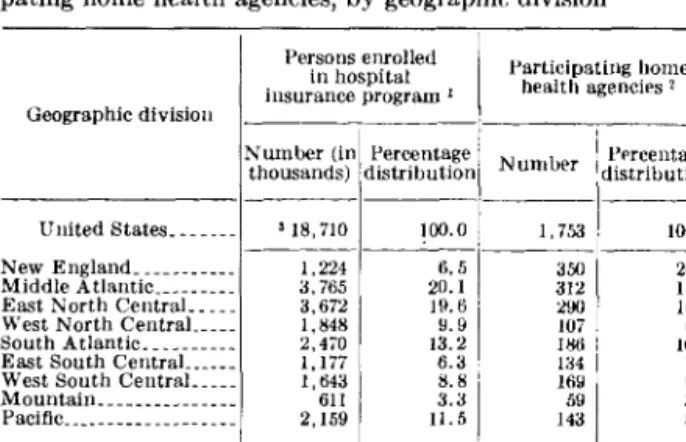
TABLE P.-Xumber and percentage distribution of persons
enrolled in the hospital insurance program and of partici- pating home health agencies, by geographic division
Persons enrolled
in hospital Participating home
iwursnce program L health agencies 2
Oeographic divisim - / United States... 3 18,710 1.224 3,765 3,672 1,848 2,470 1,177 1,643 611 2,15Y 100.0 A- 6.5 20.1 lR.6 Y.9 13.2 6.3 8.8 2 3.3 11.5 1,753 loo.0 350 20.0 312 17.8 2Yo tti. 5 IO7 6.1 Ill6 I 10. ti 134 7.6 16Y Y.6 5Y 3.4 143 x.2 Other areas... ____ _... 141 .R I 3l .2 ’ As of July 1.1~66. 2 As of March 31, lY6i.
J Excludes enrollees in foreign countries and those with place of residence unknown.
Comparing the distributions of Facilities and of persons enrolled in the hospital insurance pro- gram provides one measure of the geographic tlitierences in the availability of services of home health agencies (table 2). It is recognized that the agencies vary considerably in the range of services provided aud the number of patients served. Even without consideration of these fac- tors, it seems clear that there are wide varia- tions in the availability of home health agencies in the Sation. One-fifth of the agencies but only 6 percent of the hospital insurance enrollees are
’ Howard West, “Health Insurarwe for the Aged : The statistical Program,” Sociul Security llrclIt?iu, January 1967, page 12.
located in Sew England. In the Pacific region, llowever, only 8 percent of the agencies are serving 11 percent of the enrollees.
HOME HEALTH SERVICES AVAILABLE
The lack of homogeneity in the entire group of home health agencies is a noteworthy character- istic of all home health agencies, whether they
l):Lrticilx\te iii the 1)rogr:ini or not. ,1gencies vary
greatly, for esanlple, in size and extent of serv- ices otiered. Each makes its unique contribution to the care of the sick at home. At one end of the spectrum are agencies primarily providing inter- mittent or part-time nursing service and one 01 more other therapeutic services to the homebound. At the other end are agencies providing compre- llensive home care programs that coordinate under a central administration the provision of medical, nursing, social, and other services in t lie home for tile 1)atieut with multiple medical and yar:tmetlical needs. Soule of these 1)rograms limit admission to very ill or seriously hatidi- capped persons ; others admit less seriously ill persons who need only one or more types of service.
To particil~ite in the health iiisurance program each of the 1,753 home health agencies must otier skilled nursing care and at least one other service. There are 11 identifiable types of service avail- able from home health agencies, of which skilled uursing care is one. Over two-tllirds of the par- ticipating agencies (69 percent) offer physical t lierapy ; it third (;$4 percent) offer the services of home health aides (table 3). Services offered by one-fifth or more of the participating agencies are nutrition al guidance, appliances and equip- ment, medical social service, and speech therapy.
There is also ii large amount of variation in the type of services available in individual States.
For example, physical therapy services, available in almost 70 percent of the participating agencies nationally, are offered in each of the four agencies in Nebrnska but by none of the eight agencies in Wyoming. C ‘om Iarable 1 ditierences in the avail- ability of services other than nursing care may be
found for all of the other 9 types of services.
Table 4 shows the distribution of the 53 States ing to the relative availability of specified services. and Territories wit,h at least one participating Thus, there are t,hree Stat.es where physical home health agency (neither Alaska nor Ameri- therapy is available in less than 20 percent, of the can Samoa have a participating agency) accord- participating agencies. In 22 States, in contrast,
TABLE 3.-Number of participating home health aeencies and percent) offering selected services, by geographic division and
State, as of March 31, 1967 lursing care loo. 0 hysical ,kX3py 68.5 k.CUpa- tional hcrapy 13.9 [edical racial ervice ‘hsrma- :eutical service Appli- ances and 2% - S tl .- - u s 11.4 33.3 13.8 20.0 7.8 0 14.6 12.5 19.0 13.8 0 9.0 4.0 19.4 7.4 143:: 0 9.0 16.0 1.9 14.4 17.0 36.8 16.7 17.4 33.3 12.7 23.6 20.0 12.6 13.4 48.7 2:: 5.0 19.5 34.8 35.3 25.2 2:: 31.2 30.4 21.6 13.4 8.3 5.0 11.7 28.3 15.7 12.1 17.7 17.1 11.4 11.8 17.8 16.7 38.6 0 16.7 i 0” 8.7 17.4 11.2 5.7 3::; 0 2t.0 4.3 22.1 60.0 23.1 loo.0 3.0 0 0 18.2 10.6 42.6 25.5 40.C 19.: 50.C 9. I 26.1 7.: 36.~ 2O.C 37. ! 1.5 0 1.4 2.7 0 45. i 7i.4 0 15.c 4.1 i 2.4 26.1 19.9 40.0 23.1 100.0 15.2 47.4 0 1~s 21.4 .50.1 7”9.: 18.l 5.f 8.1 0 0 14.t 39.: 17.0 22.2 : 42.S 0 11.1 20.C 0 29.6 0 94.i 19. I 30.4 20.: 11.1 ii 42.1 3.3.: 33.: 20.1 0 20.3 2i.2 2i.f 33.2 11.1 80.1 0 20.: 25. I 17.! 18.1 .._. -__ Xl.1 32. : 29.f 35. i 31.4 _ _ 50.C 33.: 0 0 1GU.f 66.2 1oo.c 1J.c 24.7 - F c .- 9.4 24.1 R.9 0 6.9 20.0 6.6 8.0 14.6 2.6 0 6.9 i.0 4.0 1.0 20.6 14.3 17.2 20.0 21.6 12.0 23.3 39.1 14.7 60.9 21.7 36.4 12.7 15.1 7.6 34.3 39.9 Zft: 20.4 7.6 29.7 17.7 8.3 14.6 40.0 5.0 20.0 15.6 6.5 23.4 37.0 10.9 15.2 9.8 5.9 33.3 17.7 17.1 5.9 44.4 : 0 17.4 9.3 5.7 5.9 33.3 0 ii 4.3 21.5 20.0 17.6 44.4 0 0 25.0 17.4 26.3 40.0 38.5 loo. a 9.1 15.3 53.8 0 40.0 32.1 , , , 1 1 I , I , , _ I , 1 - 5.4 B-J.0 7.7 50.0 0 15.8 0 0 10.0 3.6 16.7 40.0 18.1 100. c 6.1 10.: y:: 2o.C 17.f 38.8 33.3 13. I 94.6 30.0 29.1 66.7 2.7 91.9 5.0 29.1 3.3.i 9::; 1O.C 29. a 52.6 8.1 4.6 34.3 1.8 0 2.7 0 8.7 27.f ; .i loo. c 21.i 16.9 11.1 11.1 0 14.3 66.7 33.3 ma 0 6.8 0 11.1 0 i ii?:; 0 27.6 25.6 32.1 26.7 _--..__. 50.0 14.0 11.1 14.3 14.0 . _. _ . _ _ _ 50.0 66.7 66.7 _ _ _. _. _ _ loo”.0 100.1 loo.0 0 100.0 13. ! 33.: 22.: 0 330.3 11.1 20.C 0 23.1 11.1 35.7 23.3 .._.-.-. 50.C 33.2 - _ _ _ . 0 1ci.c VOCR- tional :uidance nterm and &dents Geographic division
and State Total
I United States _____.______ 1.753 . 2.5 2.7 .3 0 3.4 : I! 5.0 8.7 3.6 3.4 2.1 0” 2.6 4.3 3.9 1.9 2.9 0 5.6 fl 0 3 3.8 0 7.7 0 i 15.4 0 10.0 3.6 1.5 i.7 : 2.4 i 1:.4 1.7 0 z ii 11.1 0 0 4.2 7.4 3.6 3.5 _.___..-- 0 NC!- England....-- ____ --__--1 Maine..-..----.-...---.--- New Hampshire _.__.__.._. Vermont..--..- ._____ -___- Massachusetts.. ______ -__-- Rhode Island __._ -___- ____ Connecticut _____ _________
“E
29 5 167 25 103 Middle Atlantic __.._.____..__ New York... _____ ______ New Jersey.. _____ .__. ___ Pennsylvania I.____________ 312 138 1% East North Central.-- ___.___Ohio.--.---.----..---.--- Indiana __________.____ -__-- Illinois _______ .__. _ ___.___. Michigan. _ ___. -___- _______ Wisconsin _____ --- ___.__..__ 290 iFi 2 51 West North Central .__.______
Minnesota-..---. Iowa _____ -_- __._ -___- _____. Missouri. _.._________..___. North Dakota ..__.____.___. South Dakota _.___ _____ -_. Nebraska....---..--.--. Kansas ______. -- ____ --___-__ 107 35 17 18 6 : 23 South Atlantic.-.--.- .___ -__ Delaware.~..~~--~~~---~~-- Maryland _____ ----__-- ____. District of Colombia __.____ Virginia: _..__ -___---___-__ West Virginia..--.--..-.--- North Carolina. _____ --___- South Carolina * __.___.____ Georgia _____ ____ __.-___-__ Florida---..-- _____________ 186 2: 3i 19 z 10 56 East South Central __________
Kentucky..- ______. ______ Tennessee .__._______ - ______ Alabama’...__ ____ -- _____ Mississippi .___ __________ -- 134 3 2 2c
West South Central _____.___. 166
ArkansasI-. ___________ --__ 6f Louisiana I________.____ -.__ 3; Oklahoma’.--- 41 Texaco ____________________.. 2z Mountain .__.________________ Montana . .._ -_- _____ -___-__ Idaho.-.---.----._--- Wyoming---_---. Colorado . ..______._________ New Mexico- _____ ____ --__ Arizona ______ - ______ -__--__ Utah ..______._______.______ Nevada.---.--- PscifiC..---.--.---.---.---- Washington _.__._ -- ____. -__ Oregon .____ --- ____ ---__-___ California-.---- ____ --__.--- Alaska ________________ - __.. Hawaii ..______.._____. ____ 5f f f 14 f i 14: 2 sl -__. : Other BTess.-.--- American Samoa .______.___ ______ --. Guam...-..--.--.--.. I Puerto Rica ..___.____..____ I Virgin Islands .___ ----__-___ I 70.0 76.2 82.8 80.0 59.3 69.0 84.5 81.6 “,;;:: 80.7 2: 45:o ES:: 56.9 59.8 40.0 :i:; 50.0 50.0 %:i 59.8 199.l. 85.: 1oo.c 30.3 31.f 100.C 36.4 50.C 71.4 94.f 33.: 95.f ‘El:: 50.1 loo. c 2.; 7.: 60.1 f31.t 55.t 88.1 0 57. I 100. c 55. I 19O.t loo. ( 67.1 63.c 57. I 72.1 109.1 100. ( 1W.l loo. ( 1OO.l 17.4 i.4 0 13.2 12.0 34.0 30.1 33.3 54.5 15.1 37.6 46.9 60.0 18.2 45.7 33.3 55.1 62.9 52.9 61.1 83.3 75.0 25.0 34.8 41.9 40.0 30.8 100.0 84.8 36.8 46.2 50.0 50.0 16.1 47.0 66.7 47.3 16.2 109.0 28.4 0 8.1 92.7 30.4 xl.8 33.3 44.4 100.0 28.6 66.7 77.8 40.0 0 40.6 11.1 50.0 47.7 _. _ _ _. 0 66.7 0 loo.0 ma : 0 0 .6 i 7.4 11.6 7.3 2.5 1.4 0” i.” 2.0 3.7 0 2.2 0 i 0 2.i 0 11.: 0 0” i 20.C 0 i I! 0 .f i 0 4.: 3.4 0 8 0 0 11.1 2O.C 0 2.1 if; 3.! _-.--_.. 0 0 0” 0
1 Subunits of State health departments on a statewide basis counted separately.
TABLE 4.-Number and percentage distribution of 53 States, by percent of agencies offering specified services, as of March 31, 1967 1
Percent of agencies
Number of States
Percentage distribution of States
Under 20.0.. _____________._____ 5.7 73.6 58.5 54.7 23.3 94.3 20X-39.9 -.___ ________________ 7.5 17.0 39.2 26.4 18.8 5.7 Z:! 79.2 39.6 ._._____.___ 47.2 loo.0 40.0-59.9 .____ ______ _________ -- 2.: 3.8 7.5 7.5 24.5 ___- ____._._ 13.2 i:“s 5.7 .__._. _____ 60.0-79.9.~~.~~~~~~~~-~~~~~-~.-. 41:5 ::: 1.9 1.9 13.2 ___. ___.___ 3.8 1.9 -________-._ _____-._____ 80,0ormore--..--.-.---.-.---- 1.9 9.4 15.1 -.._._---. 7.5 5.7 7.5 ___--_- _____
1 Includes 49 States (Alaska omitted), the District of Columbia, Guam, Puerto Rico, and the Virgin Islands
80 percent or more of the agencies ofler this serv- States each of the home health services specified is ice. Except for physical therapy, home health available in less than two-fifths of the agencies aides, and nutritional guidance, in nearly all the participating.
Recent Publications*
SOCIAL SECURITY ADMINISTRATION
BUREAU OF DI~ABIILTY INSUHANCE AND PU~I.IC HEALTII
SERVICE OCCUPATION HEALTH PROCHAM. Occupa tionuz
Characteristics of Disabled Workera, by Disabling Con- dition: Disability I?zsurance Hencfit Swards Uade in
1959-1962 to Men Under dye 65. Washington : U.S.
Govt. Print. Off., 1967. 307 pp, $1.75
Joint study by the Social Security Administration and the U.S. Public Health Service presents tabular data on the number of disability insurance benefits awarded to men under the Social Security Act for each occupational group, by age and disabling condition.
GENERAL
ABBOTT, CIIARLES C., ed. Bad Research in Finance:
Xccds and Prospects. Charlottesville : University of Virginia, Graduate School of Business Administration, 1966. 206 pp. $5.
BARTELS, ROBERT. Credit Uanagement. New York:
Ronald Press, 1967. 486 pp. $9.
Credit viewed in its elemental and collective aspects both as a social and a technical phenomenon.
* Prepared in the Library, Department of Health, Edu- cation, and Welfare. Orders for items listed should be directed to publishers and booksellers ; Federal publica- tions for which prices are listed should be ordered from
the Superintendent of Documents, U.S. Government
Printing Office, Washington, D.C. 20402.
BEGHERS, JAMES M. Population Processes in Social
Q&ems. Sew Pork: Free Press, 1067. 207 pp. $6.95.
GROSS, BERTRAND &I., ed. Action Un.der Planning: The
Guidance of EcorLomic De:elopmest. McGraw-Hill Book
Company, 1967. 314 pp. $12.
Deals directly with implementation of plans for eco- nomic development.
HARRIS& C. LOWELL. Haur7booli of State and Local
Government Finance 1966. 64 pp. $1.50. ’
Sew York: Tax Foundation, Inc.,
Hoes, IRA R. IZctaiuiny the H’ork Force: An Analysis
of Current h’xpcriencc. Berkeley : University of Cali- fornia Press, 1!%7. 281 l,p. $6.
Describes the kinds of training programs in existence, the reason for their establishment, their sponsors, and their results.
SELSON, RICHARD R., and others. !Z’ecl&noZoyy, Economic
Growth and Public policy. Washington, Brookings Insti- tution, 1967. 238 pp. $ti.
Relation of research and innovation to economic
growth.
POWELL, F. ENOCH. Hazjinys in a Free Society. (2d ed.)
London : Institute of Economic Affairs, 19ti6. 140 pp. $5.85.
U.S. CONGREBS. HOUSE. COMMITTEE ON GOVERNMENT
OPERATIONS. The Use of Social Research i>L F&era1
Domestic Programs. Washington : U.S. Govt. Print.
Off., 1967. 4 vol. (Committee Print. 90th Cong. 1st sess.) (Conticued on page 46)