sksOpen: Efficient Indexing, Querying, and
Visualization of Geo-spatial Big Data
Yun Lu1, Mingjin Zhang1, Shonda Witherspoon1, Yelena Yesha2, Yaacov Yesha2, Naphtali Rishe1 NSF Industry-University Cooperative Research Centers and
School of Computing and Information Sciences Florida International University
Miami, Florida 33199
1
{yun,zhangm,swith004,rishen}@cs.fiu.edu
2
{yeyesha,yayesha}@umbc.edu
Abstract. With the fast growing use of web-based map services, the performance of indexing and querying of location-based data is becoming a critical quality of service aspect. Spatial indexing is typically time-consuming and is not available to end-users. To address this challenge, we have developed and open-sourced an Online Indexing and Querying System for Big Geospatial Data, sksOpen. Integrated with the TerraFly Geospatial database [1], TerraFly sksOpen is an efficient indexing and query engine for processing Top-k Spatial Boolean Queries. Further, we provide ergonomic visualization of query results on interactive maps to facilitate the user’s data analysis.
Keywords: spatial databases, spatial index, data visualization I.INTRODUCTION
With the exponential growth of Internet applications, there are many domains open to Geographic Information System (GIS) applications. Massive amounts of spatial information become available to a wide range of public uses [2]. More and more people employ Web applications to update their geographical information via the process known as Geotagging. For example, Google Maps currently has more than 350 million users. There are also a rapidly growing number of geo-enabled applications, which utilize web map services on traditional computing platforms as well as on emerging mobile devices.
Geotagging can help users find a wide variety of location-specific information. For example, one can find images taken near a given location by entering latitude and longitude coordinates into a suitable image search engine. Geotagging-enabled information services can also potentially be used to find location-based news, websites, and other resources. Geotagging can tell users the location of the content of a given picture or other media, and conversely on some media platforms, show media relevant to a given location [3] [4].
However, due to the highly complex and dynamic nature of GIS systems, it is quite challenging for users to manipulate spatial data. On one hand, typical geographic visualization tools do not offer spatial data index functions or application programming interfaces (API) to the public. On the other hand, even if users have access to spatial data index services, it is very difficult to get the visualization of query results of their own spatial data.
To address the above challenges, we have developed TerraFly sksOpen, an efficient online indexing, querying, and visualization system for Big Geospatial Data, which allows users to easily create indices of spatial objects and to query and visualize the results and share them via unique URLs.
The TerraFly sksOpen Online Spatial Object Index and Visualization System is built using TerraFly Maps API, and JavaScript TerraFly API add-ons in a high performance cloud environment.
The remainder of this article is organized as follows: Section 2 presents the background and motivation for the system; Section 3 describes the architecture of the sksOpen system; Section 4 describes the visualization solutions in the sksOpen system; Section 5 presents a case study on the online spatial object index and search; Section 6 discusses our related work; Section 7 concludes the paper.
II. BACKGROUND
A. TerraFly
TerraFly is a system for querying and visualizing geospatial data developed by the High Performance Database Research Center (HPDRC) lab at Florida International University (FIU) [1, 5-12]. The TerraFly system serves worldwide web map requests to over 125 countries and regions, providing users with customized aerial photography, satellite imagery, and various overlays, such as street names, roads, restaurants, services and demographic data [13] [14].
The TerraFly API allows rapid deployment of interactive web applications, and has been used to produce systems for disaster mitigation, ecology, real estate, tourism, and municipalities. TerraFly's web-based client interface is accessible from anywhere, via any standard web browser, with no client software to install [15] [16].
TerraFly allows users to virtually ‘fly’ over enormous geographic information simply via a web browser with several advanced functionalities and features, such as user-friendly geospatial querying interfaces, map display with user-specific granularity, real-time data suppliers, demographic analysis, annotation, route dissemination via autopilots, API for web sites, etc [17] [18].
TerraFly's server farm ingests geo-locates, cleanses, mosaics, and cross-references 40TB of base map data and user-specific data streams. The 40TB TerraFly data collection includes, among others, 1-meter aerial photography of almost the entire United States, and 3-inch to 1-foot full-color recent imagery of major urban areas. TerraFly’s vector collection includes 400 million geo-located objects, 50 billion data fields, 40 million polylines, 120 million polygons, including: all US and Canada roads, US Census demographic and socioeconomic datasets, 110 million parcels with property lines and ownership data, 15 million records of businesses with company stats and management roles and contacts, 2 million physicians with expertise detail, various public place databases (including the USGS GNIS and NGA GNS), Wikipedia, extensive global environmental data (including daily feeds from NASA and NOAA satellites and the USGS water gauges), and hundreds of other datasets [19] [20].
B. Spatial data visualization
Information visualization (or data visualization) techniques are able to present the data and patterns in a visual form that is intuitive and easily comprehensible, allowing users to derive insights from the data, and support user interactions [2].
Visualizing the objects in geo-spatial data is as important as the data itself. The visualization task becomes more challenging as both the data dimensionality and richness in the object representation increases. In TerraFly data querying we have addressed the visualization challenge, including the interactive map visualization spatial data and interactive list visualization [21].
C. MapReduce
MapReduce is a programming model and an associated implementation for processing and generating large data sets. Users specify a map function that processes a key/value pair to generate a set of intermediate key/value pairs, and a reduce function that merges all intermediate values associated with the same intermediate key [22].
Programs written in this functional style are automatically parallelized and executed on a large cluster of commodity machines. The run-time system takes care of the details of partitioning the input data, scheduling the program's execution across a set of machines, handling machine failures, and managing the required inter-machine communication. This allows programmers without much experience with parallel and distributed systems to easily utilize the resources of a large distributed system [23] [24].
Hadoop, a version of MapReduce, is an open-source software framework that supports data-intensive distributed applications. It is this programming paradigm that allows for massive scalability across hundreds or thousands of servers in a Hadoop cluster. The MapReduce concept is fairly simple to understand for those who are familiar with clustered scale-out data processing solutions [25] [26].
The term MapReduce denotes the two main tasks that Hadoop programs perform. The first task, Map, takes a set of data and converts it into another set of data, where individual elements are broken down into tuples (key/value pairs). The
Reduce task takes the output from a Map as input and combines those data tuples into a smaller set of tuples.
D. K-NN
In pattern recognition, the k-nearest neighbor algorithm (k-NN) is a non-parametric method for classifying objects based on closest training examples in the feature space. k-NN is a type of instance-based learning, or lazy learning, where the function is only approximated locally and all computation is deferred until classification [27]. The k-nearest neighbor algorithm is amongst the simplest of all machine learning algorithms: an object is classified by a majority vote of its neighbors, with the object being assigned to the class most common amongst its k nearest neighbors (k is a positive integer, typically small). If k = 1, then the object is simply assigned to the class of that single nearest neighbor. It also mentions that includes the following result: The error rate of K-NN as the number of training examples tends to infinity tends to a value that does not exceed twice the Bayes error rate [28].
Nearest neighbor rules in effect implicitly compute the decision boundary. It is also possible to compute the decision boundary explicitly, and to do so efficiently, so that the computational complexity is a function of the boundary complexity.
III. ARCHITECTURE OF SKSOPEN
TerraFly sksOpen is implemented in Java, and is a web service easily accessible from anywhere. In this section, we will introduce the algorithm and software structure of sksOpen.
A. The index algorithm of sksOpen
We improved the spatial object index algorithm developed by Cary, Rishe et al in 2010 [29]. The algorithm creates spatial object indices as a hybrid index; it includes both an R-Tree spatial index and an inverted text file index. We have added a new “map” algorithm to split the data set in order to speed up the index to fit large-scale spatial data index [30].
By employing this hybrid index, we attained fast retrieval, even when matching objects were located far away from one another, efficiently filtering-out of objects not satisfying the query Boolean constraints on keywords, and maintained low storage requirements while keeping high query performance.
The challenge is reducing the computations to eliminate as many non-candidate objects as possible. In particular, NOT-semantics constraints may substantially shrink the output size and lead to unnecessary scans.
The indexing approach leverages the strengths of R-trees in spatial search, and modifies an inverted file for efficient processing of Boolean constraints. The combination of indexing techniques yields the hybrid data structure: Spatial-Keyword Index (SKI) [29].
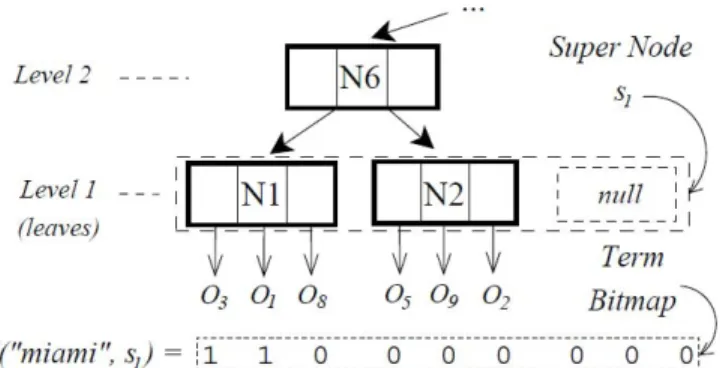
Figure 1: An super-node and leaf nodes
R-tree Index (R): A modified R-tree built with spatial attributes. Entries in R’s inner nodes are augmented with index ranges [a, b], where Sa and Sb are the left-most and right-most,
respectively, super nodes contained in the sub tree rooted at node entry. Ranges in leaf-node entries contain a single value, the index of the super node containing the leaf node. See Figure 1 and [29].
Spatial Inverted File (SIF): A modified inverted file constructed on a vocabulary V. The Lexicon contains terms in
V and their document frequencies (df). Posting lists are modified to include spatial information from R. Specifically, the posting list of a term t contains all its term bitmaps sorted by the super node index as follows:
Posting(t) = [I(t, s1), I(t, s2), ...] where SiBelongs to S(R)
Figure 2: Hybrid Spatial-Keyword Index
We organized posting elements in a B+tree to allow fast random and range retrieval. Figure 2 shows the structure of the hybird index [29] [31].
However, this algorithm is indexing the tuples in a particular sequence, which is not feasible in a large-scale index enviorment. To address this challege, we add a new componet of the algorithm, named split, and merge modules to split the input data set quickly into different parts, and finally merge all indices, to facilate multi-core or multi-machine index loading, to significantly increase the performance of the algorithm [32] [33].
We employed a Z-order value to quickly set the split points. In mathematical analysis, Z-order, Morton order, or Morton code, is a function that maps multidimensional data to one dimension, while preserving locality of the data points. It was introduced in 1966 by G. M. Morton [34]. The Z-value of a point in a multidimensional space is calculated by interleaving
the binary representations of its coordinate values. Once the data is sorted into this ordering, any one-dimensional data structure can be used such, as binary search trees, B-trees, skip lists, or hash tables. The resulting ordering can equivalently be described as the order one would get from a depth-first traversal of a quadtree; because of its close connection with quadtrees, the Z-ordering can be used to efficiently construct quadtrees and related higher dimensional data structures [35].
The Split Algorithm works as follows:
1. Get the Z-order Value of a tuple of coordinate to get the Split points
2. Create a Split point array
3. For each entry, perform a binary search in the Split point array to find out the partition index 4. Write the entry into corresponding partition file 5. Send the partitioned files to a thread or a loading
machine to start index loading The Index Merge Algorithm works as follows:
1. Save Split point array and load it when querying 2. For each search point, perform a binary search in
Split point array to find the partition index 3. Perform the query procedure in the corresponding
spatial keywords index
4. Find the eligible entry and return a list of the results
With this improvement, we have added a Quadtree at the top of the R-Tree index to improve the performance of multi-task loading [35]. Because the partitions of the data file are easy to control, the depth of the Quadtree is usually short, wich means the binarySearch in Split point runs quickly and takes O(log(m)).
B. The Structure of sksOpen
With the improvement of methods for processing top-k spatial Boolean queries by introducing the Split and Merge modules, we can utilize the MapReduce model to create the sksOpen indices for Big Data. The performance of the loading of indices is significantly improved.
Spatial Data Map Loading process Loading process
Reduce Final data index Loading
process
Start EngineQuery
TerraFly
Visualization
Engine
Query VisualizationFinal results
As shown in Figure 3, the Map module splits the spatial data into partitions depending on how many hardware resources will be used for index loading. After each loading process is finished, the Reduce module will automatically merge the indices of the data partitions to produce the final data index. After that, the database can be efficiently queried [36]. When a query comes, the Query Engine will examine the final data index, and then produce the query results list. With the results list, the TerraFly visualization engine will offer visualization with a unique URL, which can be shared with other users.
Figure 4: Loading Process
The loading process of sksOpen is one of the key modules. Figure 4 shows details of the loading process.
IV. VISUALIZATION OF SKSOPEN
For spatial object visualization, the system supports both map object visualization and data list object visualization. T visualization is dynamic and interactive.
Integrated with TerraFly map API and JavaScript, the query results of spatial object can be shown on a much better interface, including both map and object lists.
Figure 5: Visualization of a Hotels’ query results
Figure 5 shows visualization of a query of hotel information in Miami. When users query, for example, search for hotels of 4 stars or above and less than $200 per night near
downtown Miami, the visualization of results will be shown as in Figure 5. The map on the top shows the location of the hotel results. When the mouse hovers over a hotel location, a popup appears with more detailed information. Below the map visualization, there is a table of results hyperlinked to further querying.
Figure 6: Interactive list Visualization
As shown in Figure 6, if the mouse hovers over any object, more data appear as a layer over the page.
V. A CASE STUDY
In this section, we present a case study on using TerraFly sksOpen for spatial data indexing, query, and visualization.
Figure 7: Visualization of Block-group Median Income query John wants to analyze the relationship between median income in locales and property values. John enters a TerraFly page presenting visualization of median income data of U.S. Census Block Groups, as shown in Figure 7. John notices a place near Miami (zip code 33140) that has a lower median average income than areas nearby. Then John wants to examine the property values of this location.
Although he has access to a data set of all Florida properties, it is too large to use directly. There are 10 million records in the data set, and each record has 173 fields. He decides to index the file by sksOpen, in order to search the property information near the place.
read tuple dumpobject tuple into put objectsnodes into
Sort object
nodes create spatial
inverted file Join object node
with inverted
file
finallize the
spatial inverted
file
Move the index
files and clean
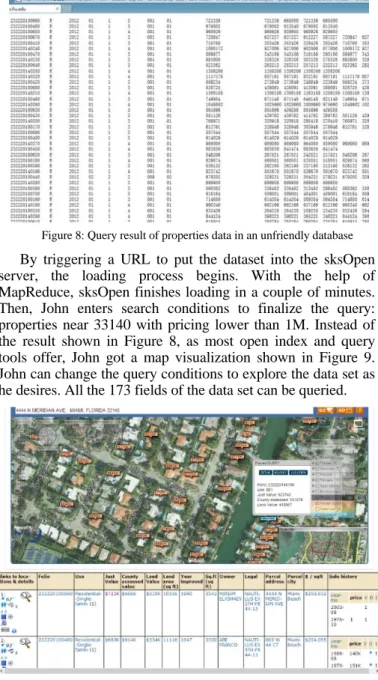
Figure 8: Query result of properties data in an unfriendly database By triggering a URL to put the dataset into the sksOpen server, the loading process begins. With the help of MapReduce, sksOpen finishes loading in a couple of minutes. Then, John enters search conditions to finalize the query: properties near 33140 with pricing lower than 1M. Instead of the result shown in Figure 8, as most open index and query tools offer, John got a map visualization shown in Figure 9. John can change the query conditions to explore the data set as he desires. All the 173 fields of the data set can be queried.
Figure 9: TerraFly Visualization of Query results
VI. RELATED WORK
Spatial object index, query, and visualization services, can significantly improve the data analysis efficiently. TerraFly sksOpen is one of the first systems open online that allows users to index their own data, and provide both interactive map and list visualization.
For the algorithm of processing Top-k Spatial Boolean queries, the R-tree traversal method in our work is inspired by Hjaltason and Samet’s incremental top-k nearest neighbor algorithm using R-trees [37]. Performance improvements on the original R-tree work have been proposed, e.g. R*-tree, R+-tree, and Hilbert R-tree. Any of these variants can replace the R-tree index used in the proposed hybrid spatial keyword index without modifying our search algorithms. In information retrieval, inverted files are arguably the most efficient index structures for free-text search [38]. Our approach combines
modified versions of R-trees and inverted files to achieve effective pruning of the search space [29], with an extra quad-tree index to implement MapReduce.
VII. CONCLUSION
We have improved a distributed disk-resident hybrid index for efficiently answering k-NN queries with Boolean constraints on textual content with MapReduce. With this algorithm, we have implemented efficient online indexing, querying, and visualization system for Big Geospatial data, to allow online users to index their own spatial data, and offer query visualization. Our experimental study showed an improved performance and scalability on large spatial datasets over alternate methods, and a better interactive user interface.
ACKNOWLEDGMENT
This material is based in part upon work supported by the National Science Foundation under Grant Nos. MRI CNS-0821345, MRI CNS-1126619, CREST HRD-0833093, I/UCRC IIP-1338922, I/UCRC IIP-0829576, RAPID CNS-1057661, RAPID IIS-1052625, MRI CNS-0959985, AIR IIP-1237818, SBIR IIP-1330943, FRP IIP-1230661, III-Large IIS-1213026, SBIR IIP-1058428, SBIR IIP-1026265, SBIR IIP-1058606, SBIR IIP-1127251, SBIR IIP-1127412, SBIR IIP-1118610, SBIR IIP-1230265, SBIR IIP-1256641, PIRE OISE-0730065, HECURA CCF-0938045, CAREER CNS-1253944, CAREER CNS-0747038, CSR CNS-1018262, HECURA
CCF-0937964, I/UCRC IIP-0934364. Includes material licensed by TerraFly (http://terrafly.com) and the NSF CAKE Center (http://cake.fiu.edu).
REFERENCES
[1] Rishe, N., Chen, S. C., Prabakar, N., Weiss, M. A., Sun, W., Selivonenko, A., & Davis-Chu, D. (2001, April). TerraFly: A high-performance web-based digital library system for spatial data access. In The 17th IEEE International Conference on Data Engineering (ICDE), Heidelberg, Germany (pp. 17-19).
[2] Lu, Y., Zhang, M., Tao Li, Y. G., & Rishe, N. (2013). Online Spatial Data Analysis and Visualization System. ACM KDD IDEA 2013, pp.73-79
[3] Anick Jesdanun, AP (2008-01-18). "GPS adds dimension to online photos". Retrieved 2008-01-19.
[4] Bogdan Carbunar, Mahmudur Rahman, Jaime Ballesteros, Naphtali Rishe. “Private Location Centric Profiles for Online Social Networks.” Proceedings of the 20th International Conference on Advances in Geographic Information Systems (GIS 2012) November 6-9 2012. Redondo Beach, California, pp. 458-461.
[5] N. Rishe, M. Gutierrez, J. Janvier. “A View from Above Without Leaving the Ground.” NASA Spinoff 2004, pp 72-73.
[6] Bo Xu, Ouri Wolfson, Sam Chamberlain, Naphtali Rishe “Cost Based Data Dissemination in Satellite Networks” Mobile Networks & Applications, Vol. 7 (2002), No. 1, pp 49-66.
[7] Jaime Ballesteros, Mahmudur Rahman, Bogdan Carbunar, Naphtali Rishe. “Safe Cities. A Participatory Sensing Approach”. 37th IEEE Conference on Local Computer Networks (LCN), October 22-25, 2012. pp. 626-634.
[8] Piotr Szczurek, Bo Xu, Ouri Wolfson, Jie Lin, Naphtali Rishe. “Learning the relevance of parking information in VANETs”. Proceedings of the seventh ACM international workshop on VehiculAr InterNETworking. Chicago, Illinois. September 24, 2010. ISBN:978-1-4503-0145-9. pp 81-82, September 2010.
[9] Piotr Szczurek, Bo Xu, Ouri Wolfson, Jie Lin, Naphtali Rishe. “Prioritizing Travel Time Reports in Peer-to-Peer Traffic Dissemination”. Proceedings of the IEEE International Symposium on
Communication Systems, Networks and Digital Signal Processing (7th CSNDSP). Newcastle, U.K. July 21-23, 2010. pp 454-458.
[10] Daniel Ayala, Jie Lin, Ouri Wolfson, Naphtali Rishe, Masaaki Tanizaki. “Communication Reduction for Floating Car Data-based Traffic Information Systems”. Second International Conference on Advanced Geographic Information Systems, Applications, and Services, pp 44-51, February 10-16, 2010. Best Paper Award.
[11] N. Rishe. Database Design: The Semantic Modeling Approach. McGraw-Hill, 1992, 528 pp.
[12] N. Rishe. Database Design Fundamentals: A Structured Introduction to Databases and a Structured Database Design Methodology. Prentice-Hall, Englewood Cliffs, NJ, 1988. 436 pp. (Also printed as International Edition. Prentice-Hall International, Inc., 1988. 432 pp. ISBN 0-13-197476-9.)
[13] Lester Melendez, Ouri Wolfson, Malek Adjouadi, Naphtali Rishe. “Qualitative Analysis of Commercial Social Network Profiles”. Handbook of Social Network Technologies and Applications. Borko Furht, editor. Springer Verlag, 2010. pp 95-114.
[14] N. Rishe, M. Gutierrez, A. Selivonenko, S. Graham. “TerraFly: A Tool for Visualizing and Dispensing Geospatial Data.” Imaging Notes, Summer 2005, Vol. 20, No. 2. pp 22-23.
[15] Rishe, N., Sun, Y., Chekmasov, M., Selivonenko, A., & Graham, S. (2004, December). System architecture for 3D terrafly online GIS. In Multimedia Software Engineering, 2004. Proceedings. IEEE Sixth International Symposium on (pp. 273-276). IEEE.
[16] Naphtali Rishe. U.S. Patent 6,795,825 “A Database Querying System and Method” issued 2004.09.21.
[17] Naphtali Rishe. U.S. Patent 6,339,773 “Data extractor” issued 2002.01.15.
[18] Naphtali Rishe, Borko Furht, Malek Adjouadi, Armando Barreto, Evgenia Cheremisina, Debra Davis, Ouri Wolfson, Nabil Adam, Yelena Yesha, Yaacov Yesha. “Geospatial Data Management With TerraFly.” Handbook of Data Intensive Computing. Furht and Escalante, eds. Springer Verlag, 2011. pp.637-665.
[19] Naphtali Rishe. TerraAtlas: Central Washington, DC. The McDonald & Woodward Publishing Company, Blacksburg, Virginia, 2006. ISBN 0-939923-99-8.
[20] Rishe, N., Gutierrez, M., Selivonenko, A., & Graham, S. (2005). TerraFly: A tool for visualizing and dispensing geospatial data. Imaging Notes, 20(2), 22-23.
[21] Yi Zhang and Tao Li. DClusterE: A Framework for Evaluating and Understanding Document Clustering Using Visualization. ACM Transactions on Intelligent Systems and Technology, 3(2):24, 2012. [22] Dean, J., & Ghemawat, S. (2008). MapReduce: simplified data
processing on large clusters. Communications of the ACM, 51(1), 107-113.
[23] Zhengguo Sun, Tao Li, and Naphtali Rishe. “Large-Scale Matrix Factorization using MapReduce.” Proceedings of the 2010 IEEE International Conference on Data Mining Workshops. Sydney, Australia. December 13, 2010. ISBN: 978-0-7695-4257-7. pp 1242-1248.
[24] Jaime Ballesteros, Ariel Cary, Naphtali Rishe. “SpSJoin: Parallel Spatial Similarity Joins.” Proceedings of the 19th ACM SIGSPATIAL International Conference on Advances in Geographic Information
Systems (ACM SIGSPATIAL GIS 2011). Chicago, Illinois, November 1-4, 2011. pp.87-95.
[25] Ariel Cary, Yaacov Yesha, Malek Adjouadi, Naphtali Rishe. “Leveraging Cloud Computing in Geodatabase Management”. Proceedings of the 2010 IEEE Conference on Granular Computing GrC-2010. Silicon Valley, August 14-16, GrC-2010. pp 73-78
[26] Ariel Cary, Zhengguo Sun, Vagelis Hristidis, Naphtali Rishe. “Experiences on Processing Spatial Data with MapReduce.” in Springer Lecture Notes in Computer Science, Volume 5566/2009: Scientific and Statistical Database Management. (Proceedings of the 21st International Conference on Scientific and Statistical Database Management. New Orleans, Louisiana, USA. June 1-5, 2009.) pp 302-319.
[27] Cover TM, Hart PE (1967). "Nearest neighbor pattern classification". IEEE Transactions on Information Theory 13 (1): 21–27
[28] A. Prasad Sistla, Ouri Wolfson, Bo Xu, Naphtali Rishe. “Answer-Pairs and Processing of Continuous Nearest-Neighbor Queries”. Proceedings of the 7th ACM SIGACT/SIGMOBILE International Workshop on Foundations of Mobile Computing (FOMC 2011). San Jose, California, Jun 9, 2011. ACM, New York, NY. pp.16-24
[29] Cary, A., Wolfson, O., & Rishe, N. (2010, January). Efficient and scalable method for processing top-k spatial boolean queries. In Scientific and Statistical Database Management (pp. 87-95). Springer Berlin Heidelberg.
[30] Shu-Ching Chen, Xinran Wang, Naphtali Rishe, and Mark Allen Weiss. “A Web-Based Spatial Data Access System Using Semantic R-trees.” Information Sciences: An International Journal. vol. 167, no. 1-4, pp 44-61, December 2004.
[31] N. Rishe, A. Shaposhnikov. U.S. Patent 5,920,857 “Efficient Optimistic Concurrency Control and Lazy Queries for Databases and B-Trees” issued 1999.07.06.
[32] C. Yu, K.L. Liu, W. Meng, Z. Wu, N. Rishe. “A Methodology to Retrieve Text Documents from Multiple Databases”. IEEE Transactions on Knowledge and Data Engineering. Vol. 14 (2002) nbr 6 pp 1347-1361.
[33] W. Meng, K. Liu, C. Yu, W. Wu, and N. Rishe. “A Statistical Method for Estimating the Usefulness of Text Databases.” IEEE Transactions on Knowledge and Data Engineering. Vol. 14 (2002) nbr 6 pp 1422-1437. [34] Morton, G. M. (1966), A computer Oriented Geodetic Data Base; and a
New Technique in File Sequencing, Technical Report, Ottawa, Canada: IBM Ltd.
[35] Bern, M.; Eppstein, D.; Teng, S.-H. (1999), "Parallel construction of quadtrees and quality triangulations", Int. J. Comp. Geom. & Appl. 9 (6): 517–532
[36] Naphtali Rishe, Borko Furht, Malek Adjouadi, Armando Barreto, Debra Davis, Ouri Wolfson, Yelena Yesha, Yaacov Yesha. “Semantic Wrapper: Concise Semantic Querying of Legacy Relational Databases.” Handbook of Data Intensive Computing. Furht and Escalante, eds. Springer Verlag, 2011. pp.415-444.
[37] Guttman, A.: R-trees: A dynamic index structure for spatial searching. In SIGMOD, pp. 47–57. ACM, New York, 1984.
[38] Zobel, J., Moffat, A.: Inverted files for text search engines. ACM Comput. Surv. 38 (2), 2006.