Purdue University
Purdue e-Pubs
International Refrigeration and Air Conditioning
Conference
School of Mechanical Engineering
2012
Evaluating Fault Detection and Diagnostics
Protocols Applied to Air-Cooled Vapor
Compression Air-Conditioners
David P. Yuill
James E. Braun
Follow this and additional works at:
http://docs.lib.purdue.edu/iracc
This document has been made available through Purdue e-Pubs, a service of the Purdue University Libraries. Please contact [email protected] for additional information.
Complete proceedings may be acquired in print and on CD-ROM directly from the Ray W. Herrick Laboratories athttps://engineering.purdue.edu/ Herrick/Events/orderlit.html
Yuill, David P. and Braun, James E., "Evaluating Fault Detection and Diagnostics Protocols Applied to Air-Cooled Vapor Compression Air-Conditioners" (2012).International Refrigeration and Air Conditioning Conference.Paper 1307.
2470
, Page 1
Evaluating Fault Detection and Diagnostics Protocols Applied to Air-cooled Vapor
Compression Air-conditioners
David YUILL*, Jim BRAUN
Ray W. Herrick Laboratories, Purdue University, Mechanical Engineering
West Lafayette, IN, USA
(765) 494-2132, [email protected]
* Corresponding Author
ABSTRACT
Fault detection and diagnostics (FDD) tools are being increasingly applied in air-conditioning systems. There are many different protocols used in these FDD tools, so an important question to ask is: how well do the protocols work? This paper describes the ongoing development of the first standardized method of evaluation for FDD protocols applied to air-cooled vapor compression air-conditioning systems. The general approach is to feed a library of data – including temperatures, pressures, and humidity – to a candidate FDD protocol, and observe the responses of the protocol. The library includes data from units operating with no fault or with single faults. The faults include undercharge or overcharge of refrigerant; impaired heat transfer in the condenser or evaporator; liquid line flow restriction; presence of non-condensable gas in the refrigerant; and compressor valve leakage. The outputs from the test are categorized, and statistics and figures are generated. A preliminary evaluation of RCA, a public domain FDD protocol, has been conducted using laboratory measurement data from 13 air conditioning systems. The rates of (a) no response, (b) correct, (c) false alarm, (d) missed detection, and (e) misdiagnosis show that the protocol performed poorly. This underscores the need for standardized FDD evaluation methods.
1. INTRODUCTION
Fault detection and diagnostics (FDD) tools are applied to air-conditioning systems primarily to detect and diagnose faults that degrade capacity and efficiency. Such faults may go unnoticed by equipment operators between applications of routine maintenance and may go unnoticed by maintenance technicians. Air-cooled vapor compression air-conditioning equipment, such as rooftop units (RTU) commonly used in smaller commercial buildings and split systems used in residential buildings, is an excellent candidate for FDD because (a) there is such a large number of these systems in use; and (b) these systems typically receive less intensive maintenance than larger systems and are manufactured at relatively low-cost, so they tend to have a high incidence of faults (Wiggins and Brodrick 2012). Consequently several FDD tools for these systems have been developed over the past fifteen years (Rossi and Braun 1997; Li and Braun 2003, Armstrong et al. 2006, Kim et al. 2008) and FDD is being marketed by several commercial entities. Furthermore, California’s 2013 Title 24 building energy code will require some FDD on newly installed unitary air-conditioners.
In light of the increasing deployment of FDD, marketing of FDD, and regulatory requirements, an important question to ask is: how well does it work? This simple question is quite difficult to answer. There is currently no standard method of measuring the performance of FDD, either for air-conditioning or other engineered systems (Vachtsevanos et al. 2005). Assessing the FDD tool’s performance requires knowledge of accuracy in detecting and correctly diagnosing faults across a range of fault types and fault intensities, and under a range of operating conditions. The assessment is further complicated by the many different approaches taken and functionalities of existing FDD tools. For example, some tools will isolate a fault, such as low evaporator airflow, some tools will also quantify the fault’s intensity or effects on performance, and some are intended to detect and diagnose other faults, but not evaporator airflow.
2470
, Page 2
This paper describes an ongoing effort to develop methodologies for testing the performance of FDD protocols used in tools applied to RTU and split systems. The general approach is to feed data from well-controlled laboratory experiments into the protocol, collect the results, and compare them to reference data. The library of reference data is described below, then the faults of interest are discussed and defined, and an evaluation technique is presented. Finally a case study of an evaluation of a publicly available protocol is given.
2. FAULT DATA LIBRARY
2.1 Experimental Data CollectedData have been gathered from experiments conducted by several researchers in laboratories throughout the USA. Measurement data include temperatures, pressures, flow rates, humidity levels and electrical power from the applicable points in the system (on both the refrigerant-side and air-side). These measurement data come from systems with commonly used refrigerants, and using fixed orifice and thermostatically controlled expansion devices (FXO and TXV, respectively), and reciprocating and scroll compressors. Table 1 shows a summary of the systems in the database.
Table 1: Summary of systems tested and conditions during testing in the fault data library
The measurement data have been organized into a standardized format. For each system the number of tests varies, from 4 to 202. The total number of tests is 725. On each system, a subset of the tests is done with no fault present, typically at several sets of driving conditions that correspond to the driving conditions for fault tests. (Driving conditions are: indoor coil entering temperature and humidity, and ambient air temperature; for a single-speed system these conditions dictate equipment performance. In this paper the air entering the indoor coil is referred to as “return air”.) The reason for conducting the no-fault tests is that the fault effects on performance are normally a key concern for the researchers.
2.2 Normal Model
In six of the 13 systems in the data library there was a sufficient set of no-fault tests to enable development of a normal model. A normal model is a multiple linear regression of the driving conditions that predicts capacity or COP, as shown in Eqs. 1 and 2, where the coefficients i and i are found using a least squares approach. The
normal model is developed using no-fault tests, so that it can be used to assess what the capacity or COP degradation is for faulted tests at any given condition. The normal model approach for determining degradation is preferable to a measurement-based approach for two reasons. The first is that it significantly reduces bias error, because it obviates the problem of trying to exactly match the test conditions for a faulted and an unfaulted test. The second is that it
System # Type Capacity [kW] Refrigerant Expansion Device Compressor No Fault Charge Indoor Coil Airflow Outdoor Coil Airflow Other faults
1 RTU 10.5 R410a FXO Scroll 24 37 21 6 0 19 52
2 RTU 10.5 R22 FXO Reciprocating 39 34 26 36 67 16 38
3 RTU 17.6 R407c FXO Scroll 17 27 19 8 0 19 47
4 RTU 17.6 R410a TXV Scroll 3 12 14 3 0 35 35
5 RTU 17.6 R22 TXV Scroll 4 20 0 0 0 28 49
6 Split system 10.5 R410a FXO Reciprocating 15 18 6 8 0 28 53
7 Split system 8.8 R410a TXV Scroll 16 24 21 15 47 21 38
8 Split system 8.8 R407c TXV Reciprocating 1 3 0 0 0 35 35
9 Split system 10.5 R410a TXV Reciprocating 22 17 17 8 0 28 53
10 Split system 10.5 R410a TXV Scroll 4 12 8 0 0 28 52
11 Split system 10.5 R22 TXV Scroll 4 8 8 0 0 28 52
12 Split system 10.5 R22 TXV Scroll 4 8 8 0 0 28 52
13 Split system 26.4 R22 TXV Reciprocating 4 2 0 0 0 28 49
Total: 157 222 148 84 114
Number of tests
Ambient Temp. Min. Max. [°C] [°C]
2470
, Page 3
reduces or eliminates one half of the random error associated with a comparison of two test results (faulted and unfaulted tests at the same conditions).
(1)
(2)
For wet-coil cases, the two external driving conditions are ambient air dry bulb and return air wet bulb temperature. For dry-coil cases, the two driving conditions are ambient dry bulb and return air dry bulb. To use a single two-input model (as shown in Eqs. 1 and 2) to represent both dry- and wet-coil cases, an approach has been followed in which a fictitious return air wet bulb temperature, wbra,f , is used in place of the actual return air wet bulb
temperature, wbra for all dry-coil cases. This wbra,f is calculated using an iterative approach that involves a bypass
factor (BF). BF indicates the fraction of air that would need to bypass an ideal coil, byp,/ lvg, to give equivalent
performance to the real coil. Using energy and mass balances and psychrometric relationships, BF can also be expressed in terms of specific enthalpies, h, or humidity ratios, , as shown in Eq. 3.
(3)
For a wet coil condition, the air leaving an ideal coil will have a dewpoint temperature equal to the surface temperature of the coil – the apparatus dewpoint (adp). In the fictitious wet bulb approach, BF is iteratively varied until the enthalpy calculations of Eq. 3 give the same result as the humidity ratio calculations with an assumption of 100% relative humidity for the air at the apparatus dewpoint.
The BF values calculated for the wet coil cases are averaged, and this average is then used to calculate sensible heat ratios for each dry coil test using Eq. 4. In Eq. 4, adp is calculated using Eq. 3, and the fictitious return air enthalpy,
hra,f, is varied until SHR converges to 1.0. Finally, the fictitious wet bulb, wbra,f , is calculated from hra,f and Tra and
is used in Eqs. 1 and 2 for any dry coil cases in the data set.
(4)
This approach is described in more detail by Brandemuehl (1993).
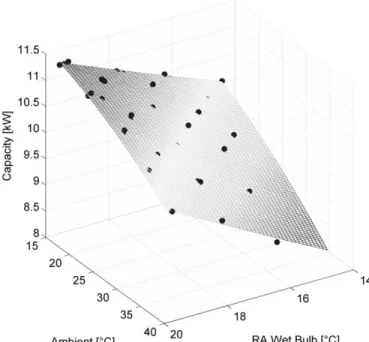
An example plot of a normal model is shown in Figure 1. The mesh surface is the model and the circular markers are the measurement data upon which the model is based. The completed model is used to generate fault impact ratios (FIR), defined as:
(5)
where the faulted COP and capacity values come from measurements, and the unfaulted values come from the normal model. The FIR values are included in the data library, and provide a convenient way to assess the significance of a fault that is detected or missed by an FDD protocol.
2470
, Page 4
Figure 1: Example normal model of capacity and unfaulted measurement data
One advantage of generating the normal model is that it gives an indication of the random error associated with each experiment, and in some cases illuminates outliers that would otherwise be missed. Part of the task of compiling the fault library includes vetting the data for accuracy, and the normal model was one tool used to do this. Outliers are investigated, and if they appear to have been caused by experimental problems they are removed from the dataset. In the current library about 25% of the data were deemed to be unreliable or otherwise inappropriate, and were removed.
3. FAULTS
There are six faults that are considered in the current project. These faults are briefly described in Table 2, along with a proposed standard method of implementing each fault in a laboratory setting and definitions of fault intensity.
Table 2: Descriptions of faults and fault intensity definitions
Fault Type Abbr. Description Fault Intensity Definition
Under- or over-charge
UC OC
A mass of refrigerant charge that is less or more than
the manufacturer’s recommended mass.
Low-side heat
transfer EA
Evaporator faults; reduced evaporator airflow is used to implement this fault in a laboratory.
High side heat
transfer CA
Condenser faults; reduced condenser airflow is used
to implement this fault in a laboratory.
Liquid line restriction LL
Flow restrictions in the liquid line. FI is the change in liquid line pressure drop divided by the unfaulted pressure drop.
2470
, Page 5
Non-condensables NC
The presence of non-condensable gas in the refrigerant. FI in the laboratory is the mass of N2 divided by the mass of N2 that would fill the system at standard temperature and pressure.
Compressor valve leakage VL
Leakage of refrigerant from high to low pressure regions in the compressor. Implemented in the laboratory with a metered hot-gas bypass.
Several researchers have proposed simulation of air-side fouling by covering portions of the face of the heat exchanger with paper, arguing that this better mimics the fault as it might occur. Some have also questioned whether reducing airflow can effectively mimic actual fouled coil surfaces. However, Yang et al. (2007) and Bell et al. (2012) both found that the effect of coil fouling on the heat transfer coefficient was quite small, the dominant effect being the increased air-side pressure drop, which causes reduced airflow in constant-speed systems. Since reduced airflow is easily quantified and replicated, it is the recommended method for imposing faults in the heat exchangers.
Liquid line restrictions can be caused by a crimped line, sediment in the filter/drier, or sediment lodged in some part of the expansion device. The fault is simulated with a valve in the liquid line causing a pressure drop, PLL,faulted.
To calculate fault intensity, the increase in pressure drop (PLL,faultedPLL,unfaulted) is normalized with the unfaulted
pressure drop at the same driving conditions.
Implementing a non-condensables fault requires feeding nitrogen gas into the system. To quantify fault intensity, the mass of gas is divided by the mass that would fill the system at standard temperature and pressure. This reference mass, , represents the amount of air that would be present in a system that was open to the atmosphere prior to charging.
4. FDD EVALUATION
To evaluate FDD protocols, the data from the fault library are fed to a candidate FDD protocol, and the results are compared with the known fault condition. For a protocol that detects and isolates (i.e. determines the location and type, but not magnitude) faults, there are five exclusive outcomes possible for each test case:
1. No response – the FDD protocol cannot be applied for a given input scenario, or does not give an output because of excessive uncertainty.
2. Correct – the operating condition, whether faulted or unfaulted, is correctly identified 3. False alarm – no significant fault is present, but the protocol indicates the presence of a fault 4. Missed detection – a significant fault is present, but the protocol indicates that no fault is present 5. Misdiagnosis – a significant fault is present but the protocol misdiagnoses what type of fault it is
Evaluations are conducted with the complete set of data from the library, or with subsets of the data that are of particular interest. For example, a FDD protocol may be applied only to split systems, or only to systems with R-22, or only with ambient temperatures in a given range, etc.
Some protocols are not intended to diagnose all of the faults within the library. These protocols are still fed data with other faults imposed, because such faults do occur in the field, but the test outcomes are enumerated differently. For example, if a protocol that only diagnoses undercharge (UC) faults is fed a test with a condenser airflow (CA) fault, it can either report that there is no fault – which is classified as 2. Correct – or that there is a UC fault, which is classified as 5. Misdiagnosis. In contrast, if a protocol that is intended to diagnose CA faults reports that there is no fault, this is classified as 4. Missed detection.
Once the results for a given set of test cases are generated, statistics are generated to give some overall performance indications. First, percentages are generated for each of the five outcomes listed above. The percentages are defined as follows:
2470
, Page 6
(6) (7) (8) (9) (10)Since the denominators are different, these percentages don’t sum to unity.
Response curves, which show the candidate FDD protocol’s success (% Correct) as a function of fault intensity, can be generated for each type of fault that the protocol can diagnose. Response curves require large numbers of data to be meaningful. This means that when using the data from the current data library, response curves can only be generated for the more common faults: UC, OC, EA and possibly CA. Furthermore, the results need to be put in bins of fault intensity. For example, a response curve may be generated for evaporator airflow at FIEA of 10%, -20%, etc. using data in the ranges -5% to -15%, -15% to -25%, and so on.
5. CASE STUDY OF THE RCA PROTOCOL
To illustrate the methodology presented in this paper, and to demonstrate the need for evaluation of FDD protocols, the results of an evaluation of the RCA protocol are provided below. This protocol is specified in the Appendix RA of Title 24 – 2008 (CEC 2008), which is a California building energy code. The RCA is applied to cooling mode air-conditioners to determine whether an evaporator airflow fault (EA) is present, and if none is present to determine whether a refrigerant charge fault is present (UC or OC).
The RCA uses the following as its inputs: (1) return air dry bulb and wet bulb; (2) supply air dry bulb; (3) ambient air dry bulb; and (4) either evaporator superheat for FXO systems, or subcooling for TXV systems. These inputs, and values from lookup tables, are used to determine whether temperature split (the air temperature difference across the evaporator) and superheat (FXO) or subcooling (TXV) are within an acceptable range. The range of driving conditions for the lookup tables is limited, which means that the protocol can’t be applied to some tests in the data library (i.e. gives No Response outcomes).
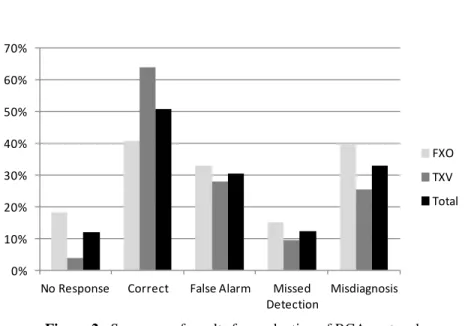
The RCA was evaluated using the full library of 725 tests from 13 systems. A summary of the overall results is shown in Table 3 and presented graphically in Figure 2.
2470
, Page 7
Table 3: Summary of results for evaluation of RCA protocolThis table shows separately the results for FXO and for TXV equipped systems, since the protocol treats them differently. The performance for TXV is better overall. For each result category the percentage is shown for each expansion type and for all results combined. For example, under “Missed Detection” there are 40 cases for FXO. Following the definition in Equation 9, this result is divided by the number of responses given to faulted FXO tests (267), to give 15%. Similarly for TXV, the 23 Missed Detection cases divided by 244 responses to faulted TXV tests gives 9%. The combined result is
.
Figure 2: Summary of results for evaluation of RCA protocol
The results, overall, seem quite poor. About half of the times it’s applied, the RCA protocol gives a Correct result. The most serious problems are the high rates of False Alarm and Misdiagnosis (30% and 33%), because each of these outputs will result in costly and unnecessary service when the protocol is deployed. In practice, users of FDD on unitary equipment commonly have no tolerance for False Alarms, but are quite tolerant of Missed Detections, so it could be concluded that this protocol is overly sensitive.
Further insight into the performance of the RCA protocol is given by considering the response curves for the three faults that RCA is intended to detect and isolate – EA, UC and OC – which are shown in Figures 3 to 5.
No False Missed Mis- # of
Response Correct Alarm Detection diagnosis responses
74 166 22 40 106 95 67 Unfaulted 18% 41% 33% 15% 40% 313 267 Faulted 12 203 17 23 62 62 61 Unfaulted 4% 64% 28% 9% 25% 255 244 Faulted Total 12% 51% 30% 12% 33% 725 639 317 408 For FXO For TXV Total # tests 0% 10% 20% 30% 40% 50% 60% 70%
No Response Correct False Alarm Missed Detection
Misdiagnosis
FXO TXV Total
2470
, Page 8
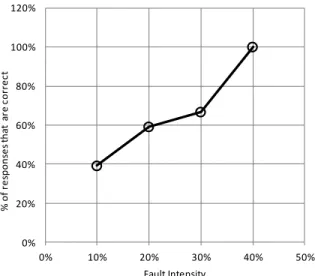
Figure 3: RCA evaluation response curve for evaporator airflow (EA) fault
Figure 3 shows an expected trend: as the fault intensity increases, the RCA’s accuracy at diagnosing this fault increases in a roughly linear fashion until FIEA = -50%, beyond which it correctly diagnoses all cases.
Figure 4: RCA evaluation response curve for undercharge (UC) fault
The response curve for UC, in Figure 4, shows a surprising trend: as the fault severity increases beyond -20% the RCA is less capable of correctly diagnosing the fault, and at the most severe intensity bin, -40%, the RCA correctly diagnoses none of the cases. The -40% intensity bin contains nine tests. Of the three faults that RCA is intended to diagnose, UC causes the greatest degradation in capacity and efficiency as a function of fault intensity.
0% 20% 40% 60% 80% 100% 120% -100% -80% -60% -40% -20% 0% % o f re sp o n se s th at a re c o rr e ct Fault Intensity 0% 20% 40% 60% 80% 100% 120% -50% -40% -30% -20% -10% 0% % o f re sp o n se s th at a re c o rr e ct Fault Intensity
2470
, Page 9
Figure 5: RCA evaluation response curve for overcharge (OC) fault
As with EA, the RCA has the expected curve for OC, with the rate of correct responses increasing until FIOC = 40%,
where it correctly diagnoses all three tests in the bin. However, at 30% overcharge, where the RCA correctly diagnoses only 2/3 of the cases, the fault will likely cause compressor damage that is costly to repair, so the value of this protocol for this fault is also questionable.
The RCA protocol is widely used, and this case study shows that it performs poorly. There are two important points illustrated by the case study. The first is that there is a great need for a standardized method of evaluation, because it is likely that better-performing methods currently exist, or could be developed, and could take the place of RCA, but with no method of evaluating them it is impossible to know what those methods are. The second important point is that the qualitative assessment offered here – that the results “seem quite poor” – is insufficient. Performance metrics are needed to combine with the methods of testing FDD performance to give more meaningful overall evaluations. Developing such metrics is one objective of the ongoing effort in the current project.
6. CONCLUSIONS
Fault detection and diagnosis (FDD) is increasingly being applied to unitary cooled vapor compression air-conditioning systems, but there is currently no standard method for determining how well the FDD performs. A method has been developed in which data from a library of laboratory experimental results are fed through a candidate protocol and the outputs are compared with the reference values. The data library contains test data from fault-free tests and from tests with one of seven fault types imposed (EA, CA, UC, OC, LL, NC, VL). The results are categorized into five possible outcomes (No Response, Correct, False Alarm, Missed Detection, and Misdiagnosis), and statistics and figures are generated.
A case study shows that the widely used RCA protocol performs poorly, and underscores the need for a standard method of measuring FDD performance. These results also illustrate the need for standardized performance metrics, which can facilitate interpretation of the evaluation results.
NOMENCLATURE
ambient air that enters the condenser (–)
BF bypass factor (–)
CA condenser airflow fault (–) COP coefficient of performance (–) EA evaporator airflow fault (–)
FI fault intensity (–)
FIR fault impact ratio (–)
FXO fixed orifice expansion valve (–)
h specific enthalpy (kJ/kg)
LL liquid line restriction fault (–)
OC overcharge fault (–) NC non-condensable gas (–) 0% 20% 40% 60% 80% 100% 120% 0% 10% 20% 30% 40% 50% % o f re sp o n se s th at a re c o rr e ct Fault Intensity
2470
, Page 10
RTU rooftop unit (–)
SHR sensible heat ratio (–)
T temperature (°C)
TXV thermostatic expansion valve (–)
UC undercharge fault (–)
VL compressor valve fault (–) volumetric flow rate (m³/s)
P pressure drop (kPa)
m mass (kg)
mass flow rate (kg/s)
Q capacity (kW)
wb wet bulb temperature (°C)
capacity regression coefficient (–) COP regression coefficient (–)
humidity ratio (–)
Subscripts
adp apparatus dewpoint
amb ambient
actual measured value byp bypassing the coil charge refrigerant charge
f fictitious
faulted under faulted conditions high-low from condenser to evaporator i coefficient index
LL liquid line lvg leaving the coil N2 nitrogen gas
NC non-condensables
nominal manufacturer’s recommendation ra return air (entering evaporator) ref reference value
unfaulted with no fault present
REFERENCES
Armstrong, P.R., Laughman, C.R., Leeb, S.B., Norford L.K., 2006, Detection of Rooftop Cooling Unit Faults Based on Electrical Measurements, HVAC&R Research, vol. 12, no. 1: p. 151-175.
ell, . ., roll, .A., nig, H., 2012, Experimental Analysis of the Effects of Particulate Fouling on Heat Exchanger Heat Transfer and Air-Side Pressure Drop for a Hybrid Dry Cooler, Heat Transf. Eng., vol. 32 no. 3–4: p. 264–271.
Brandemuehl, M.J., 1993, HVAC2 Toolkit: Algorithms and Subroutines for Secondary HVAC System Energy Calculations. ASHRAE, Inc., Atlanta, GA: 402 p.
California Energy Commission (CEC), 2008, 2008 Building Energy Efficiency Standards for residential and nonresidential buildings. CEC-400-2008-001-CM, California Energy Commission, Sacramento, CA: 176 p. Kim, M., Yoon, S.H., Payne, W.V., Domanski, P.A., 2008, Design of a steady-state detector for fault detection and
diagnosis of a residential air conditioner, Int. J. Refrigeration, vol. 31, no. 5: p. 790-99.
Li, H., Braun, J.E., 2003, An improved method for fault detection and diagnosis applied to packaged air conditioners, ASHRAE Transactions, vol. 109, no.2: p. 683–692.
Rossi, T. M., Braun, J.E., 1997, A Statistical, Rule-Based Fault Detection and Diagnostic Method for Vapor Compression Air Conditioners, HVAC&R Research, vol. 3, no.1: p. 19–37.
Vachtsevanos, G.J., Lewis, F.L., Roemer, M.J., Hess, A., Wu, B., 2006, Intelligent fault diagnosis and prognosis for engineering systems, Wiley, Hoboken, N.J.: 434 p.
Wiggins, M.C. and Brodrick, J.R., 2012, HVAC Fault Detection, ASHRAE Journal, vol. 54, no. 2: p. 78-80. Yang, L., Braun, J.E., Groll, E.A., 2007, The impact of fouling on the performance of filter-evaporator
combinations, Int. J. Refrigeration, vol. 30 (2007), p. 489-498.
ACKNOWLEDGEMENT
The authors gratefully acknowledge support from the California Energy Commission administered through the New Buildings Institute (NBI) and from the National Institute of Standards and Technology (NIST) under grant #104867. In particular we acknowledge the project oversight by Mark Cherniak of NBI and by Drs. Piotr Domanski and Vance Payne of NIST.