Exploring gene expression and protein binding data
for gene regulation
Submitted by
Mohsina Mahmuda Ferdous
For the degree of Doctor of Philosophy of the
Department of Computer Science Brunel University London
2
Declaration
I, Mohsina Mahmuda Ferdous, hereby declare that this thesis and the work presented in it is entirely my own. Some of the works have been previously published; this has been mentioned in the thesis. Where I have consulted the work of others, this is always clearly stated.
3
I dedicate this thesis to parents,
Mohammad Abdul Mannan and
4
Abstract
Gene expression is a tightly controlled process that is regulated by the epigenetic modifications and a series of interactions between the genes and the proteins across the genome. High-throughput technologies such as microarray and chromatin immunoprecipitation technique followed by the next generation sequencing (ChIP-seq) have enabled researchers to investigate the gene expression profile of large of number of genes and the locations of protein bindings and different epigenetic events at the genome-wide scale. To understand the underlying complex mechanisms that regulate gene expression, the computational biology community has proposed many methodologies and tools over the years to integrate the protein binding data; obtained by ChIP-seq and the gene expression data; generated by microarray technology. However, the integrative analysis is still in its infancy. Effective models that capture the complex characteristics of ChIP-seq data and integrate dynamic interactions between gene expression and regulatory factors across different genomic features are still lacking.
This thesis aims to provide robust and reliable methodologies to enable investigation of the relationship between different regulatory mechanisms and gene expression that incorporate the advanced and improved results from the ChIP-seq data and the epigenetic phenomena that are closely related to gene regulation. Here, the Markov Random Field model has been adapted to analyse the binding regions of proteins and epigenetic markers using ChIP-Seq technology where the complex characteristics of the data such as spatial dependency, IP efficiency are taken into consideration while modelling the data and demonstrated how this model along with the pre-analysis steps can improve the binding results. Two models have been proposed where these results are then assimilated in the integrative analyses between ChIP-seq and the gene expression data. Several classification techniques are also included in one of the models to find the association between different epigenetic markers, proteins, genomic features and gene expression profile. The models have been applied to public datasets and the results have been validated. With the proposed models, it has been shown how the
5
dynamic interactions between the regulatory proteins and gene expression can be investigated by integrating sets of genes regulated at successive time-points and different biological or experimental conditions as well as protein binding profiles across the genome.
If either the gene expression or the protein binding data is missing as it is often the case, studying the relationship between regulatory factors and gene expression with these models will help the biologists estimate gene expression from the available epigenetics data or assume the underlying epigenetics from the available gene expression data. In short, this thesis brings together different biological tools, data processing techniques, advanced machine learning techniques to make a systematic approach to advancing the state of the art in this important epigenetic field.
6
Table of Contents
Chapter1 Introduction ... 17
1.1 Background ... 17
1.2 The aim and objectives ... 22
1.3 Contribution to Knowledge ... 23
1.4 Roadmap to the thesis ... 26
Chapter 2 Background ... 28
2.1 A brief Introduction to Epigenetics ... 28
2.1.1 Epigenetics events ... 29
2.1.2 Why Study Epigenetics ... 34
2.1.3 Technologies helping study Epigenetics ... 36
2.2 A Brief Introduction to ChIP-Seq technology ... 38
2.2.1 How ChIP-Seq technology works ... 39
2.2.2 ChIP-Seq Analysis step ... 40
2.2.3 Advantages and limitations of ChIP-Seq technology ... 49
2.3 A Brief introduction to Microarray technology ... 50
2.3.1 How does Microarray technology work? ... 51
2.3.2 Analysis steps of microarray data ... 52
2.3.3 Advantages and limitations of Microarray ... 58
2.4 Integration of Microarray and ChIP-Seq data and challenges ... 59
7
Chapter 3 Adapting Markov Random Field for ChIP-seq data modelling ... 63
3.1 Introduction ... 63
3.2 Background ... 65
3.3 Method ... 67
3.4 Results ... 72
3.4.1 Data ... 72
3.4.2 Pre-processing of the data ... 72
3.4.3 Comparative analysis of the MRF model and the Negative binomial distribution model ... 78
3.4.4 Biological Validation ... 80
3.5 Summary ... 87
Chapter 4 Relationship between gene expression and protein binding ... 90
4.1 Introduction ... 90 4.2 Background ... 91 4.3 Method ... 93 4.4 Results ... 102 4.4.1 Data ... 102 4.4.2 Data Pre-processing ... 102
4.4.3 The results of observing correlations ... 106
4.5 Summary ... 115
Chapter 5 Prediction of gene activity using protein binding profile ... 118
5.1 Introduction ... 118
5.2 Background ... 120
8
5.4 Results ... 136
5.4.1 Datasets ... 136
5.4.2 Data Pre-processing ... 137
5.4.3 Results of running classification on the data ... 141
5.4.4 Comparative performance between three classifiers ... 148
5.5 Summary ... 150
Chapter 6Conclusion and Future Direction ... 153
6.1 ChIP-Seq data analysis ... 155
6.2 Integrative analysis between ChIP-Seq and microarray ... 156
6.3 Future work ... 159
References ... 161
Glossary ... 176
Appendix 1 ... i
9
List of Figures
Figure 1.1: The structure of DNA and its components………... 18
Figure 1.2: Eukaryotic Gene Structure ……….……… 19
Figure 2.1 Chromatin remains in tight structure not to allow transcription and it opens up to initiate transcription ………. 30
Figure 2.2: Schematic of different epigenetic mechanisms ………...…………... 33
Figure 2.3: Possible mechanisms by which epigenetic modification can lead to cancer ………. 35
Figure 2.4: Some technologies available to investigate different epigenetic mechanisms ……… 37
Figure 2:5: Schematic representation of ChIP-Seq technology ……… 39
Figure 2:6: Schematics of analysis steps of ChIP-Seq data ………. 40
Figure 2.7: Per base sequence quality assessed by FastQC ……… 41
Figure 2.8: Different types of enriched regions depending on target proteins ……… 44
Figure 2.9: Forward and reverse read density profile is used to make a combined density profile ………... 45
Figure 2.10: Poisson and Negative Binomial distribution……… 46
Figure 2.11: A typical microarray experiment ………... 53
Figure 3.1: Flow scheme of the main steps in the ChIP-seq procedure………... 64
Figure 3.2: A tabular representation of the count data that is given as the input to the statistical model to analyse the enriched regions ……….. 75
Figure 3.3: Integrated genome browser view of count data in some selected regions ………... 80
Figure 3.4: Distribution of the enriched regions of chromosome 1 and 19 of RNA PolII reported by the NB model and reported by the MRF model ……… 82
10
Figure 3.5: The distribution of binding probabilities of RNA PolII around TSSs in
chromosome 1 and 19 resulted by the NB model and by the MRF model……… 83 Figure 3.6: Frequency of counts in Chromosome 2 ………. 86 Figure 3.7: A tabular representation of the tag counts at the genomic position
from co-ordinate 98502200 bp to 98507400 bp at chromosome 2 of ChIP-seq
data for protein CDK9 ……….. 86 Figure 4.1: A general structure of a eukaryotic gene with all its elements
including transcription start and stop sites……….. 90 Figure 4.2: Proposed model to find correlation between differential expression
and differential binding ……… 95 Figure 4.3: Upregulated and downregulated genes by LPS and IBET at (left) 1
hour and (right) 4 hour time points ……… 104 Figure 4.4: Average profile of the ChIP peaks binding to TSS region ………... 107 Figure 4.5: Plots to show the correlation between downregulation of genes with
downregulations of bindings ……… 110 Figure 4.6: Plots to show the correlation between upregulation of genes with
upregulations of bindings ………... 113 Figure 5.1 Schematic representation of how regulatory proteins bind at different genomic locations to initiate the transcription ………. 118 Figure 5.2: Proposed model to predict gene response from binding profile of
proteins at different genomic features ……… 122 Figure 5.3: Workflow of building a classification model and a general Approach
of how to evaluate performance of a classification model ……….. 129 Figure 5.4: A fully connected neural network is made up of input units, hidden
units and output units ………... 131 Figure 5.5: Feature distribution of the binding regions of the proteins ………. 138 Figure 5.6: Resulted decision tree where leaf nodes represent class of the genes
and the root node and internal nodes represent binding of protein at promoter
11
Figure 5.7: Resulted decision tree where leaf nodes represent class of the genes and the root nodes and internal nodes represent binding of protein at different
genomic region (promoter, exon etc) ……… 144 Figure 5.8: Resulted decision tree where leaf nodes represent the class of the
genes and the root node and internal nodes represent binding of protein at
promoter at different time points ……….. 145 Figure 5.9: Importance of variables by random forests ………... 149
12
List of Tables
Table 2.1: Some important enzymes along with the types of modifications they
cause and their effects on gene expression………..………... 31 Table 2.2: Summary of some of the popular peak calling tools………...… 48 Table 3.1: Percentage of sequences that are aligned per ChIP-seq dataset using
Bowtie………. 73
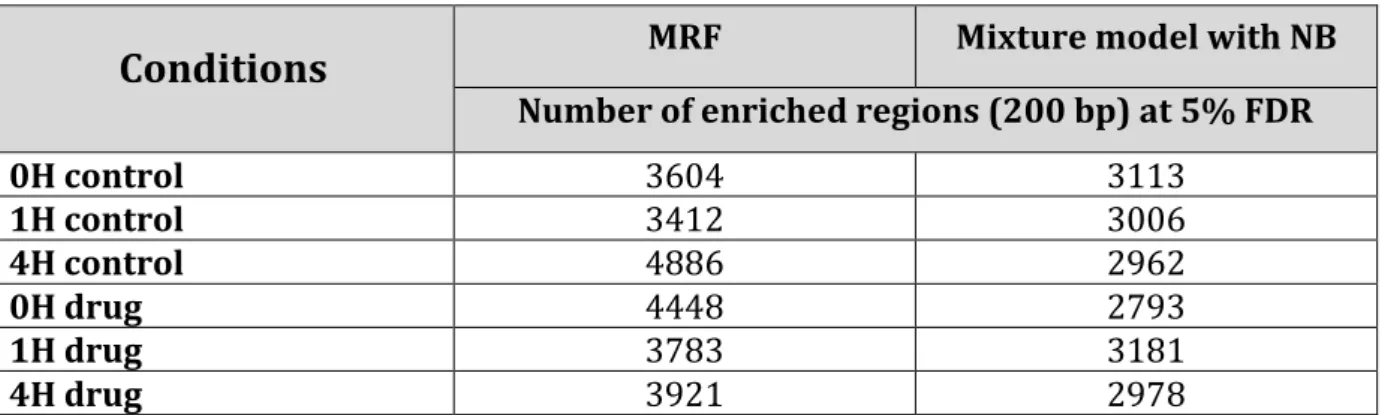
Table 3.2: The number of 200bp enriched regions found by the MRF and the NB
models at 5% FDR………...……… 79
Table3.3: Number of unique regions found by the MRF and the NB models……….. 79 Table 3.4: The number of enriched regions found for RNA PolII reported by the
MRF and the NB models……….. 81
Table 3.5: Percentage of promoters found in enriched regions of RNA PolII
reported by the NB and the MRF models……….. 81 Table 3.6: The comparative analysis results between joint and separate modelling
techniques of the ChIP-seq data………. 85
Table 3.7: The enriched regions found by the MRF model at 5% FDR in the
ChIP-seq data with and without the unusual counts in the concentrated regions……..… 87 Table 4.1: The number of the enriched regions found at 5% FDR at LPS stimulated
data at 4 hour time point………. 106
Table 4.2: The number of sites around TSSs associated with downregulated genes
that show downregulation of bindings of proteins………. 108 Table 4.3: The number of sites around TSS associated with upregulated genes that show upregulation of bindings of proteins……… 109 Table 4:4: The correlation results for differential expression and differential probabilities around TSSs for downregulated genes at 4 hour time point…………... 111 Table 4:5: The correlation values between differential expression and differential
probabilities around TSSs for upregulated genes at 4 hour time
point………. 114
Table 4.6: The average changes in protein binding probabilities around TSSs of
upregulated and downregulated genes at 4 hour time point………... 114 Table 5.1: The number of enriched Regions found at 5% FDR from LPS stimulated
13
Table 5.2: Correlation values of binding profile of different proteins at different
genomic features with state of the genes………..……... 139 Table 5.3: Performance of neural network in terms of accuracy (%) after 10-fold
cross validation……….. 141
Table 5.4: Performance of neural network in terms of accuracy (%) after 10-fold cross validation………. 141 Table 5.5: The performances of different classifiers in terms of accuracy after the 10-fold cross validation……… 148 Table 5.6: The performances of decision tree and random forests in terms of accuracy after the 10-fold cross validation………... 149
14
List of Algorithms
Algorithm 3.1: Pseudocode for analysis of ChIP-seq data……….. 68
Algorithm 3.2: Pseudocode for generating count data……… 69
Algorithm 4.1: Pseudocode for implementation of the major steps of the model…... 97
Algorithm 4.2: Pseudocode for analysis of the microarray data……… 98
Algorithm 4.3: Pseudocode for analysis of ChIP-seq data………. 99
Algorithm 4.4: Pseudocode for generating the enrichment probability around TSS……… 100
Algorithm 5.1: Pseudocode for implementation of the major steps of the model………. 123
Algorithm 5.2: Pseudocode for analysis of microarray data……… 124
Algorithm 5.3: Pseudocode for analysis of ChIP-Seq data………. 126
Algorithm 5.4: Pseudocode for creating binding profile of proteins………... 127
15
Acknowledgements
First of all, I thank God for His blessings throughout my life to become the person that I am today. It was His guidance that made it possible for me to complete this work.
I would like to express my heartiest gratitude to my supervisor Xiaohui Liu, for his affectionate supervision, assistance, motivation and encouragement throughout this work. His methodology and patience have left a deep impression upon me. I would also like to thank David Gilbert and Paul Wilson for their guidance and would like to gratefully mention Veronica Vinciotti and Yanchun Bao for their advices and support throughout this PhD.
I would like to thank my family and friends for their support through my years as a PhD student. Very special thanks go to my husband Dr. M Hasan Shaheed who always encouraged me to get a PhD degree and it was his support that got me through the difficult days when I thought I could not do it. I would also like to thank my parents for not only being the constant source of support but also for taking care of my son so that I could finish the study. I would like to thank my sisters, Mity and Mahdia, for being there for me whenever I needed them. I would like to thank my daughter, Nuaimah, for being the joyful distraction from work and my son, Umair, who has made the biggest sacrifice for this PhD, staying with my parents since his birth five thousand miles away.
I also thank all my colleagues for their support including Neda Trifonova, Valeria Bo, Fadra Hassan, Djbreel Kaba, Miqing Li, Liang Hu, Izaz Rahman, Chuang Wang, Ali Tahrini and Khalid Eltayef.
Finally, I would like to express my gratitude to the EPSRC and GlaxoSmithKline, who through their funding have made this research possible.
16
Supporting publication
1. Ferdous M.M., Vinciotti V., Liu X., Wilson P. (2015) Exploring the link between gene expression and protein binding by integrating mRNA microarray and ChIP-Seq data. Statistical Learning and Data Sciences, Lecture Notes in Computer Science Volume 9047, pp 214-222
2. Ferdous M.M. (2016) Modelling ChIP-Seq Data using Markov Random Field model. Brunel Doctoral Consortium. (Awarded as the best paper)
3. Ferdous M.M., Vinciotti V., Liu X., Wilson P. “Prediction of underlying gene expression variance using genome-wide protein binding profile”. (To be submitted in BMC Bioinformatics)
Chapter
1
Introduction
1.1 Background
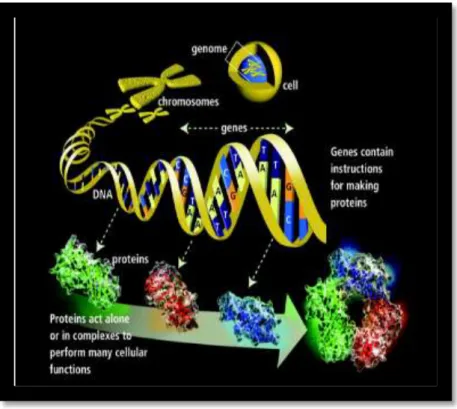
In 1953 when American biologist James Watson and English physicist Francis Crick declared in a Cambridge pub that they had ‘found the secret of life’, their claim wasn’t far from the truth. They indeed had solved the mystery of science of how genetic instructions were stored in any organism and transferred from one generation to another by discovering the structure of DNA [Watson et al. 1953]. DNA or deoxyribonucleic acid is the chemical compound that contains four basic building blocks or bases namely: adenine (A), cytosine (C), guanine (G) and thymine (T). The orders or the sequences of these bases form the instructions for making all the essential proteins in our bodies needed for the development of all living organism. These proteins perform essential functions in our body as enzymes, hormones and receptors. An organism’s complete set of DNA is called its genome. Figure 1.1 demonstrates the structure of DNA and its components.
However, later with the flourish of the new science of epigenetics, researchers have realised DNA sequence is not the only factor that controls our biological make-up and in addition to nature and nurture, what makes us who we are is also determined by some tightly regulated chemical reactions that can switch parts of the genome off and on at strategic times and locations. These parts of the genome are genes that contain instructions to synthesise the gene products, typically proteins. The process in which information of genes is used to synthesis of these gene products is called gene expression. The chemical reactions mentioned above and bindings of regulatory proteins or transcription factors (TFs) occur at specific sequences of DNA to control gene expression so that the exact amount of proteins is produced when they are needed. Epigenetics is the study of these reactions and the factors that influences gene activity but does not involve a change in underlying DNA sequence.
18
Figure 1.1: The structure of DNA and its components. Gene is a unit of heredity which is composed of DNA occupying a fixed position on a chromosome that holds the instructions for creating proteins. Genome is defined as a group of all genes comprising of a set of chromosomes[Cheng 2006].
The transcription of the gene specifying a particular protein is a tightly controlled and complex process that intimately occurs in a context. To understand the process one must investigate what role the context plays in this process. The discovery of the complexity of the regulation mechanisms of gene expression has led the scientists to review their definition of gene and it is no longer viewed as a solo well-defined unit of DNA that contains specific information that is translated into proteins [Michel, 2010]. It is now recognised that all the developmental works in our body do not just rely on genes for protein production, rather the mechanism is much more complicated. A complex set of interactions between genes, RNA molecules, protein (including transcription factors) as well as the interactions of genes with their proximal and distal environments [Wright 1968] determine when and where specific genes are activated and the amount of protein or RNA products is produced.
19
However, for these interactions to happen, first the specific DNA sequence or gene needs to be opened up, which otherwise remains in an inactive state because it is tightly wound up in a structure called chromatin. Different chemical modifications also known as epigenetic mechanisms such as histone modification, DNA methylation and acetylation can alter the chromatin structure and make it accessible or inaccessible for transcription. These mechanisms occur at specific locations of the genome and these regions play important roles in gene regulation too.
Structural genes that code for proteins involve several different components such as introns and exons. Introns are the portions of the gene that do not code for amino acids and exons are the portions that do and also collectively determine the amino acid sequence of the protein product. There are also regulatory regions of the gene, such as, transcription start site, promoter, enhancer and silencer etc. These are the regions where different proteins bind and chemical modifications occur to interact with the genes to control transcriptional activity. Figure 1.2 shows the structure of eukaryotic gene with different regulatory element. Therefore different epigenetic mechanisms and other proteins or transcription factor binding patterns around these regions are of interest to the researchers to figure out which regions are important for the gene regulation.
Figure 1.2: Eukaryotic Gene Structure with its component such as promoters, exons, introns etc [Eukaryotic gene structure].
20
Understanding and investigating all these epigenetic factors that regulate genes are critical in unravelling the complexity of various biological processes. Undue disruption of these processes can also lead to many diseases, some of which are life threatening. Therefore it is absolutely vital to study how genes are regulated and what controls gene expression. And that is what has made epigenetics a subject that is undergoing intense study among scientists. There are many technologies available today for studying different epigenetic mechanisms and gene expression. Two such high-throughput biological technologies are, microarray, which measures the expression level of large number of genes simultaneously, and chromatin immunoprecipitation technique followed by next generation sequencing (ChIP-Seq), which investigates the locations of proteins or transcriptions factors bindings and epigenetic modifications across genome. In ChIP-Seq technology, a protein of interest is usually cross-linked with DNA site it binds to in an in vivo environment using formaldehyde. After the crosslinking is done, then the DNA is sheared by sonication or other mechanism. The next step is immunoprecipitation. From the resulting DNA strands and Protein of interest and DNA component, crosslinked DNAs are filtered out with antibody by the immunoprecipitation technique. Once the enrichment is convincing, the material is ready to be sequenced. The cross-linking of the protein and DNA is reversed and the DNA is purified and sequenced. These sequences are then further analysed to find the genomic locations that are bound by the protein under study.
The microarray experiments that analyse expression levels of selected gene involve the hybridization of an mRNA molecule to the DNA template from which it is originated. In this technique, an array is used where thousands of spotted samples known as probes are immobilized on a solid support, typically a microscope glass slide. The amount of mRNA bound to each site on the array indicates the expression level of the various genes. Finally the data is collected and processed to generate a profile for gene expression. Both DNA microarray and ChIP-Seq have become indispensable tools in genome research as they both immensely help find out structural and functional characteristics of different genomes.
21
Next generation sequencing, no doubt has several advantages over microarray analysis, but microarray has its advantages too, which still makes it desirable for many studies. Microarray is an established tool with its mature analysis pipeline and it is a comparatively low cost experiment too. However, with microarray detailed underlying epigenetic landscape cannot be determined. On the contrary, ChIP-Seq offers detailed characterization of various types of chromatin marks on a genome-wide scale, but ChIP-Seq experiments are very costly and the analysis techniques are still evolving. Therefore, one might think that microarray will soon be replaced by these new sequencing technologies, experts rather think the cost-effectiveness and simplicity will play in its favour. Some also have suggested that microarray and ChIP-Seq should be integrated to study the gene regulation pattern and investigate whether microarray data alone can be used to predict underlying epigenetics. Experts have predicted that in the near future, these two technologies may complement each other and form a symbolic relationship [Hurd et al. 2009]. Integration of the result of these two technologies is biologically very significant as it enables the investigators to study how different epigenetic modifications and protein bindings are occurring across genome to control gene expression.
The integration techniques for both technologies are still at its infancy and researchers are working relentlessly to come up with different methodologies so that robust information can be achieved from such study. With the dawn of ChIP-Seq technology, researchers have begun to unravel how different epigenetic mechanisms and bindings of regulatory proteins work together to regulate genes. This has opened up possibility for not only getting new insights into the functional genomics of every living cell but also discovering drugs and treatments to diseases that are caused by disruption of normal regulation process. However, this exciting technological infancy comes at a price too.
ChIP-Seq data has very complex characteristics. To get robust information about protein binding locations, these characteristics need to be considered while modelling ChIP-Seq data. However, most of the integration methodologies of ChIP-Seq and gene expression
22
data, to date, have used very basic analysis steps which may not capture all the information this next generation sequencing technology can offer.
With the advancements of different genome projects, more and more genomic locations are identified and annotated and rich datasets are produced. This progress enables researchers to investigate what roles different biological conditions such as treatment, non-treatment, time factors and also different genomic locations play role in gene regulation. There are still gaps in the literature where all these information are incorporated into the methodology to find the relationship between gene expression and epigenetic mechanisms. In most of the integrative study, protein binding at very common genomic locations such as promoters and transcription start sites are investigated, whereas experts have discovered that other genomic features underlie epigenetics too [Nott et al. 2003; Heyn et al. 2014].
Here in this thesis, the focus is on improved results from ChIP-Seq data and integrating the results of microarray and ChIP-Seq to find the relationship between gene regulation and epigenetic mechanisms. With this in mind, different methodologies have been proposed to study such relationship where advanced analysis techniques of ChIP-Seq data, proteins bindings at different genomic features, different biological conditions and time-factors relevant to underlying epigenetics are incorporated effectively.
1.2 The aim and objectives
The main aim of this project has been to search for effective ways of integrating protein binding and gene expression data to understand the underlying epigenetic mechanisms that regulate gene expression.
When this work began, the research community had already been excited about the ChIP-Seq technology and its potential to uncover underlying epigenetics. However as more datasets were made publicly available and genomic databases were updated, this field showed further potential for advancements to be made in the integrative analysis between ChIP-Seq and microarray data. The project started with the primary aim in
23
mind that was to use advanced computational methodology to analyse comparable datasets from both technologies, microarray and ChIP-Seq obtained in the same biological settings and investigate how to effectively integrate both data to describe different epigenetic events that regulates gene expression.
The main objectives of the thesis are as follows:
1. Acquiring comparable datasets from both technologies obtained in the same biological settings.
2. Exploring the complex characteristics of ChIP-Seq data to find the most appropriate means for data pre-processing and effective modelling
3. Investigating techniques that integrate protein binding and gene expression data to uncover hidden relationships between them.
4. Understanding whether protein binding profile across genome can be predictive of gene expression changes thus finding associations between different epigenetic events and gene regulation.
1.3 Contribution to Knowledge
In this thesis, ways of modelling ChIP-Seq data have been explored where different characteristics of such data are taken into consideration. The Markov Random Field (MRF) model has been adapted for the analysis of ChIP-Seq data and comparative performance analysis has been carried out between the MRF model and other existing methods. One of the characteristics of ChIP-seq count data is that it is known to have spatial dependencies between regions. The reason is that a common pre-processing step to create count data is to divide the genome into fixed length windows and the count of sequences are summarised per window. As a result the bound regions can cross between two or more windows and that introduces spatial dependencies in the data. Another important characteristic of ChIP-Seq data is IP efficiency. The degree of enrichment found from the data depends on ChIP-efficiency or otherwise known as IP efficiency that means an efficient experiment will produce better signal to noise ratio than a less efficient one. The quality of antibodies plays an important role to determine the quality of the data. ChIP-efficiency also varies between data generated in different
24
lab or experiment. Therefore when differential regions are sought between two experimental data, not considering efficiency may lead to over or under estimating the regions. These characteristics such as spatial dependency and IP efficiency have been incorporated in the ChIP-Seq analysis in this thesis which shown to improve the result. Pre-processing steps of the ChIP-Seq data before running statistical analysis to find the protein binding locations have been demonstrated to have great impact on the overall performances. It has been shown how the count correction step can further improve the results. The results have been validated using known biological information.
The next step in the study has been to find the effective way of integrating ChIP-Seq protein binding result with complementary microarray expression data. As most of the integrative analyses of these two ignore many important characteristics of ChIP-Seq data, I have proposed a method to integrate these characteristics of ChIP-Seq with the MRF model first. In this model the correlation between the differential binding probabilities for different proteins around transcription start sites (TSSs), estimated by the MRF model and microarray differential gene expression values associated with those TSSs, are investigated together. Using enrichment probabilities directly has the advantages of capturing many characteristics of ChIP-Seq data as opposed to using count data directly. Also the technique incorporates different biological conditions and time factors; therefore it can be applied to rich dataset that includes such variables. I have validated our results on the proteins investigated with known biological information in the field.
A novel approach is then proposed to investigate advanced machine learning techniques to find relationships between gene expression and protein binding profile across a genome where different genomic features such as exons, introns, distal intergenic along with promoters are integrated. It has been explored how predictive the binding profile of the proteins of interest at different features is of gene activity using several classification techniques such as neural network, decision tree and random forests. Other biological conditions such as treatment, non-treatment, time factors are also included in the model. Feature selection techniques by decision tree and random forests have identified important proteins, features and biological factors
25
that mostly correlate with gene regulation among all the variables. Comparative analysis of different classifiers is also conducted to determine which one performs best at detecting potential relationships. It is anticipated that this study will provide a foundation for further opportunities for finding association between protein binding and gene expression where it can be investigated thoroughly how different proteins binding at different genomic features and the other factors such as time play role in the gene regulation mechanism.
Although the methods described above have been applied to a time-series ChIP-Seq data of six proteins and microarray data that are obtained with same biological conditions such as treatment and control, the methods can be applied on new datasets involving any number of proteins and biological conditions. It is believed with richer datasets the underlying epigenetic factors that are regulating gene expression are likely to be more apparent and also with this technique, genomic features other than promoters and TSS that are commonly used can be investigated for their roles in gene regulation. In future as genomic databases are updated and new annotations of more genomic feature are made available, this technique can help investigate their functionality in our biological process.
Major contributions of the thesis can be summarised as follows:
Important insights have been obtained on how data pre-processing, particularly how to prepare the count data of ChIP-Seq experiments, can further improve the analysis results. (Chapter 3)
The MRF model has been adapted for the analysis of real ChIP-Seq data and a comparative study has been conducted between this method and other existing algorithms to understand its strengths and weaknesses. (Chapter 3)
A novel approach has been proposed where advanced analysis result of ChIP-Seq are incorporated in integrative analysis of protein binding and gene expression data to study the relationship between differential expressions and differential protein bindings around the transcription start site. In this approach
26
it has been demonstrated how enrichment probabilities estimated by an advanced method that first incorporates all the characteristics can be generated around any genomic location to study its role in gene regulation. Different biological conditions and time factors are also included in the model. (Chapter 4)
A methodology has been proposed to investigate how predictive the binding profile of different regulatory proteins at different genomic locations across genome is of gene activity. Experiments have been conducted using advanced machine learning technique to perform predictive analysis using protein binding profiles as a predictor and gene expression responses as a response to study which proteins at any binding location can best predict the gene status. (Chapter 5)
It has been shown how dynamic interactions between regulatory proteins and gene expression may be explained by integrating sets of genes regulated at successive time-points and different biological or experimental conditions. This technique may help answer not only what proteins might be regulating genes but also where, when and at what condition they bind to do so. Comparative analysis between the classifiers has also been performed and the results are documented. (Chapter 5)
1.4 Roadmap to the thesis
The thesis is arranged as follows.Chapter 2 provides general background knowledge relevant to each chapter of the thesis. It briefly introduces epigenetics, different epigenetic mechanisms and technologies that are currently aiding epigenetic studies. Mainly I focus on microarray and ChIP-Seq technology which are extensively used in this project to study biological phenomena such as gene expression changes and protein binding and also to investigate the relationship between them.
27
Chapter 3 gives some background information about the pipeline of ChIP-Seq analysis and how different characteristics of ChIP-Seq affect the peak results. Different techniques including those for data pre-processing are introduced in this chapter to obtain robust results from ChIP-Seq data. A MRF model is adapted for the analysis of the ChIP-Seq data used in this project. Experiments detailing the parameter sensitivity on the results obtained and those comparing this method with other existing methods are reported.
Chapter 4 presents a methodology that shows how ChIP-Seq data can be analysed using advanced methods that deal with different characteristics i.e. spatial dependency, overall distribution of the data and how this information in terms of enrichment probability can be incorporated in the integrative analysis of protein binding and gene expression data. It has also been shown how differential expression and differential bindings can be investigated around any genomic locations between different conditions such as time, treatment/non-treatment.
Chapter 5 reports a novel approach where the integrative analysis of protein binding and gene expression data incorporates binding locations at different genomic features such as exon, intron, promoters, distal intergenic region etc. and also other biological conditions such as treatment/non-treatment, time factors etc. The method and results show how dynamic interactions between regulatory proteins and gene expression can be explained by running predictive analysis on protein binding profiles across genome and complementary gene expression results. Several classification techniques, such as neural network, decision tree and random forest have been explored to find such associations.
Chapter 6 provides discussions of the work proposed in this thesis and highlights future research directions currently under investigation.
Chapter 2
Background
In this chapter many of the relevant terminologies, technologies and their respective associated analysis techniques will be briefly introduced. It is not in the scope of this chapter to present an overall review of the field, rather it is a concise introduction of the key biological concepts of the respective relevant subjects to enable an appreciation of the key concepts of the respective ‘omics’ technologies . However, references will be given throughout the chapter so that anyone who is interested can investigate further. This project is focused on studying the relationship between epigenetic mechanisms and gene expression using different technologies such as microarray and ChIP-seq. This chapter will start with brief introduction of epigenetics, followed by description of those technologies and the available analysis techniques.
2.1 A brief Introduction to Epigenetics
In the 1950s and 60s when the genetic code and the structure of the genes were unravelled, scientists began to see genes as a collection of blueprints for proteins that are essential for the development and maintenance of any organism. Genes, can be conceptually thought of as a string of DNA that is capable of producing chains of amino acids that fold to from functional proteins, Some genes are constitutively active or ‘on’ regardless of organism’s environment carrying out essential functions for our body, however, not all genes are always on or expressed to produce proteins and they only become active by some tightly regulated mechanisms when it is necessary for any specific biological process [Hoopes 2008]. Different chemical reactions and bindings of regulatory proteins at different genomic locations work together to turn the genes on or off at strategic times and locations and control the gene expression mechanism so that our body can have the right amount proteins when they are required. Epigenetics is the study of all mechanisms that control gene expression levels and the factors that
29
influence them. Genetics and developmental biology were perceived as two separate research areas in the past. Developmental biologists or embryologists did not have much interest in genes and their roles; towards the middle of the twentieth century some leading biologists were waking up to the notion that these two fields were actually linked. Waddington being an expert on both fields defined epigenetics linking developmental biology and genetics together [Holliday, 2006]. In 1942, Conrad Waddington defined the term epigenetics as “the branch of biology which studies the causal interactions between genes and their products, which bring the phenotype into being”. The first concepts of epigenetics can be dated back as far as Aristotle (384-322 BC) and it continued as a conceptual theme through to the mid-19th century. However, slowly epigenetics has emerged to bridge the gap between nature and nurture. Today the most common definition describes epigenetics as ‘the study of heritable changes in genome function that occur without a change in DNA sequence’ [Riggs et al. 1996]. More recently however, Berger et al. [2009] has added a constraint to the definition that the initiation of the new epigenetic state should involve a transient mechanism separate from the one required to maintain it.
2.1.1 Epigenetics events
Deoxyribonucleic acid or DNA is the hereditary material, found in almost every organism. The structure of DNA is very complex and large and it is composed of several building blocks called nucleotides. In order to take less space in the cell, DNA is wrapped around histone proteins in repeating units of nucleosomes to form a structure known as chromatin [Campos et al. 2009; Fedorova et al. 2008]. This structure provides the first level of compaction of DNA into the nucleus. To achieve higher level of compaction, nucleosomes are sometimes spaced along the genome to form a nucleofilament that finally results in the highly condensed metaphase chromosome and chromatin is organized into functional territories within an interphase nucleus.
Change in the structure of chromatin plays a crucial role in whether transcription is allowed which is basically the first step of gene expression mechanism. In gene
30
transcription process, a particular segment of DNA is copied into RNA (mRNA) by the enzyme RNA polymerase. Both RNA and DNA are nucleic acids, which use base pairs of nucleotides as a complementary language. Chromatin adopts different conformation in different contexts, for example; in different cell types. In simple words, chromatin can be in the open form that allows access of the machinery for transcription, and a closed form which does not allow transcription. Therefore as alteration of chromatin structure control gene expression, the events that are responsible for such alteration can be considered epigenetic events. Figure 2.1 shows how chromatin can be in open or closed form to control gene expression.
Figure 2.1 Chromatin remains in tight structure not to allow transcription and it opens up to initiate transcription [Carmona 2015]
When a specific sequence of DNA or gene is compactly bound with histone, that gene remain inactive or "off." However, the area where transcription should occur needs to be unbound or open before transcription process can start. This is a very multifaceted process that requires coordination of many mechanisms such as, histone modifications,
31
transcription factor binding and other chromatin remodelling activities. Histone modifications is the chemical modification of the histones' NH2-terminal tails and as a result of such change, DNA becomes unwound which allows its access to the transcriptional machinery [Karlic et al, 2010].
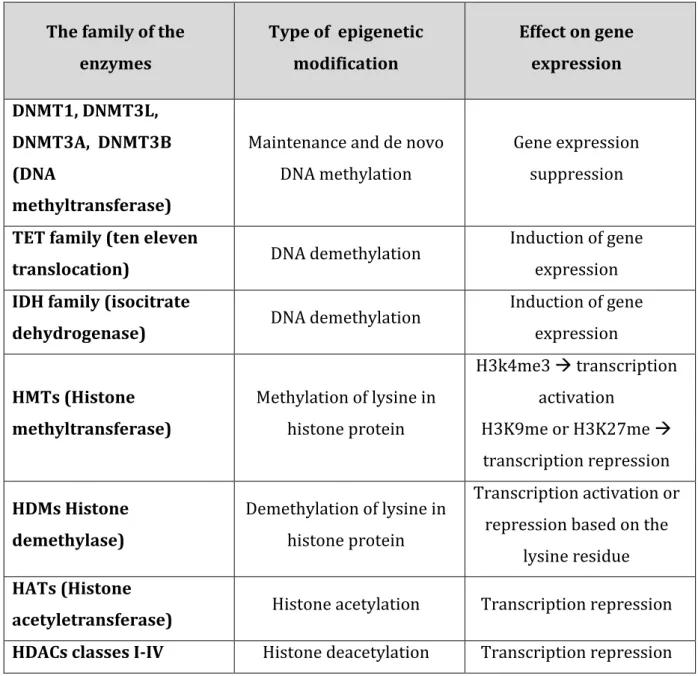
The family of the enzymes Type of epigenetic modification Effect on gene expression DNMT1, DNMT3L, DNMT3A, DNMT3B (DNA methyltransferase)
Maintenance and de novo DNA methylation
Gene expression suppression
TET family (ten eleven
translocation) DNA demethylation
Induction of gene expression
IDH family (isocitrate
dehydrogenase) DNA demethylation
Induction of gene expression HMTs (Histone methyltransferase) Methylation of lysine in histone protein H3k4me3 transcription activation H3K9me or H3K27me transcription repression HDMs Histone demethylase) Demethylation of lysine in histone protein Transcription activation or repression based on the
lysine residue
HATs (Histone
acetyletransferase) Histone acetylation Transcription repression HDACs classes I-IV Histone deacetylation Transcription repression
Table 2.1: Some important enzymes along with the types of modifications they cause and their effects on gene expression.
32
The chemical modification of the histone proteins can be caused by methylation and acetylation. The common types of such chemical modifications, enzymes involved in such modifications and their effect on gene regulation have been summarised in Table 2.1 [Abdolmaleky et al. 2013]. DNA methylation is a biochemical process that also forms the basis of chromatin structure, which enables a single cell to grow into different organs or different tissues. This DNA methylation process is important for the regulation of cellular differentiation and development, and can also serve as a biomarker for several human diseases. The important role of DNA methylation or demethylation in developmental biology was first proposed in 1969 [Grifith et al. 1969]. Scientists then suggested that DNA methylation can affect gene expression [Riggs et al. 1975; Holliday et al. 1975]. This mechanism usually appears to be coordinated with histone modifications, particularly those that lead to silencing of gene expression. However, when the tails of histone molecules are acetylated it removes positive charges, thereby reducing the affinity between histones and DNA thereby leaving it more open. In most case histone acetylation enhances transcription. Transcriptionally active, “open” chromatin generally has hyperacetylated and hypomethylated histones, whereas more inactive heterochromatin tends to be hypoacetylated and hypermethylated [Wild et al. 2010].
In addition to DNA methylation and histone modifications there are other mechanisms which also affect gene expression. For example, Eukaryotic genomes transcribe large numbers of RNAs that have no coding capacity. These noncoding RNAs include miRNA, piRNA etc. Chromosomal regions that are located far from each other can interact, in effect leading to the alternation of gene expression. This type of direct interaction can contribute to gene activation or repression by facilitating regulatory elements, influencing transcriptional state of associated genes [Grimaud et al. 2006; Lonvardas et al. 2006]. Therefore; the interactions between these chromosomal regions can be termed as epigenetic mechanisms. Figure 2.2 shows different epigenetic mechanisms. For example if DNA methylation Methyl marks added to certain DNA bases, it can repress gene activity, while histone modifications refer to covalent post-translational modification of N-terminal tails of four core histones (H3, H4, H2A and H2B).
33
Eukaryotic genomes also transcribe large numbers of RNAs that have no coding capacity.
Figure 2.2 Schematic of different epigenetic mechanisms. Histone modification is the process in which several types of modification occur to amino terminals of the core histones to initiate transcription. DNA methylation is process by which methyl groups are added to DNA to regulate gene expression. RNA mediated gene silencing mechanisms also regulate genes [Hagood 2014].
Once the chromatin is in open form, specific DNA sequences are then accessible for specific proteins to bind. These proteins then act as activators or repressors for the genes and control gene expression. For a TF that is an activator, the effector region recruits RNA polymerase II which is the eukaryotic mRNA-producing polymerase that initiates transcription of any corresponding gene. These regulatory proteins bind at different locations of the genome, (i.e promoters, that resides just upstream of
34
eukaryotic genes or enhancers, which can be oriented forward or backwards and are found upstream or downstream of transcription start sites) and activate gene expression. TFs have been observed to concurrently activate and repress multiple genes simultaneously.
Many genes are regulated together therefore studying gene expression across the whole genome via microarrays or massively parallel sequencing allows investigators to see which groups of genes are co-regulated given any particular biological state. Investigating the pattern of epigenetic mechanisms and regulatory proteins bindings across genome with next generation sequencing coupled with the gene expression study can tell us how exactly these genes are regulated.
2.1.2 Why Study Epigenetics
A eukaryotic cell requires different proteins in defined concentration at different times. That is why gene expression is one of the most tightly controlled processes in the body as any disruption to this protein making process can lead to serious consequences including disease conditions. Therefore it is absolutely vital to study how the genes are regulated and what controls gene expression which has made epigenetics such an interesting topic among scientists. Epigenetic changes are absolutely vital for our normal and healthy development; however they can also be the cause for many disease states. If normal epigenetic alterations of any of the systems that contribute to gene regulation is disrupted, that can be fatal and cause abnormal activation or silencing of genes. Such disruptions have been associated with many life-threatening diseases such as, cancer, syndromes involving chromosomal instabilities, and mental retardation [Portela et al. 2010]. By studying these epigenetic mechanisms one can understand how, why or where these changes are happening, what diseases they are causing, etc. Cancer was the first human disease to be linked to epigenetics. Studies performed by [Feinberg et al. 1983], using primary human tumour tissues, found that genes of colorectal cancer cells were substantially hypomethylated compared with normal tissues. Another example can be given about prostate tumour where the enzymes that
35
modify histones behave differently as tumours progress. Scientists can better understand potential disease conditions by looking at the way histone tails have been systematically modified in tumours from different patients. Apparently patterns of global histone modification can serve as an indicator for the future course of disease. Such epigenetic profiling of cancers, coupled with our knowledge of functional mutations, could pave the way for personalising cancer treatments in the near future.
Figure 2.3 Possible mechanisms by which epigenetic modification can lead to cancer. (A) An undue methylation of a gene can cause disruption to transcription. As a result cells can be damaged and become cancerous. (B) A gene can also be demethylated when it is not required and the demethylation can initiate transcription and cause unnatural cell growth [Nelson 2008].
Figure 2.3 shows how epigenetic modification can lead to cancer, for example a previously unmethylated TS gene can be methylated and thus transcription factor(s) (TF) can no longer bind the promoter region, as a result the gene is not expressed, and damaged cells are allowed to proliferate and become cancerous. In other occasions, if a proto-oncogene can be demethylated, allowing TFs to initiate transcription and express the protein product, which can also lead to unnatural cell growth and cancer.
36
As many diseases are related to epigenetic changes, researchers are investigating if it is possible to counteract these modifications with epigenetic treatments. The most popular of these treatments aim to alter either DNA methylation or histone acetylation. Furthermore, epigenetic behaviours are understood to be reversible and therefore provide opportunities for novel therapeutic intervention in a number of chronic inflammatory diseases.
In Epigenetics studies, there are a number of issues that must be considered. Firstly, in genetic studies, scientists can collect DNA sample from any tissues and analyse them, however epigenetics studies are different in that respect. As epigenetic profiles may vary depending on the cell types, scientists need to collect samples from tissues and organs that are relevant to the phenotype of interest. For example, in order to study inflammatory bowel disease, samples must be collected from gut. Secondly the relationship between epigenetics and phenotype are not always straightforward, however, studying tissues of affected and unaffected subjects and keeping the study perspective may help identify the differences between causal associations and non-causal associations [Petronis 2010]. Currently there are many technologies are available for a close study of these relationships.
2.1.3 Technologies helping study Epigenetics
Epigenetics research continues apace in labs investigating a dazzling variety of topics. Many Bioinformatics tools have been proposed along with different experimental methodologies to analyse the epigenetic mechanisms [Bock et al. 2008; Lim et al. 2010; Laird 2010].One interesting direction is the application of high-throughput sequencing technologies to the characterization of hundreds of ‘epigenomes’ (epigenetic marks across the entire genome). Patterns of DNA methylation, six histone modifications, couple with gene activation from various normal and diseased cell types can serve as a baseline in many studies to identify changes associated with specific diseases.
37
Figure 2.4: Some technologies available to investigate different epigenetic mechanisms [Technologies for studying epigenetics].
There are many technologies available for studying epigenetic modifications and gene expression. Figure 2.4 summarises several technologies that are used to investigate different epigenetic mechanisms. For example, methylation-specific PCR(MSP) provides the test for the methylation status of CpG dinucleotides in a CpG island making the technique applicable for high throughput analysis of clinical samples [Herman et al. 1996; Shanmuganathan et al. 2013; Wani et al. 2016], whole genome bisulfite sequencing enables differentially methylated sites to be detected on the genome at single nucleotide resolution [Frommer 1992], chromatin immunoprecipitation technique such as ChIP-on-chip is a microarray method that reveals the genome-wide location of DNA-bound proteins [Ren 2000] and MeDIP-seq [Jacinto et al. 2008; Down et al. 2008] is another technology available that can be used to detect or analyse DNA methylation. Microarray technology, which measures the expression level of large number of genes simultaneously, has been an established platform for studying epigenetic analysis for a long time now. ChIP-Seq, which is
38
comparatively a new technology, produces DNA sequences that are bound by a protein of
interest or other cellular markers. It offers high resolution mapping of TFs or epigenetic modifications’ interaction sites to genomic locations [Furey 2012]. It is now an indispensable tool in medical and biological fields. As Microarray and ChIP-Seq are the two main technologies used in this thesis to analyse the relationship between gene expression and protein binding. A brief introduction of both technologies is given below.
2.2 A Brief Introduction to ChIP-Seq technology
Chromatin immunoprecipitation (ChIP) followed by massively parallel sequencing (ChIP-Seq) is a relatively new technology to map genome-wide protein-DNA interaction. It has been extensively used for analysing how protein interacts with DNA and also the binding sites of DNA-associated proteins. In order to fully understand the biological processes and many disease states it is essential to understand how proteins interact with DNA to regulate gene expression. With ChIP-Seq technology, it is possible to determine how transcription factors and other chromatin associated proteins influence phenotype-affecting mechanisms.
Chromatin immunoprecipitation technique can isolate specific DNA binding sites that are in direct physical contact with transcriptional factor and other proteins. This produces a library of target DNA sites bound to protein under study in-vivo. [Gilmour et al. 1986] first developed the original ChIP technique, where they used UV irradiation to covalently cross-link proteins in contact with neighbouring DNA in intact living cells. Subsequently [Solomon et al. 1988] adapted formaldehyde cross-link replacing the UV cross-link technique.
This ChIP assay can then be combined with sequencing technology (ChIP-seq) to examine the interaction pattern of any Protein with DNA or the pattern of any epigenetic chromatin modifications. First genome-wide maps produced through ChIP-Seq were created in 2007 [Johnson et al. 2007]. Further studies suggested novel functions for histone modification and the importance of combinatorial patterns of modifications [Barski et al. 2007] and examines the correlations among histone
39
modification patterns and their relationship to transcriptional activation [Wang et al. 2008].
2.2.1 How ChIP-Seq technology works
In this technique, a protein of interest is cross-linked with DNA site it binds to in an in vivo environment. Then the DNA is sheared by sonication or other mechanism. After fragmentation, the next step is immunoprecipitation. From the resulting DNA strands and Protein of interest and DNA component, crosslinked DNAs are filtered using antibody by the immunoprecipitation technique. Finally the cross-linking of the protein and DNA is reversed and the DNA is purified. These DNAs are then sequenced, which are known as ‘reads’.
Figure 2:5 Schematic representation of ChIP-Seq technology. In Step 1, DNA and the protein are crosslinked and the DNA is sheared. In Step 2, DNA-protein complexes are obtained using immunoprecipitation technique. In Step 3 DNA and the protein is separated and DNA is purified. In Step 4, purified DNA is sequenced and finally in Step 5, the DNA sequences are mapped to the whole genome to analyse the location where the protein is bound [Szalkowski 2010].
40
Figure 2.5 shows step by step process of how ChIP-Seq data is produced. The success of a ChIP-Seq project depends crucially on strong enrichment of the chromatin specifically bound by the protein under study. Before any ChIP-Seq experiment, a number of antibodies, if available are evaluated and one is chosen that is with consistently high enrichment of DNA at a known binding site.
2.2.2 ChIP-Seq Analysis step
ChIP-Seq is a powerful technique that allows us to investigate the physical interaction with proteins or transcription factors. It also helps discover and understand the pattern of any epigenetic chromatin modification. Once the ChIP-Seq data is generated, the sequences are further analysed to determine the binding locations of protein under investigation. Figure 2.6 is the workflow diagram for steps involved in ChIP-Seq data analysis followed by the brief overview of some of those steps.
Figure 2:6 Schematics of analysis steps of ChIP-Seq data. The sequences are produced and their quality is checked, they are mapped to the whole genome and a peak-calling algorithm is applied to the aligned data to find the regions that are enriched by the protein. Further downstream analysis can be performed on the enriched results.
41
The raw data for chromatin immunoprecipitation followed by sequencing is generated by next generation platform and such platforms are Illumina (http://www.illumina.com/) and ABI SOLiD [Shah 2009]. The reads yielded by these platforms are short reads (typically around 25~30bp in length). However, recent platforms can result in longer reads (up to 50 ~ 100 bp) and extreme high throughput can result in up 700MB to 1GB per lane. Below each step that is involved in the workflow of the ChIP-Seq data analysis is described.
Quality Control ChIP-Seq Experiments
After sequencing, before the sequences are mapped and analysed to find the protein bound locations, a number of quality controls can be used to determine if the data is worthwhile for any further investigation and validation. Packages such as FastQC [Andrews 2010] allow raw sequence quality to be assessed. There are several features that are used in assessing the quality of sequence data such as alignment independent features. Most sequencing hardware provides quality score for each base call in the read to report the confidence in assigning a specific nucleotide to each base.
Figure 2.7: Per base sequence quality assessed by FastQC. (Left) shows sequence quality is unacceptable as good portions of the sequences scores very low in quality check and (right) shows good quality sequence data as most of the sequences scores high in quality check. In both plots, the X axis shows the position of the bases in read (1 – 99), and the Y axis shows the quality score (0 – 40).
42
The quality control software such as FastQC uses these scores to create plots and statistical reports about the overall quality of the data. Another feature is the number of bases that could not be called i.e the number of ‘N’s in the data also provides some insight to the quality of the data.
Figure 2.7 is an example of outputs by FastQC, which are the assessments of quality of per base sequence of two ChIP-Seq data. Read count enrichment can be calculated between ChIP and input samples and can help control for biases in the experimental methods. Visual inspection of the data allows for a simple but effective tool.
Genome Alignment
ChIP-Seq analysis starts with mapping all the raw reads to the reference genome, the uniquely mapped reads from the ChIP experiment. In a typical ChIP-Seq experiment for a typical mammalian biological sample/biopsy, tens or even hundreds of millions of sequences must be aligned to gigabytes of a reference genome and for that reason; alignment is one of the most computationally challenging tasks in the ChIP-Seq data analysis process [Trapnell et al. 2009]. For alignment, Bowtie [Langmead et al. 2009], ELAND [Bentley et al. 2008], MACS [Zhang et al. 2008] are the most popular choices for the ChIP-Seq experiment.
There are several conditions or issues that need to be considered when choosing a mapping algorithm and its parameters. For example, one need to decide whether to keep only the reads that are found in unique position in the reference genome or whether to include reads that map to multiple locations. Accepting only unique reads, some true binding sites may not be found as they may be located in repeats or duplicated regions. On the other hand, multireads may improve signals but simultaneously may increase false positive rates. Therefore, a balance needs to be maintained between increased specificity and sensitivity while choosing the mapping algorithm [Pepke et al. 2009]. It also needs to be remembered that sequencing error can occur. Therefore alignment of reads should allow for a small number of mismatches
43
Identification of enriched region
After the sequenced reads are aligned to the genome, the next steps of the analysis are converting the mapped reads into a representative count number at each position in the genome and identification the regions or locations that are enriched significantly with reads or tags where significance is estimated from the distribution of the data along the genome or part of the genome that has been investigated. This step where enriched regions or peaks are identified is also known as ‘peak calling’. There are several issues related to this step. The user needs to be careful while choosing a ‘peak calling algorithm’ as different peak callers may deal with different issues and each can be suitable for particular type of ChIP-Seq data.
A major challenge involved in detecting enriched region is that there are three types of such regions. Sharp peaks are usually found for protein-DNA binding or histone modifications at regulatory elements. Histone modifications marking domains for example transcribed or repressed regions usually have broad regions. The regions can be mixed as well. Figure 2.8 presents different types of peaks found in different data. Most of the available algorithms are designed for sharp peaks, while merging adjacent peaks for broad regions [Park et al 2009]. An effective method should take both types of regions into account and apply the relevant technique applicable for a given dataset.
Peak detection algorithm is therefore a key to meaningful interpretation of ChIP-Seq data.
In peak calling, steps can be subdivided into several tasks such as, generating a signal profile for individual chromosome, defining the noise or background and true signal, identify peaks, assessing significance and finally removing artefacts [Pepke et al, 2008]. Different tools adapt different methods for these tasks.
44
Figure 2.8: Different types of enriched regions depending on target proteins [Kotwaliwale 2013].
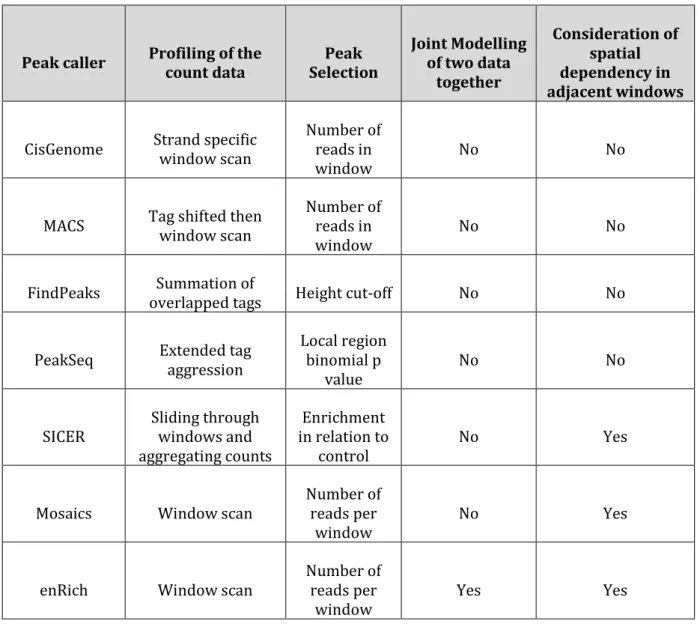
Building a signal profile is crucial in identifying enriched regions with confidence. Some tools slide a fixed length bin or window where each bin has the summation of the count at the centre. CisGenome [Ji et al. 2008] and SiSSRs [Jothi et al. 2008] both follow this method and also set criteria for consecutive windows to be merged. However, some peak calling algorithms take advantage of the direction of the reads. In this approach, the fragments are sequenced at the 5′ end and the positions of mapped reads form two separate distributions. One on the positive strand and the other on the negative strand and both is kept with a consistent distance between the peaks of the distributions. However, positive or negative strand peaks do not represent actual location of the enriched site.
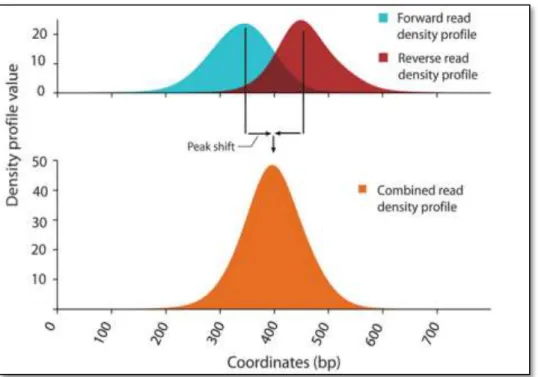
To address these issues, some algorithms first construct a smoothed profile on each strand and then calculate the combined profile as showed in Figure 2.9. In order to achieve that, each distribution can be moved towards the centre or mapped location can be extended towards right fragments and fragments can be summed up.
45
Figure 2.9: Forward and reverse (Blue and Red respectively) read density profile is used to make a combined density profile (orange) [Valouev et al. 2008].
MACS (Model-based Analysis of ChIP-Seq) [Zhang et al. 2008] shifts the read by d⁄2 where d is the fragment length, other methods such as FindPeaks [Fejes et al. 2008], PeakSeq [Rozowsky et al. 2009] etc. elongate the reads to a size of d where d is estimated from the actual data. This methodology should create better profile; however, there are some limitations of this approach. One needs a prior estimate of the fragment size and should assume that fragment size is uniform.
From the combined profile, peaks can be estimated. Random distribution of reads in a window of size w modelled using a theoretical distribution. Poisson model for tag distribution is a good approach as it takes into consideration both folds ratio and the absolute tag numbers. Poisson distribution has just one parameter, λ. If,
λ = expected number of reads in window k = number of occurences of any read
![Figure 1.2: Eukaryotic Gene Structure with its component such as promoters, exons, introns etc [Eukaryotic gene structure]](https://thumb-us.123doks.com/thumbv2/123dok_us/11079071.2994162/19.892.147.745.787.977/figure-eukaryotic-structure-component-promoters-introns-eukaryotic-structure.webp)
![Figure 2.1 Chromatin remains in tight structure not to allow transcription and it opens up to initiate transcription [Carmona 2015]](https://thumb-us.123doks.com/thumbv2/123dok_us/11079071.2994162/30.892.147.734.482.852/figure-chromatin-remains-structure-transcription-initiate-transcription-carmona.webp)

![Figure 2.4: Some technologies available to investigate different epigenetic mechanisms [Technologies for studying epigenetics]](https://thumb-us.123doks.com/thumbv2/123dok_us/11079071.2994162/37.892.186.694.126.506/technologies-available-investigate-different-epigenetic-mechanisms-technologies-epigenetics.webp)
![Figure 2.8: Different types of enriched regions depending on target proteins [Kotwaliwale 2013]](https://thumb-us.123doks.com/thumbv2/123dok_us/11079071.2994162/44.892.182.709.131.439/figure-different-enriched-regions-depending-target-proteins-kotwaliwale.webp)