Decoding High Level Influences on Facial Expression Recognition
Vicky Samantha Adams
A thesis submitted in partial fulfilment of the requirements of the University of East Anglia for the degree of Doctor of Philosophy.
Research undertaken in the School of Psychology, University of East Anglia.
September 2018
This copy of the thesis has been supplied on condition that anyone who consults it is understood to recognise that its copyright rests with the author and that use of any information derived there from must be in accordance with current UK Copyright
i Decoding High Level Influences on Facial Expression Recognition
Abstract
The present thesis explores the neural mechanisms underlying the recognition of emotion; the effect of high-level influences such as prior knowledge, task goals and the possible contribution of embodied simulation in facial expression recognition. The initial experiments (Chapters 2 & 3) investigate high-level processing that occurs when facial features are occluded in the recognition of facial expressions (visual route of recognition). This research examines the information about occluded facial features in early visual (V1-V3), face and emotion sensitive areas with fMRI, as well as the temporal dynamics of posterior brain regions in processing occluded facial features with EEG. MVPA reveals similar patterns of decoding across non-overlapping samples of face information, suggesting the involvement of contextual influences beyond low-level processing (Chapter 2), as well as reliable decoding of facial expression (happy, fear and disgust) in conditions missing feature information (Chapters 2 & 3). This decoding, found 50-700ms, has three decoding phases, which potentially reveal the presence of feedforward and feedback processes (Chapter 3). These chapters also investigate the influence of task constraints, finding decoding differences between implicit and explicit processing conditions. Overall, this
research helps understand how the brain deals with occluded stimuli; in keeping with accounts implying the rich role for top-down influences, such as predictive coding. The following experiment (Chapter 4) investigates embodiment in emotion
recognition with fMRI; exploring shared representation in the perception and production of facial expression. MVPA reveals reliable expression decoding in the premotor brain regions across perception and production, demonstrating
representational overlap across the sensory perception and motor production of expression. This tentatively supports strongly embodied simulation-based (non-visual) theories. Collectively, the present research contributes to our knowledge of high-level influences in facial expression recognition, supporting the involvement of visual and non-visual routes to recognition, as well as providing further directions for future research.
ii
Contents
Abstract ... i
List of Tables ... ix
List of Figures ... xiii
Acknowledgements ... xxiii
Author’s Declaration ... xxiv
SECTION 1 – Facial Expression Recognition ... 1
Chapter 1: Facial Expression Recognition ... 2
1.1 Visual Recognition of Emotion ... 3
1.1.1 Visual Stream Model of Emotion Recognition... 3
1.1.2 Face Models of Emotion Recognition. ... 4
1.1.3 Using FMRI to Investigate the Regions Involved in Expression Recognition: Univariate or Multi-Voxel Pattern Analysis (MVPA). ... 8
1.1.3.1 FMRI studies investigating the regions involved in expression recognition... 8
1.1.4 Bottom-up Versus Top-down Models of the Visual System. ... 13
1.1.5 Behavioural Studies Demonstrating the Optimal Conditions for Emotion Recognition. ... 16
1.1.6 EEG Studies Demonstrating the Effect of Occlusion on the N170. ... 19
1.2 Non-Visual Routes to Emotion Recognition ... 20
1.2.1 What is Embodiment? ... 20
1.2.1.1 The importance of embodied simulation and mimicry. ... 21
1.2.1.2 Is mimicry necessary for the recognition of facial expressions? ... 25
1.2.2 Brain regions involved in embodiment. ... 27
1.2.2.1 Somatosensory and motor cortices. ... 29
1.2.2.2 Subcortical activations. ... 34
1.3 Overall Aims and Objectives of the Current Research ... 35
SECTION 2 - Experimental Chapters ... 40
Chapter 2: Early Visual (V1-V3), Face and Emotion Sensitive Areas Contain Information about Occluded Facial Features... 41
iii
2.1 Introduction ... 41
2.1.1 Visual processing. ... 41
2.1.1.1 Accounts of visual processing. ... 41
2.1.1.2 How to study feedback? ... 44
2.1.1.3 Face and emotion selective areas. ... 46
2.1.1.4. Present study and hypotheses. ... 48
2.2 Methods ... 50
2.2.1 Participants... 50
2.2.2 Stimuli. ... 50
2.2.3 Design and procedure. ... 51
2.2.4 MRI data acquisition. ... 53
2.2.5 MRI data processing. ... 53
2.2.6 Retinotopic mapping. ... 54
2.2.7 Analysis. ... 55
2.2.8 Additional face and emotion related ROI’s. ... 56
2.2.9 Multivariate pattern classification analysis... 57
2.3 Results ... 59 2.3.1 Behavioural results. ... 59 2.3.1.1 Emotion accuracy. ... 60 2.3.1.2 Gender accuracy. ... 63 2.3.2 Retinotopy. ... 65 2.3.2.1 Basic decoding. ... 66 2.3.2.2 Cross classification (XC). ... 69 2.3.2.3 Permutation tests. ... 72
2.3.3 Additional face and emotion related ROI’s. ... 72
2.3.3.1 Basic decoding. ... 72
iv
2.3.4 Univariate analysis in V1. ... 87
2.4 Discussion ... 89
2.4.1 High-level information about facial expressions in V1 and EVC. ... 89
2.4.1.1 Cross-decoding shows high-level context effect. ... 89
2.4.1.2 Task effects. ... 90
2.4.2 Decoding in face and emotion regions. ... 93
2.4.2.1 Comparison between the decoding results and previous research. ... 93
2.4.2.2 Task effects. ... 95
2.4.2.3 How do these results help explain the findings from V1 and EVC? .. 95
2.4.3 Can a low-level model explain the high-level effects in this data? ... 96
2.4.4 Implications for models of cortical feedback. ... 96
2.4.5 Explicit and implicit emotion perception... 97
2.4.5.1 Why implicit decoding is higher? ... 97
2.5 Conclusion ... 99
Chapter 3: Temporal Dynamics Underlying Visual Perception of Occluded Faces ... 100
3.1. Introduction ... 100
3.1.1 Background. ... 100
3.1.2 EEG and MVPA. ... 100
3.1.3 ERP research investigating occlusion. ... 103
3.1.4 ERP research investigating differences between emotions. ... 105
3.1.5 ERP research investigating task. ... 105
3.1.6 Present study and hypotheses. ... 107
3.2 Study 1 ... 108
3.2.1 Methods. ... 108
3.2.1.1 Participants. ... 108
3.2.1.2 Stimuli. ... 108
v
3.2.1.4 EEG acquisition. ... 109
3.2.1.5 EEG data pre-processing for MVPA... 109
3.2.1.6 Multi-variate pattern analysis. ... 110
3.2.1.7 Univariate EEG pre-processing and analysis. ... 110
3.2.2 Results. ... 112 3.2.2.1 Behavioural results. ... 112 3.2.2.2 MVPA results. ... 118 3.2.2.3 Univariate results. ... 120 3.3 Study 2 ... 130 3.3.1 Methods. ... 130 3.3.1.1 Participants. ... 130 3.3.1.2 Stimuli. ... 130
3.3.1.3 Design and procedure. ... 130
3.3.1.4 EEG acquisition. ... 131
3.3.1.5 EEG Data pre-processing for MVPA. ... 131
3.3.1.6 Multi-variate pattern analysis. ... 131
3.3.1.7 Univariate EEG pre-processing and analysis. ... 131
3.3.2 Results ... 132 3.3.2.1 Behavioural results. ... 132 3.3.2.2 MVPA results. ... 136 3.3.2.3 Univariate results. ... 139 3.4 Discussion ... 145 3.4.1 MVPA results. ... 146 3.4.2 Univariate results. ... 149
3.4.3 Comparison of results to fMRI study. ... 154
vi
Chapter 4: Shared Representations in the Perception and Production of Facial
Expressions; Testing the Embodied Account of Emotion Recognition ... 157
4.1 Introduction ... 157
4.1.1 Theories of embodiment. ... 158
4.1.2 Patient investigations. ... 159
4.1.3 TMS investigations of shared networks... 160
4.1.4 fMRI investigations of shared networks for perception, production and imitation. ... 161
4.1.5 Methodological fMRI considerations. ... 163
4.1.6 Rationale and hypothesis. ... 164
4.2 Methods ... 165
4.2.1 Participants... 165
4.2.2 Stimuli. ... 165
4.2.3 Design and procedure. ... 166
4.2.4 MRI data acquisition. ... 168
4.2.5 MRI data processing and analysis. ... 168
4.2.5.1 Task 1: ... 168 4.2.5.2 Task 2: ... 169 4.2.6 ROI selection. ... 169 4.2.6.1 Task 1: ... 169 4.2.6.2 Task 2: ... 170 4.2.7 MVPA. ... 173 4.3 Results ... 174
4.3.1 Univariate Whole Brain Analysis (WBA). ... 175
4.3.1.1 Task 1: ... 175
4.3.1.2 Task 2: ... 175
4.3.2 Regions defined. ... 176
vii
4.3.3.1 Decoding within perception and production. ... 178
4.3.3.2 Cross-classification. ... 180
4.3.4 Supplementary Analyses... 182
4.4 Discussion ... 184
4.4.1 Representations of expression in premotor cortices. ... 184
4.4.2 Representations of expression in other regions of the brain. ... 186
4.4.3 Limitations and future directions. ... 187
4.4.3.1 Are the results due to imagery? ... 187
4.4.3.2 Were appropriate stimuli used? ... 188
4.4.3.3 Are results exclusive to the embodiment of facial expressions?... 189
4.4.4 Wider implications. ... 189
4.5 Conclusion ... 190
SECTION 3 - General Discussion ... 191
Chapter 5: General Discussion ... 192
5.1 Chapter Overview ... 192
5.2. Summary of Results ... 192
5.2.1 Chapters 2 and 3. ... 192
5.2.1.1 The high level influence of spatial context on expression processing. ... 192
5.2.1.2 The high level influence of task goals on expression processing. .... 193
5.2.2 Chapter 4. ... 194
5.2.2.1 The high level influence of embodiment on expression processing. 194 5.3 Theoretical Implications ... 195
5.3.1 Mechanisms involved in recognising occluded facial expressions. ... 195
5.3.2 The role of simulation in recognising facial expressions. ... 198
5.3.3 Uniting the visual mechanisms and the role of simulation in recognising facial expressions. ... 199
viii
5.4.1 Affective computing. ... 202
5.5 Limitations ... 202
5.5.1 Power. ... 203
5.5.2 Localisation of brain regions. ... 205
5.5.3 Choice of stimuli. ... 207
5.6 Future Directions ... 209
5.7 General Conclusion ... 212
References ... 214
Appendices ... 244
Appendix A. Stimulus Sheets ... 244
Appendix B. Univariate Whole Brain Analysis (WBA) ... 249
Appendix C. Other Visual Regions ... 252
Appendix D: Statistics (ANOVA and t-test results) ... 253
Appendix E. Confusion Matrices ... 284
Appendix F. Full results from Task x ROI x Voxel Size Repeated Measures ANOVA ... 285
Appendix G. Gender Decoding Results ... 286
Appendix H. Computational Modelling ... 288
Appendix I. Correlates with Empathy ... 290
Appendix J. Study 1: Artefact Correction Results ... 294
Appendix K. Study 1: Expression Analysis of Gender Data... 295
Appendix L. Study 1: Reaction Time Data ... 298
Appendix M. Study 2: Expression Analysis of Gender Data ... 304
Appendix N. Study 2: Reaction Time Data ... 305
Appendix O. Decoding Results for 9mm Radius Spheres ... 309
Appendix P. Consistency between ROIs from single subjects and group level analysis. ... 314
ix
List of Tables
Table 2.1. Selected Reverse Inference Maps for ROI’s downloaded from www.neurosynth.org on 27th July 2016. As of that date, the database consisted of 11406 studies. Peak voxel coordinates defined in Talairach space using
BrainVoyager QX. ... 57 Table 2.2. All to 2d.p in percentage. WF: whole face, EO: eyes only, ME: minus eyes, MO: mouth only, MM: minus mouth. ... 60
Table 3.3. All to 2 d.p in percentage. WF: whole face, EO: eyes only, ME: minus eyes, MO: mouth only, MM: minus mouth. ... 113
Table 3.4. All to 2d.p in percentage. WF: whole face, EO: eyes only, ME: minus eyes, MO: mouth only, MM: minus mouth. ... 132
Table 4.5. Peak voxel coordinates (x, y, z) of each ROI averaged across participants, SD in brackets (all to 2d.p.). The final column details the number of participants each ROI was defined in; please note that not all regions could be defined in all participant. ... 172
Table D1. Simple effects ANOVA for the emotion accuracy behavioural results; significance shows main effect of emotion (Chapter 2). ... 253
Table D2. Simple-effects ANOVA for the emotion accuracy behavioural results; significance shows main effect of PF condition (Chapter 2). ... 253
Table D3. Paired sample t-tests comparing the differences between the emotions for each PF condition (Chapter 2). ... 254
Table D4. Paired sample t-tests comparing the differences between the PF conditions for each emotion (Chapter 2). ... 255
Table D5. Simple-effects ANOVA for the gender accuracy behavioural
results; significance shows main effect of gender (Chapter 2). ... 256 Table D6. Simple-effects ANOVA for the gender accuracy behavioural
results; significance shows main effect of PF condition (Chapter 2). ... 256 Table D7. Paired sample t-tests comparing the differences between the PF conditions for male and female faces (Chapter 2). ... 257
Table D8. One-tailed one sample t-test results for basic decoding in primary visual cortex (V1). ... 258
Table D9. Paired sample t-tests to explore the effect of task for each PF condition (V1)... 258
x Table D10. One-tailed one sample t-test results for basic decoding in early visual cortex (EVC). ... 259
Table D11. Paired sample t-tests to explore the effect of task for each PF condition (EVC). ... 259
Table D12. One-tailed one sample t-test results for cross-classification analyses in primary visual cortex (V1). ... 259
Table D13. Paired sample t-tests to explore the effect of task for each
condition pair (V1). ... 260 Table D14. One-tailed one sample t-test results for cross-classification analyses in early visual cortex (EVC). ... 260
Table D15. Paired sample t-tests to explore the effect of task for each
condition pair (EVC). ... 260 Table D16. One-tailed one sample t-test results for basic decoding in the fusiform gyrus (FG). ... 261
Table D17. Paired sample t-tests to explore the effect of task for each PF condition (FG). ... 261
Table D18. One-tailed one sample t-test results for basic decoding in the superior temporal sulcus (STS). ... 262
Table D19. Paired sample t-tests to explore the effect of task for each PF condition (STS). ... 262
Table D20. One-tailed one sample t-test results for basic decoding in the inferior occipital gyrus (IOG). ... 263
Table D21. Paired sample t-tests to explore the effect of task for each PF condition (IOG). ... 263
Table D22. One-tailed one sample t-test results for basic decoding in the amygdala (AMY). ... 264
Table D23. Paired sample t-tests to explore the effect of task for each PF condition (AMY). ... 264
Table D24. One-tailed one sample t-test results for basic decoding in the insula (INS). ... 265
Table D25. Paired sample t-tests to explore the effect of task for each PF condition (INS). ... 265
Table D26. One-tailed one sample t-test results for cross-classification analyses in the fusiform gyrus (FG). ... 266
xi Table D27. One-tailed one sample t-test results for cross-classification analyses in the superior temporal sulcus (STS). ... 266
Table D28. One-tailed one sample t-test results for cross-classification analyses in the inferior occipital gyrus (IOG). ... 266
Table D29. Paired sample t-tests to explore the effect of task for each
condition pair (IOG). ... 267 Table D30. One-tailed one sample t-test results for cross-classification analyses in the amygdala (AMY). ... 267
Table D31. One-tailed one sample t-test results for cross-classification analyses in the insula (INS)... 267
Table D32. Univariate analysis in V1: Paired sample t-tests to explore the effect of task for each PF condition. ... 268
Table D33. Simple-effects ANOVA for the emotion accuracy behavioural results (Chapter 3, Study 1); significance shows main effect of emotion. ... 269
Table D34. Simple-effects ANOVA for the emotion accuracy behavioural results (Chapter 3. Study 1); significance shows main effect of PF condition. ... 269
Table D35. Paired sample t-tests comparing the differences between the emotions for each PF condition (Chapter 3, Study 1). ... 270
Table D36. Paired sample t-tests comparing the differences between the PF conditions for each emotion (Chapter 3, Study 1). ... 271
Table D37. Simple-effects ANOVA for the gender accuracy behavioural results (Chapter 3, Study 1); significance shows main effect of gender. ... 272
Table D38. Simple-effects ANOVA for the gender accuracy behavioural results (Chapter 3, Study 1); significance shows main effect of PF condition. ... 272
Table D39. Paired sample t-tests comparing the differences between the PF conditions for male and female faces (Chapter 3, Study 1). ... 273
Table D40. Simple-effects ANOVA for the rN170 (Chapter 3, Study 1);
significance shows main effect of emotion. ... 274 Table D41. Simple-effects ANOVA for the rN170 (Chapter 3, Study 1);
significance shows main effect of PF condition. ... 274 Table D42. Paired sample t-tests comparing the differences between the emotions for the significant PF conditions in the rN170 (Chapter 3, Study 1). ... 274
Table D43. Paired sample t-tests comparing the differences between the PF conditions for each emotion in the rN170 (Chapter 3, Study 1). ... 275
xii Table D44. Simple-effects ANOVA for the P300 gender task (Chapter 3, Study 1); significance shows main effect of emotion. ... 276
Table D45. Simple-effects ANOVA for the P300 gender task (Chapter 3, Study 1); significance shows main effect of PF condition. ... 276
Table D46. Paired sample t-tests comparing the differences between the emotions for the significant WF condition in the P300 (Chapter 3, Study 1). ... 276
Table D47. Paired sample t-tests comparing the differences between the PF conditions for the significant emotions in the P300 (Chapter 3, Study 1). ... 277
Table D48. Simple-effects ANOVA for the emotion accuracy behavioural results (Chapter 3, Study 2); significance shows main effect of gender. ... 278
Table D49. Simple-effects ANOVA for the emotion accuracy behavioural results (Chapter 3, Study 2); significance shows main effect of PF condition. ... 278
Table D50. Paired sample t-tests comparing the differences between the PF conditions for the significant emotions (Chapter 3, Study 2). ... 279
Table D51. Simple-effects ANOVA for the gender accuracy behavioural results (Chapter 3, Study 2); significance shows main effect of gender. ... 280
Table D52. Simple-effects ANOVA for the gender accuracy behavioural results (Chapter 3, Study 2); significance shows main effect PF condition. ... 280
Table D53. Paired sample t-tests for PF condition in female stimuli (Chapter 3, Study 2). ... 280
Table D54. Simple-effects ANOVA for the lN170 (Chapter 3, Study 2);
significance shows main effect of emotion. ... 281 Table D55. Simple-effects ANOVA for the lN170 (Chapter 3, Study 2);
significance shows main effect of PF condition. ... 281 Table D56. Paired sample t-tests comparing the differences between the PF conditions for each emotion in the lN170 (Chapter 3, Study 2). ... 282
Table D57. Simple-effects ANOVA for the P100 (Chapter 3, Study 2);
significance shows main effect of emotion. ... 283 Table D58. Simple-effects ANOVA for the P100 (Chapter 3, Study 2);
significance shows main effect of PF condition. ... 283 Table D59. Paired sample t-tests comparing the differences between the PF conditions for fear in the P100 (Chapter 3, Study 2). ... 283
xiii
List of Figures
Figure 1.1. Diagram of a simple feedforward computational model that categorises facial expressions of emotion, from Dailey et al. (2002). ... 4
Figure 1.2. Face models of Emotion Recognition. a. Bruce and Young’s (1986) model of face perception, expression analysis occurs after structural encoding. b. Haxby et al.’s (2000) hierarchical model of brain areas involved in processing faces (Apicella, Sicca, Federico, Campatelli, and Muratori, 2013). c. Duchaine and Yovel’s (2015) revised neural framework for face processing
revealing additional face-selective areas in anterior regions of the brain. This model shows a ventral face-processing pathway through the OFA, FFA and the Anterior Temporal Lobe (ATL), and a dorsal face-processing pathway, through the STS and the inferior frontal gyrus (IFG). -FA; face selective area. Model shows back
connections/recurrent processing. ... 6 Figure 1.3. Diagram of the multiple-waves model of processing showing the involvement of a distributed network of brain areas in the recognition of emotion. TE and TEO, Inferior temporal area, from Pessoa and Adolphs (2010). ... 10
Figure 1.4. Mean accuracy for all seven ROI’s selected in Wegrzyn et al. (2015), successful recognition in all brain areas is above chance (25%); FG, fusiform gyrus, STS, superior temporal sulcus; AT, anterior temporal; INS, insula; IS,
intraparietal sulcus; IO, inferior occipital gyri; AMY, amygdala. Image from
Wegrzyn et al. (2015). ... 12 Figure 1.5. Diagnostic features necessary to categorise each of the basic emotions, adapted from M. L. Smith et al. (2005). ... 18
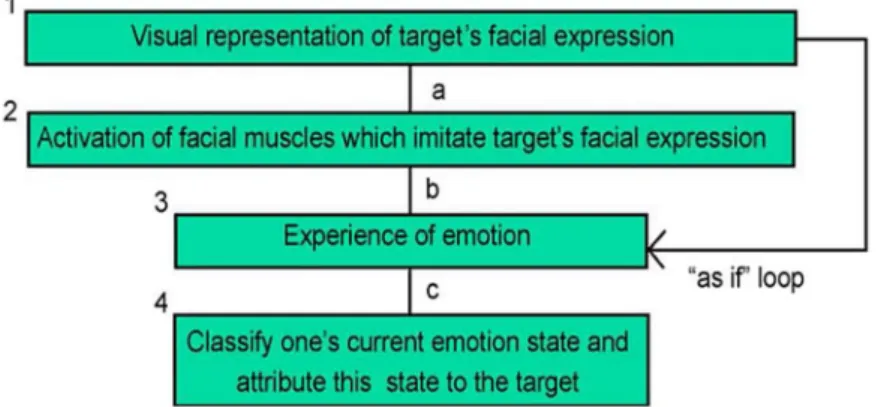
Figure 1.6. Reverse simulation model with the “as if” loop, from Goldman and Sripada (2005). ... 22
Figure 1.7. Diagram showing the muscles activated in response to facial expressions, measured using EMG, from Niedenthal (2007). ... 23
Figure 1.8. Human mirror neuron system for imitation, showing the implicated areas for the observation and execution of facial expressions: Premotor Cortex (PMC), Inferior frontal gyrus (IFG), Inferior Parietal Lobe (IPL) and
Superior Temporal Sulcus (STS), from Iacoboni and Dapretto (2006). ... 29 Figure 1.9. Somatotopic maps: the sensory and motor homunculus, from Ibric and Dragomirescu (2009). ... 30
xiv Figure 1.10. Brain activation for perceiving (green) and producing (red) happiness expressions; overlaps (yellow) present in the right PMD and PMV, as well as the right S2, adapted from Hennenlotter et al. (2005). ... 31
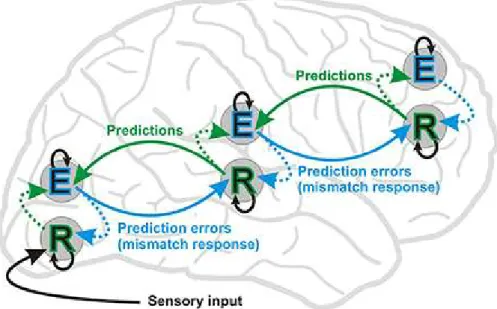
Figure 2.11. Model of predictive coding (Stefanics, Kremláček, & Czigler, 2014). E: Error; R: Representation... 42
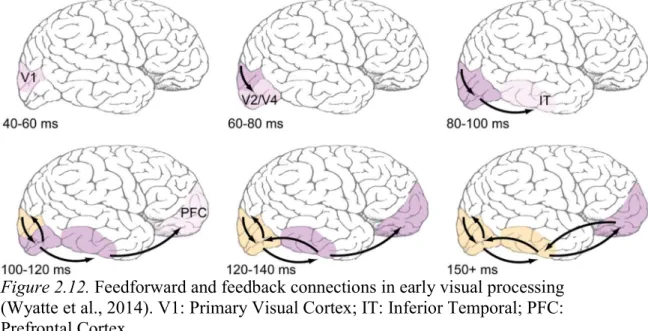
Figure 2.12. Feedforward and feedback connections in early visual
processing (Wyatte et al., 2014). V1: Primary Visual Cortex; IT: Inferior Temporal; PFC: Prefrontal Cortex. ... 43
Figure 2.13. Example stimuli (15 conditions, one identity); disgust, fear and happiness (created using WF images from CAFE dataset). ... 51
Figure 2.14. a. Experimental design, subjects either carried out four runs of the emotion task followed by four runs of the gender task (A), or subjects carried out four runs of the gender task followed by four runs of the emotion task (B); b.
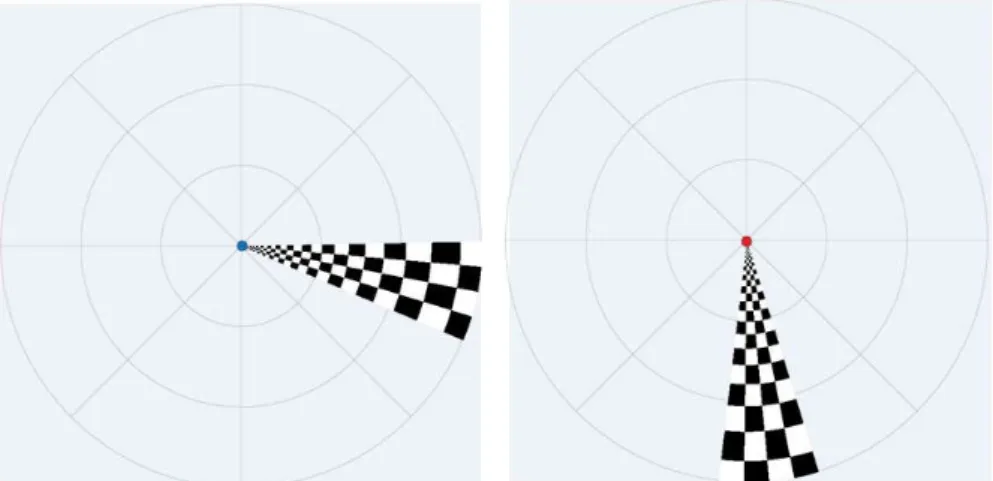
Sequence of stimulus presentation. ... 52 Figure 2.15. Retinotopy task; participants asked to fixate on the blue dot, see image to the left, and respond when the dot changed to red, see image on the right. 53
Figure 2.16. Example of retinotopic mapping; the borders between early visual regions are shown in white, V1-V3. ... 55
Figure 2.17. Example MVPA analysis; testing for pattern similarity in non-overlapping PF conditions, namely EO vs ME. ... 59
Figure 2.18. Overall recognition accuracy (%) in each PF condition for each emotion. ... 61
Figure 2.19. Paired sample t-test results comparing the differences between the emotions for each PF condition (see Table D3 in Appendix D for statistics). ... 62
Figure 2.20. Paired sample t-test results comparing the differences between the PF conditions for each emotion (see Table D4 in Appendix D for statistics). ... 62
Figure 2.21. Showing overall recognition accuracy (%) in each PF condition between male and female stimuli. ... 64
Figure 2.22. Paired sample t-test results comparing the differences between the PF conditions for male and female faces (see Table D7 in Appendix D for
statistics: t-value, df and p-value). ... 65 Figure 2.23. Explicit and implicit expression decoding accuracy of the PF conditions V1, significant results from one-sample t-tests represented with stars. ... 67
xv Figure 2.24. Explicit and implicit expression decoding accuracy of the PF conditions for 1000 voxels in EVC, significant results from one-sample t-tests
represented with stars. ... 68 Figure 2.25. Explicit and implicit expression decoding accuracy of the
condition pairs of PF conditions in V1. Results from one-sample t-tests included with stars representing significance. ... 70
Figure 2.26. Explicit and implicit expression decoding accuracy of the condition pairs of PF conditions in EVC. Results from one-sample t-tests included with stars representing significance. ... 71
Figure 2.27. Showing decoding accuracy across voxel sizes for each ROI. . 73 Figure 2.28. Explicit and implicit expression decoding accuracy of the PF conditions in the FG, significant results from one-sample t-tests represented with stars. ... 74
Figure 2.29. Explicit and implicit expression decoding accuracy of the PF conditions in STS, significant results from one-sample t-tests represented with stars. ... 76
Figure 2.30. Explicit and implicit expression decoding accuracy of the PF conditions in the IOG, significant results from one-sample t-tests represented with stars. ... 77
Figure 2.31. Explicit and implicit expression decoding accuracy of the PF conditions in the amygdala. Results from one-sample t-tests included with stars representing significance. ... 79
Figure 2.32. Explicit and implicit expression decoding accuracy of the PF conditions in the insula. Results from one-sample t-tests included with stars
representing significance. ... 80 Figure 2.33. Explicit and implicit expression decoding accuracy of the
condition pairs of PF conditions in the FG, significant results from one-sample t-tests represented with stars. ... 82
Figure 2.34. Explicit and implicit expression decoding accuracy of the condition pairs of PF conditions in the STS, significant results from one-sample t-tests represented with stars. ... 83
Figure 2.35. Explicit and implicit expression decoding accuracy of the condition pairs of PF conditions in the IOG. One-sample t-test results included with stars representing significance above chance. ... 85
xvi Figure 2.36. Explicit and implicit expression decoding accuracy of the cross classified pairs of PF conditions in the amygdala. One-sample t-test results included with stars representing significance above chance... 86
Figure 2.37. Explicit and implicit expression decoding accuracy of the cross classified pairs of PF conditions in the insula. One-sample t-test results included with stars representing significance above chance. ... 87 Figure 2.38. Mean beta weights of the task differences between the emotions. ... 88
Figure 2.39. Univariate analysis showing the mean beta values for each PF condition as a function of task, explicit versus implicit expression perception. A paired samples t-test shows the tasks to be significantly different in the MM
condition. ... 89 Figure 3.40. Sequence of stimulus presentation. ... 109 Figure 3.41. ROIs displayed on EEG electrode map
(www.fieldtriptoolbox.org/_media/template/acticap-64-channel-standard-2_original.jpg). ROIs include the P100 (O1, O2) highlighted in orange, the lN170 (P7, PO7) and rN170 (P8, PO8) highlighted in purple, as well as the P300 (Pz, POz, PO3, PO4) highlighted in blue. The EOG eye channel is highlighted in red; ground and reference electrodes also displayed. ... 112
Figure 3.42. Overall recognition accuracy (%) in each PF condition for each emotion. ... 114
Figure 3.43. Paired sample t-test results comparing the differences between the emotions for each PF condition (see Table D35 in Appendix D for statistics: t-value, df and p-value). ... 115
Figure 3.44. Paired sample t-test results comparing the differences between the PF conditions for each emotion (see Table D36 in Appendix D for statistics: t-value, df and p-value). ... 115
Figure 3.45. Overall recognition accuracy (%) in each PF condition between male and female stimuli. ... 116
Figure 3.46. Paired sample t-test results comparing the differences between the PF conditions for male and female faces (see Table D39 in Appendix D for statistics: t-value, df and p-value). ... 117
Figure 3.47. Decoding Expression, Expression Task. ... 118 Figure 3.48. Decoding Expression, Gender Task. ... 119
xvii Figure 3.49. rN170 (PO8, P8) grand average ERP (μV) split by PF condition in the emotion task (top), gender task (bottom). Time window (140-190ms) used for analysis marked with dash lines. Negative voltage plotted down. ... 121
Figure 3.50. Mean amplitude of the rN170 for each emotion and PF,
collapsed across task. ... 122 Figure 3.51. Paired sample t-test results comparing the differences between the emotions for the significant PF conditions (see Table D42 in Appendix D for statistics: t-value, df and p-value). ... 123
Figure 3.52. Paired sample t-test results comparing the differences between the PF conditions for each emotion (see Table D43 in Appendix D for statistics: t-value, df and p-value). ... 124
Figure 3.53. lN170 (PO7, P7) grand average ERP (μV) split by PF condition in the emotion task (top) and gender task (bottom). Time window (140-190ms) used for analysis marked with dash lines. Negative voltage plotted down. ... 125
Figure 3.54. P100 (O1, O2) grand average ERP (μV) split by PF condition in the emotion task (up) and gender task (bottom). Time window (80-120ms) used for analysis marked with dash lines. Positive voltage plotted up. ... 126
Figure 3.55. P300 (Pz, PO3, POz, PO4) grand average ERP (μV) split by PF condition in the emotion task (top) and gender task (bottom). Time window (300-500ms) used for analysis marked with dash lines. Positive voltage plotted up. ... 127
Figure 3.56. Mean amplitude of the P300 response for each emotion and PF in the gender task. ... 128
Figure 3.57. Paired sample t-test results comparing the differences between the emotions for the significant WF condition (see Table D46 in Appendix D for statistics: t-value, df and p-value). ... 129
Figure 3.58. Paired sample t-test results comparing the differences between the PF conditions for the significant emotions (see Table D47 in Appendix D for statistics: t-value, df and p-value). ... 129
Figure 3.59. Sequence of stimulus presentation. ... 131 Figure 3.60. Overall recognition accuracy (%) in each PF condition for each emotion. ... 133
Figure 3.61. Paired sample t-test results comparing the differences between the PF conditions for the significant emotions (see Table D50 in Appendix D for statistics: t-value, df and p-value). ... 134
xviii Figure 3.62. Overall recognition accuracy (%) in each PF condition between male and female stimuli. ... 135
Figure 3.63. Paired samples t-test results for PF condition in female stimuli (see Table D53 in Appendix D for statistics: t-value, df and p-value). ... 136
Figure 3.64. Decoding Expression, Expression Task. ... 136 Figure 3.65. Decoding Expression Gender Task. ... 137 Figure 3.66. rN170 (PO8, P8) grand average ERP (μV) split by PF condition in the emotion task (top) and gender task (bottom). Time window (140-190ms) used for analysis marked with dash lines. Negative voltage plotted down. ... 139
Figure 3.67. lN170 (PO7, P7) grand average ERP (μV) split by partial face condition in the emotion task (top) and gender task (bottom). Time window (140-190ms) used for analysis marked with dash lines. Negative voltage plotted down. 140
Figure 3.68. Mean amplitude of the lN170 for each emotion and PF,
collapsed across task. ... 141 Figure 3.69. Paired sample t-test results comparing the differences between the PF conditions for each emotion (see Table D56 in Appendix D for statistics: t-value, df and p-value). ... 142
Figure 3.70. P100 (O1, O2) grand average ERP (μV) split by PF condition in the Emotion Task (top) and gender task (bottom). Time window (80-120ms) used for analysis marked with dash lines. Positive voltage plotted up. ... 143 Figure 3.71. Mean amplitude of the P100 for each emotion and PF, collapsed across task. ... 144
Figure 3.72. Paired sample t-test results comparing the differences between the PF conditions for fear (see Table D59 in Appendix D for statistics: t-value, df and p-value). ... 144
Figure 3.73. P300 (Pz, PO3, POz, PO4) grand average ERP (μV) split by partial face condition in the Emotion task (top) and gender task (bottom). Time window (300-500ms) used for analysis marked with dash lines. Positive voltage plotted up. ... 145
Figure 4.74. Distribution of lesion overlaps (upper quartile of subjects scores subtracted from the lowest quartile); red corresponds to locations where lesions resulted in emotion recognition impairments (RH somatosensory cortices, left frontal operculum), blue corresponds to lesions associated with normal performance, white
xix lines show the position of the sagittal slice, RH top, LH bottom. From Adolphs et al. (2000). ... 159
Figure 4.75. Brain activation networks from a meta-analysis investigating motor imagery (N = 4902 participants), action observation (N = 11032 participants) and movement execution (N = 2302 participants); across the three tasks there is similarity evident in premotor-parietal and somatosensory areas, from Hardwick et al. (2017). ... 162
Figure 4.76. Experimental sequence in task one. ... 166 Figure 4.77. Experimental sequence of task two. ... 167 Figure 4.78. Example MVPA analysis; testing for pattern similarity across the perception and production task of expression in ROIs, namely sensorimotor regions. ... 174
Figure 4.79. Surface maps showing the regions activated for emotion vs phase noise in the perception task; from left to right hemisphere... 176
Figure 4.80. Surface maps showing the regions activated for face movement vs finger movement in the production task; from left to right hemisphere. ... 176
Figure 4.81. Probability map of perceptual ROIs, averaged across all subjects with available ROI’s. From Right to Left Hemisphere. ... 177
Figure 4.82. Probability maps of production ROIs, averaged across all
subjects with available ROI’s. From Right to Left Hemisphere. ... 178 Figure 4.83. Expression decoding accuracy from the significant voxels (100) analysis in the perception task, one-sample t-test results represented with stars. Blue bars represent premotor regions of the brain; grey bars represent the face network of brain regions. ... 179
Figure 4.84. Expression decoding accuracy from the significant voxels (100) analysis in the production task, one-sample t-test results represented with stars. Blue bars represent premotor regions of the brain; grey bars represent sensorimotor
regions of the brain... 180 Figure 4.85. Expression decoding accuracy from the significant voxels (100) cross-classification analysis, one-sample t-test results represented with stars. ROIs defined from the perception task. Blue bars represent premotor regions of the brain; grey bars represent the face network of brain regions. ... 181
Figure 4.86. Expression decoding accuracy from the significant voxels (100) cross-classification analysis, one-sample t-test results represented with stars. ROIs
xx defined from the production task. Blue bars represent premotor regions of the brain; grey bars represent sensorimotor regions of the brain. ... 182
Figure 4.87. The regions activated that overlap between the two tasks (overlapping regions are purple and displayed within a white circle); orange scaling reflecting the activation in the perception task, and blue scaling reflecting the
production task. ... 183 Figure 5.88. Facial expression recognition, importantly demonstrating the iterative loop between visual perception and sensorimotor simulation (B, F), and the engagement of visual, sensorimotor, premotor and subcortical cortices, from Wood, Rychlowska, et al. (2016)... 195
Figure B-1. Surface maps showing the regions activated for explicit vs implicit. Red clusters: more active during the implicit task; Blue clusters: more active for explicit; from left to right hemisphere………...250
Figure B-2. Surface maps showing the regions activated for WF vs ME/MM. Red clusters: more activation for WF condition; Blue clusters: more active for
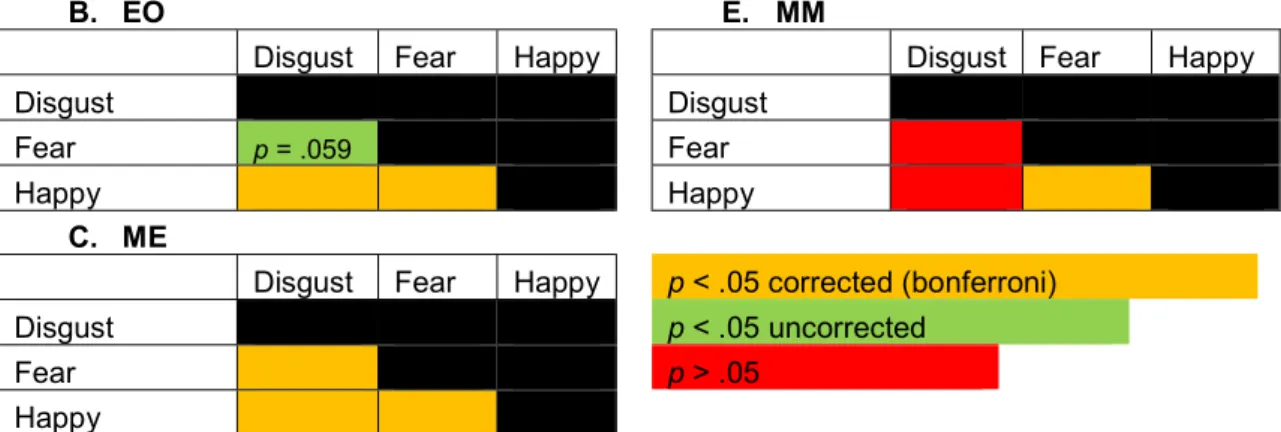
ME/MM conditions; from left to right hemisphere... 251 Figure E-1. Confusion matrices for V1 and EVC. a. Cross-classification confusion matrices between emotion for each cross-classification pair (EO and ME; MO and MM; EO and MO) in the emotion and gender task. b. Basic decoding confusion matrices between emotion for each PF condition in the emotion and gender task. ... 284
Figure G-1. Explicit and implicit gender decoding accuracy of the PF conditions. Results from one-sample t-tests included with stars representing
significance above chance. ... 286 Figure G-2. Explicit and implicit gender decoding accuracy of the PF
conditions for 1000 voxels in EVC, significant results from one-sample t-tests
represented with stars. ... 287 Figure H-1. Expression decoding accuracy from the computational pixel value model of the PF conditions for V1. ... 288
Figure H-2. Expression decoding accuracy from the computational pixel value model of the condition pairs of PF conditions for V1. ... 289
Figure J-1. Decoding Expression, Expression Task. ... 294 Figure J-2. Decoding Expression, Gender Task. ... 294
xxi Figure K-1. Overall recognition accuracy (%) in each PF condition for each emotion. ... 296
Figure K-2. Paired sample t-test results comparing the differences between the PF conditions for each emotion. ... 297
Figure L-1. Overall RT (ms) in each PF condition for each emotion. ... 299 Figure L-2. Paired sample t-test results comparing the differences between the emotions for each PF condition. ... 300
Figure L-3. Paired sample t-test results comparing the differences between the PF conditions for each emotion. ... 300
Figure L-4. Overall RT (ms) in each PF condition between male and female stimuli. ... 301
Figure L-5. Paired sample t-test results comparing the differences between the PF conditions for male and female faces. ... 302
Figure L-6. Overall RT (ms) in each PF condition for each emotion. ... 303 Figure M-1. Overall recognition accuracy (%) in each PF condition between the emotions. ... 304
Figure N-1. Overall RT (ms) in each PF condition for each emotion. ... 305 Figure N-2. Paired sample t-test results comparing the differences between the PF conditions for each emotion. ... 306
Figure N-3. Overall RT (ms) in each PF condition for each gender... 307 Figure N-4. Overall RT (ms) in each PF condition for each emotion. ... 308 Figure O-1. Expression decoding accuracy of 9mm radius spheres in the perception task, one-sample t-test results represented with stars. Blue bars represent premotor regions of the brain; grey bars represent the face network of brain regions. ... 310
Figure O-2. Expression decoding accuracy of 9mm radius spheres in the production task, one-sample t-test results represented with stars. Blue bars represent premotor regions of the brain; grey bars represent sensorimotor regions of the brain. ... 311
Figure O-3. Cross-classification: expression decoding accuracy of 9mm radius spheres defined in the perception task, one-sample t-test results represented with stars. Blue bars represent premotor regions of the brain; grey bars represent the face network of brain regions. ... 312
xxii Figure O-4. Cross-classification: expression decoding accuracy of 9mm radius spheres defined in the production task, one-sample t-test results represented with stars. Blue bars represent premotor regions of the brain; grey bars represent sensorimotor regions of the brain. ... 313
Figure P-1. PM1: probability map (displayed in blue), RFX analysis (in orange)... 314
Figure P-2. PM2: probability map (displayed in blue), RFX analysis (in orange)... 314
Figure P-3. STS: probability map (displayed in blue), RFX analysis (in orange)... 315
Figure P-4. SMA: probability map (displayed in blue), RFX analysis (in orange)... 316
Figure P-5. S1/M1: probability map (displayed in blue), RFX analysis (in orange)... 316
Figure P-6. S2: probability map (displayed in blue), RFX analysis (in
orange)... 317 Figure P-7. PM1: probability map (displayed in blue), RFX analysis (in orange)... 317
Figure P-8. r-PM2: probability map (displayed in blue), RFX analysis (in orange)... 318
Figure P-9. l-PM2: probability map (displayed in blue), RFX analysis (in orange)... 318
xxiii
Acknowledgements
First and foremost a massive thank you goes to my supervisor, Dr. Fraser Smith, for his continued support and guidance throughout my PhD. I am very grateful for the opportunities and experiences I have gained as a result of his expert knowledge and connections with other research institutions. Furthermore, I would like to thank Fraser for providing invaluable advice and feedback on my thesis. I would also like to thank my secondary supervisor, Dr. Andrew Bayliss, for his ongoing advice and encouragement during the course of my PhD. Andrew has supported me throughout my university
experience, from undergraduate to PhD level, and I am extremely grateful for his constant understanding. Additionally I would like to extend my thanks to the School of
Psychology for all their help and support, including the admin team, PhD students and staff, with a special mention to Louis Renault. It has been enjoyable working with such an excellent group of people.
I have also Kerri Bailey to thank for dedicating so much of her time collecting and analysing EEG data with me. We made an excellent team and it has been very enjoyable learning alongside you. Thanks also to Carolin, Carmen, Diana and Delia, I could not have asked for a better year group to share the PhD experience with. Huge thanks also goes to Ethan for our brain analysis days; we did a great job at keeping each other sane and had fun in the process! My gratitude also extends to the people working at
Scannexus, in the Netherlands, and to Professor Lars Muckli, Dr. Lucy Petro and the PhD group at the University of Glasgow. I really appreciate everyone’s willingness to help and their guidance through fMRI data collection and analysis. On top of this I am grateful for my friends and my brother, Charlie Worboys, willingly and patiently piloting my
experiments, and the numerous students who signed up to take part in the studies.
An enormous thank you goes to my family and friends for listening to all the trials and tribulations of my PhD, providing lasting support and reassurances to my stresses and worries. I could not have done this without all of you! Mum, you always know what’s best, thank you for believing in me; your love and encouragement has been integral to my success over the years. You always seem to know the right thing to say and give the best advice! Dad, thank you for taxi-ing me to and from airports for data collection / analysis trips as well as your constant support over the years. Last but not least, I want to thank Joe McGarry for relentlessly being there for me throughout it all; I love your eagerness to help and support me. Joe, both you and your parents have consistently made me realise that it is all going to work out and I will complete my thesis!
xxiv
Author’s Declaration
I declare that the work contained in this thesis has not been submitted for any other award and that it is all my own work. I also confirm that this work fully
acknowledges opinions, ideas and contributions from the work of others.
Parts of this work has been presented at conferences:
Poster Presentations:
Adams, V., Petro, L., Muckli, L., & Smith, F.W. (2016). Explicit and Implicit Decoding of Expression in V1 from Partial Face Stimuli. Presented at the
Organisation of Human Brain Mapping (OHBM), Geneva, Switzerland, June 2016. Adams, V. & Smith, F.W. (2017). Overlapping Networks in the Perception and Production of Facial Expressions; Embodiment in Emotion Recognition. Presented at the Stop me if you think you’ve heard this one before: Novelty,
Repetition and The Brain Conference, University of East Anglia, Norwich, UK, May 2017.
Any ethical clearance for the research presented in this thesis has been approved. Approval has been sought and granted by the School of Psychology Ethics Committee at the University of East Anglia.
Name: Vicky Adams
Signature:
Date: 28/09/18
1
SECTION 1
–
2
Chapter 1: Facial Expression Recognition
The visual recognition of emotion has been abundantly explored in previous literature due to the evolutionary and social importance of recognising emotion (Niedenthal, Krauth-Gruber, & Ric, 2006). Recognition activates basic fight or flight responses (approach or avoidance behaviours) and is key to successful social
communication and relationships (Ekman, 1982). Research focuses on the six
universal emotions identified by Ekman and Friesen (1975): fear, happiness, sadness, disgust, anger and surprise, with the understanding that complex emotional states can be obtained from subtle facial cues providing powerful nonverbal expressive
displays (Peelen, Atkinson, & Vuilleumier, 2010). Successful decoding or recognition of a sender’s expression is dependent on multiple aspects, including viewing distance (F. W. Smith & Schyns, 2009), presentation time (Balconi & Bortolotti, 2013), facial feature availability (Kotsia, Buciu, & Pitas, 2008), lighting (Bettadapura, 2012), context (Rousselet, Mace, & Fabre-Thorpe, 2004) and the emotional state of the observer (Niedenthal, Winkielman, Mondillon, & Vermeulen, 2009). The present research will continue to explore the visual recognition of
emotion, with a particular focus on the high-level influences that occur under conditions of facial feature occlusion, and the possible contribution of embodied simulation in facial expression recognition.
To begin this research, it is important to define what a facial expression is. This definition is dependent on an individual’s theory of emotion. This is because facial expressions can either be considered as universal, in line with earlier work advocating support for innate or evolutionary theories, or considered in terms of cultural differences, in line with social constructionism (Gendron & Barrett, 2009). With regards to evolutionary emotion theories, an expression is said to be an involuntary emotional response, functioning to increase our chances of survival; whereas in social constructionism theories, an expression is said to be voluntary, shaped by social communication and cultural display rules (Schmidt & Cohn, 2001; Adolphs 2002, E. Fox, 2008).
Evolutionary theories focus on the six universal emotions identified above (Ekman & Friesen, 1975). Evidence for these culturally ubiquitous facial expressions of emotion have been presented in research studying the isolated pre-literate western culture of New Guinea in 1971 (Ekman, 1994; Ekman & Friesen, 1971). This
3 cultural group was able to select a face expressing the appropriate emotional
response to a story, in the absence of western media influences; showing that they could associate facial muscular patterns with a given emotion (Ekman & Friesen, 1971). On the other hand, social constructionist accounts categorise the experience of emotion using core shared affect (feeling of pleasantness or unpleasantness), with arousal, approach or reward systems (Lindquist et al., 2012; Wilson-Mendenhall, Barrett, & Barsalou, 2013). Evidence that the recognition of a sender’s expression is dependent on a given situation, context and culture, is shown by western (U.S) and eastern (Japanese) cultures greater accuracy to recognise emotions expressed by members of their own culture (ethnic, national or regional group) (Dailey et al., 2010). This entrenched phenomena, known as in-group advantage, may explain the existence of recognition variability among cultures (Elfenbein & Ambady, 2002). Interestingly the recognition of happiness and anger were less affected by in-group advantage (Elfenbein & Ambady, 2002) and may be less culturally specific
emotions.
Present work now widely advocates an interactionist perspective whereby both evolutionary and social elements of recognising expression are accepted (Elfenbein & Ambady, 2002). This is because there are universal emotions that seemingly share the same components, but there is also diversity across cultures (Elfenbein & Ambady, 2002). Nonetheless, it is important to note that there is also research in support of an embodied theory of emotion which considers sensorimotor brain activation and individual differences (Niedenthal, 2007).
1.1 Visual Recognition of Emotion
1.1.1 Visual Stream Model of Emotion Recognition.
The visual processing pathway is critical to expression recognition (Pessoa & Adolphs, 2010). This details the transfer of information from the retina to the lateral geniculate nucleus (LGN) and the primary visual cortex (V1), before information transfers to the extra-striate visual cortices (V2-V4) and inferior temporal areas (this information transfer is visually represented later as part of Figure 1.3). Research has shown that faces can be decoded around 70ms, suggesting the use of low-level image features when visual information first reaches the cortex (Cichy, Pantazis, & Oliva, 2014; Nemrodov, Niemeier, Mok, & Nestor, 2016), and the sensitivity to complex features and faces occurring further along the visual pathway (Pessoa & Adolphs, 2010). Simple feedforward computational models also account for the visual
4 recognition of expression (see Figure 1.1), these suggest that the categorisation of an expression occurs after a perceptual V1 level analysis and a gestalt inferior temporal (IT) level analysis has taken place (Dailey, Cottrell, Padgett, & Adolphs, 2002); this will be discussed further when considering bottom-up versus top-down processing of expression recognition.
Figure 1.1. Diagram of a simple feedforward computational model that categorises facial expressions of emotion, from Dailey et al. (2002).
The advent of deep learning techniques and the use of deep neural networks for facial expression recognition have advanced computational modelling (Li & Deng, 2018). In deep learning models of facial expression recognition, there is a pre-processing step where facial information irrelevant to expression is normalised, as such faces are aligned and normalised for illumination, before deep models for feature learning, such as the convolutional neural network (CNN) or generative adversarial network (GAN), are applied for deep feature classification. These computational models are principally trained on large face and object recognition datasets and tested on small-scale expression recognition datasets; therefore, irrelevant facial information may be learnt, which could subsequently affect the networks ability to recognise facial expressions. Recently however large-scale datasets for facial expression have been created. It is important to note that both these deep neural networks and the simple feedforward computational models, described previously, may have difficulty processing occluded stimuli (Pepik, Benenson, Ritschel, & Schiele, 2015).
1.1.2 Face Models of Emotion Recognition.
Numerous cognitive models have been developed which separate
components specialised for different aspects of facial processing (Bruce & Young, 1986; Haxby, Hoffman, & Gobbini, 2000). Bruce and Young (1986)’s model of face perception begins with the structural encoding of a face, before expression and other
5 aspects of the face are processed independently (Figure 1.2a). Whilst, the importance of the visual processing pathway to expression recognition has been specified, other brain regions have been identified as vitally important in the processing of faces. These are shown in a further model put forward by Haxby et al. (2000), who identified the inferior occipital gyrus (IOG), lateral fusiform gyrus (LFG) and the superior temporal sulcus (STS) as the three core face selective areas (see Figure 1.2b). Haxby et al. (2000) also detailed the function of these regions; notably separating the importance of the LFG in processing invariant aspects of faces, from the importance of the STS in processing changeable aspects of the face, involved in processing emotion (including static and dynamic facial features).
The existence of dedicated individual regions in the brain, separating facial identity from expression, is further suggested in the double dissociation found between the neurological disorder prosopagnosia (impairment to recognise faces) and prosopo-affective agnosia (inability to recognise expressions) (Calder & Young, 2005). Additionally research postulates the FG or Fusiform Face Area (FFA) as a domain-specific module activated during face perception or identity but not expression processing (Ghuman et al., 2014; Kanwisher, 2006; Li, Richardson, & Ghuman, 2018), which partially corresponds to the face-specific N170 component found in electroencephalogy (EEG) experiments (Bentin, Allison, Puce, Perez, & McCarthy, 1996; Itier, Alain, Sedore, & McIntosh, 2007; Yovel, 2016). On the other hand, the STS has been consistently implicated in expression processing (Engell & Haxby, 2007; Said, Moore, Engell, Todorov, & Haxby, 2010). The idea of domain-specificity in the brain with particular brain regions dedicated to aspects of
cognition, has stemmed from evolutionary psychology (Cosmides & Tooby, 1994), the study of phrenology (Simpson, 2005) and cognitive psychology (Fodor, 1983). Whilst this research implicates dedicated neural substrates in the processing of facial perception, other research has shown the domain-specificity of the human primary motor cortex (Meier, Aflalo, Kastner, & Graziano, 2008) and five domain-specific areas of social cognition (Saxe, 2006).
6 Figure 1.2. Face models of Emotion Recognition. a. Bruce and Young’s (1986) model of face perception, expression analysis occurs after structural encoding. b. Haxby et al.’s (2000) hierarchical model of brain areas involved in processing faces (Apicella, Sicca, Federico, Campatelli, and Muratori, 2013). c. Duchaine and Yovel’s (2015) revised neural framework for face processing revealing additional selective areas in anterior regions of the brain. This model shows a ventral face-processing pathway through the OFA, FFA and the Anterior Temporal Lobe (ATL), and a dorsal face-processing pathway, through the STS and the inferior frontal gyrus (IFG). -FA; face selective area. Model shows back connections/recurrent processing.
a. b.
c.
7 However, other research contradicts the finding of STS’s independent
involvement in processing changeable facial features and the segregation of identity and expression areas within the brain. This has been shown in adaptation studies finding the FFA (C. J. Fox, Moon, Iaria, & Barton, 2009; X. Xu & Biederman, 2010) and STS (C. J. Fox et al., 2009) sensitive to changes in both the perception of
identity and expression. Furthermore, information about facial expressions has been represented in FG activation as opposed to the STS, within the same areas that represent identity (Li et al., 2018). Moreover Haxby et al. (2001) discredited
evidence for domain specificity, finding representations between objects and faces to overlap in the ventral temporal cortex.
In light of new research and the contradictory results for domain specificity, findings for the roles and connections between face-selective areas were reviewed by Duchaine and Yovel (2015). These findings proposed several modifications and additions to Haxby’s (2000) leading face model of emotion recognition (Duchaine & Yovel, 2015). Firstly, further evidence implicating the role of the FFA in the
perception of changeable aspects of the face were discussed, and thus the role of this region in Haxby’s (2000) version needed to be revised. Overall, the FFA is
epitomised to have a general role in representing invariant facial structure
information, such as identity, gender or age information, in addition to a contributing role in the recognition of facial expressions. Furthermore, Duchaine and Yovel (2015) identified three additional anterior face-selective areas besides the OFA, FFA and pSTS, namely the anterior temporal lobe (ATL), the anterior superior temporal sulcus (aSTS) and the inferior frontal gyrus (IFG), see Figure 1.2c. Duchaine and Yovel (2015) further showed that three of these regions, the pSTS, aSTS and IFG responded greater to dynamic face stimuli. Based on the new evidence they revised the three original core areas of Haxby’s (2000) model and additional regions into a framework with a dorsal and ventral face-processing pathway. As such the areas that responded greater to dynamic face stimuli and gaze information were in the dorsal face processing pathway, driven by motion and form information, whereas the OFA, FFA and ATL comprised the ventral processing pathway, representing form
information but also contributing to facial expression recognition. In the ventral route, the processing of structural information develops from processing faces in one particular view (view-specific), to processing across symmetrical viewpoints, and
8 finally to processing from any viewpoint (view-independent) that contains key featural information.
1.1.3 Using FMRI to Investigate the Regions Involved in Expression Recognition: Univariate or Multi-Voxel Pattern Analysis (MVPA).
Univariate fMRI analyses investigate the activation of regions in response to a specific stimulus, with activated voxels indicating their involvement (Mur,
Bandettini, & Kriegeskorte, 2009). In univariate analyses, general linear models (GLM) are used to investigate activation between experimental conditions, both at a single-subject and group-level basis. It is important to note that these analyses lack sensitivity, as activation is spatially smoothed and averaged across voxels within a region of interest (ROI) (Haynes & Rees, 2006; Mur et al., 2009; Norman, Polyn, Detre, & Haxby, 2006). An abundance of fMRI (Functional Magnetic Resonance Imaging) studies use this analysis to investigate the regions involved in the perception and experience of emotion, however, studies are gradually applying MVPA to also investigate these regions. MVPA investigates the representational content of regions, allowing patterns of brain activation to be extracted and
compared across stimuli or experimental conditions (Mur et al., 2009). Therefore, in this analysis, differences between conditions can be detected for the same ROI with fine-grained pattern information (Norman et al., 2006; Tong & Pratte, 2012). In MVPA, advanced pattern-classification algorithms are applied to fMRI data, these aim to decode information represented in an individual region of a participant’s brain (Haynes, 2015; Mur et al., 2009; Norman et al., 2006). Thus, MVPA is a more sensitive measure than univariate analyses in recognising cognitive states and the organisation of these within the brain (Coutanche, Solomon, & Thompson-Schill, 2016; Norman et al., 2006). As a result of this, MVPA is the preferred choice of analysis in future fMRI studies investigating the regions involved in expression recognition.
1.1.3.1 FMRI studies investigating the regions involved in expression recognition.
Univariate fMRI (Functional Magnetic Resonance Imaging) research has focussed on investigating neural substrates dedicated to the perception and experience of an individual emotion (Lindquist, Wager, Kober, Bliss-Moreau, & Barrett, 2012). Findings from these univariate meta-analyses vary, with some suggesting the involvement of separate brain areas responsible for the experience of
9 discrete emotions (Phan, Wager, Taylor, & Liberzon, 2002), to others finding the perception and experience of emotion to activate areas across the brain (Fusar-Poli et al., 2009; Kober et al., 2008; Lindquist et al., 2012). Whilst the amygdala-fear hypothesis has been consistently supported, with the perception and experience of fear specifically linked to amygdala activity in 60% of studies (Murphy, Nimmo-Smith, & Lawrence, 2003; Phan et al., 2002); this finding is called into question with the processing of other emotions, including happiness, sadness, neutral, disgust and anger, which have been found to similarly activate the amygdala (Fusar-Poli et al., 2009; Murphy et al., 2003; van der Gaag, Minderaa, & Keysers, 2007). Thus, more recently the amygdala has been recognised as a centre for vigilance with face responsive neurons processing affective salient, uncertain, novel or unusual stimuli irrespective of valence (Fusar-Poli et al., 2009; Lindquist et al., 2012). Furthermore insular and basal ganglia activation has been consistently linked to the perception and experience of disgust, however increased activity also corresponds with
experiencing anger, happiness or fear (Fusar-Poli et al., 2009; Lindquist et al., 2012; Phan et al., 2002; van der Gaag et al., 2007). Thus this region may correspond to valence and regulate approach or avoidance behaviour (Phan et al., 2002). Further hypotheses have linked activity in the lateral orbitofrontal cortex (OFC) to the experience and perception of anger, and activity in the Anterior Cingulate Cortex (ACC) to the perception and experience of sadness and happiness (Fusar-Poli et al., 2009; Lindquist et al., 2012).
Whilst correlations persist between certain brain areas and emotion
categories, these may arise in the bias to report previously identified areas (Kober et al., 2008), thus overlooking the associated emotion labels is likely to yield new insights into the organisation of emotion in the brain (Kober et al., 2008). Therefore, Kober et al. (2008) undertook an inductive data-driven approach to which they located activated brain areas independent of basic emotion categories. They did this by identifying activated voxels in emotion perception and experience studies, and used a nonmetric dimensional scaling (NDMS) reduction technique and clustering to classify voxels into regions. This approach identified six functionally distributed networks in the brain for emotion (e.g. for visual processing, attention, regulation of emotion, motivation, selecting context appropriate actions, salience), with vast interconnections predominantly occurring between frontal and limbic areas (Kober et al., 2008). Connectivity may stem from posterior areas, such as the IOG, to the
10 prefrontal cortex (PFC), potentially bypassing limbic structures such as the amygdala (Dima, Stephan, Roiser, Friston, & Frangou, 2011). The PFC has been found to have an important role in the recognition of facial expressions (Dalgleish, 2004; Dima et al., 2011; Kober et al., 2008), in constructing knowledge of an emotion (Fusar-Poli et al., 2009).
Additionally a number of cortical and subcortical areas have been suggested in the emotional brain (Dalgleish, 2004; Kober et al., 2008); particularly the early role of occipital and temporal areas and the subsequent requirement of the amygdala to process emotional faces (Fusar-Poli et al., 2009). Moreover, a study by Saarimäki et al. (2015) found distinct neural signature patterns across the somatomotor and limbic regions for the experience of emotions, using Multi-Voxel Pattern Analysis (MVPA; an analysis technique that will be discussed further in the next paragraph). Alternatively an interplay between two neural systems: a ventral and dorsal stream have been suggested to identify, produce and regulate emotion (M. L. Phillips, Drevets, Rauch, & Lane, 2003). Furthermore, Haxby et al. (2000)’s identification of a core and extended system, and Pessoa and Adolphs (2010)’s multiple-waves model (see Figure 1.3), show additional support for a distributed network of brain regions involved in the processing of faces or emotions (Haxby & Gobbini, 2011). The distributed nature of activation may be a result of combining a variety of stimuli, measures, experimental tasks and different ways of transforming and pre-processing data (Lindquist et al., 2012).
Figure 1.3. Diagram of the multiple-waves model of processing showing the
involvement of a distributed network of brain areas in the recognition of emotion. TE and TEO, Inferior temporal area, from Pessoa and Adolphs (2010).
11 MVPA decoding studies have investigated selected regions involved in emotion perception, finding reliable decoding in the STS (Said et al., 2010), FFA (Harry, Williams, Davis, & Kim, 2013) and early visual cortex (Harry et al., 2013; Petro, Smith, Schyns, & Muckli, 2013). However, to allow comparisons to be made between regions, Wegrzyn et al. (2015) considered the seven brain regions involved in the core and extended face network, outlined in Haxby’s model of face processing (Haxby & Gobbini, 2011). MVPA was implemented in seven regions of interest (ROI’s, see Figure 1.4) to decode happiness, anger, fear and neutral expressions in a gender recognition task (Wegrzyn et al., 2015). They found decoding accuracies above chance in all ROI’s, including the FG, STS and inferior occipital (IO) areas which form the core face network, as well as the anterior temporal (AT), insula (INS), intraparietal sulcus (IS), and the amygdala which form the extended face network (Wegrzyn et al., 2015). Highest decoding accuracy was present in the FG and STS, whereas decoding was lowest in the amygdala (Wegrzyn et al., 2015). Whilst these results show support for the regions conceptualised by Haxby et al. (2000), emotion recognition appears dependent on further overlapping and
distributed neural mechanisms. The consistent finding of FFA or FG involvement in emotion (C. J. Fox et al., 2009; Fusar-Poli et al., 2009; Kawasaki et al., 2011) is surprising giving its initial conceptualisation of processing invariant facial features such as identity. Thus, the FFA may broadly be responsible for face processing (identity and expression) in which an individual has visual expertise (Tarr & Gauthier, 2000). However, the role of the FFA in the perception of changeable aspects of the face, or expression processing was later identified in the revised model of face processing by Duchaine and Yovel (2015), mentioned above. Furthermore, other literature suggests the role of the FFA in the processing of facial expression, as well as its role in processing structural identity information (Vuillemier, Armony, Driver, & Dolan, 2001; Ganel, Valyear, Goshen-Gottshein, & Goodale, 2005; Duchaine & Yovel, 2015). Vuillemier et al. (2001) found greater right fusiform and amygdala activation in response to fearful than neutral expressions, independent of attention; thereby concluding that the FFA may be receiving feedback related to an emotional response from the amygdala.
Furthermore, in Wegrzyn et al. (2015), the FG is not significantly different from decoding accuracy in the STS, but significantly higher than the amygdala, insula, intraparietal sulcus and the IOG. This is surprising given these other regions
12 are highly involved in processing emotion. However, this could be due to a number of reasons: the static face stimuli were not enough to elicit an arousal response, the difficulty of scanning limbic structures in fMRI or the absence of disgust stimuli (Wegrzyn et al., 2015). Critically, however, Wegrzyn et al. (2015) do not generalise across specific face identities or other non-overlapping representations in their MVPA, and thus do not necessarily tap into high-level representations to minimise the role of low-level features in decoding. Thus, their basic decoding analysis could be strongly influenced by low-level effects.
Figure 1.4. Mean accuracy for all seven ROI’s selected in Wegrzyn et al. (2015), successful recognition in all brain areas is above chance (25%); FG, fusiform gyrus, STS, superior temporal sulcus; AT, anterior temporal; INS, insula; IS, intraparietal sulcus; IO, inferior occipital gyri; AMY, amygdala. Image from Wegrzyn et al. (2015).
Zhang et al. (2016) used a hierarchical classification analysis to investigate whether facial expressions (neutral, fear, angry and happiness) could be
differentiated from other expressions in a number of face-selective regions. They found decoding present in the amygdala, primarily between fearful and non-fearful faces, and at a second-level classification between neutral and emotional faces (Zhang et al., 2016). Furthermore they found decoding in the posterior STS between neutral and emotional faces, and at the next level of analysis between happy versus fearful and angry faces, playing an additionalrole in discerning positive from
negative emotions (Zhang et al., 2016). They did not find significant decoding within their other regions of interest (ROI’s) including the OFA, FFA, aIT and V1; this may be due to using a slow event-related design because this is associated with lower statistical power and subject expectation and habituation, as a consequence of slow
13 and repeated stimuli presentations. Furthermore, the absence of this decoding may be due to the stringent permutation used to test for significance or generalising across identity (Zhang et al., 2016). However, it is important to highlight, unlike Wegrzyn et al. (2015), that this study, generalising across specific trained and then tested face identities in their MVPA analysis, is able to minimise the role of low-level features in decoding and consequently tap into high-level representations. This study also advocates evidence for the neural dissociation in expression and identity recognition, as decoding of identity was found in the FFA and aIT (Zhang et al., 2016).
Furthermore to augment the previous findings, a recent study, using all six basic emotions, found strong decoding accuracy in bilateral FFA, OFA and posterior rSTS; as well as in motion-selective areas: V5f/hMT+ and another posterior rSTS ROI (defined from a separate localiser but partially overlapping with the previous face-selective STS) (Liang et al., 2017). These findings support Wegrzyn et al. (2015) with significant decoding accuracy present in the FG and STS. Alongside these regions, finding significance in OFA (situated in or close to the inferior occipital gyrus) further supports the regions identified in Haxby’s model of face processing (Haxby & Gobbini, 2011). However, it is important to note that this study, akin to Wegrzyn et al. (2015), only carried out basic decoding and did not generalise across specific face identities or representations in further MVPA cross-classification analyses. Therefore again, this study may not necessarily be tapping into high-level representations and could be strongly influenced by low-level effects.
1.1.4 Bottom-up Versus Top-down Models of the Visual System.
Computational models present a bottom-up feedforward approach to expression recognition, assuming that the visual cortex (V1) provides a direct representation of a presented visual signal (Kober et al., 2008; Murphy et al., 2003). This corresponds with standard models of V1 that establish the properties of V1’s simple and complex cell responses (i.e. tuned for orientation, motion, colour and spatial frequency). Based on these assumptions, simple computational models (as aforementioned previously when detailing the visual stream model), have been developed to depict this feedforward network of expression recognition, representing some vital functions that occur within the visual system (Dailey et al., 2002). These neural network models are comprised of three processing layers (see Figure 1.1): the first layer, a perceptual analysis of V1, is carried out with the use of a Gabor filter to model the response properties of neurons in V1 (including edge detection), the