University of Wollongong
University of Wollongong
Research Online
Research Online
Faculty of Science, Medicine and Health -
Papers: Part B
Faculty of Science, Medicine and Health
1-1-2020
The SPECCHIO Spectral Information System
The SPECCHIO Spectral Information System
Andreas Hueni
Laurie A. Chisholm
University of Wollongong, [email protected]
Cindy Ong
Tim Malthus
Mathew Wyatt
See next page for additional authors
Follow this and additional works at: https://ro.uow.edu.au/smhpapers1
Publication Details Citation
Publication Details Citation
Hueni, A., Chisholm, L. A., Ong, C., Malthus, T., Wyatt, M., Trim, S., Schaepman, M., & Thankappan, M. (2020). The SPECCHIO Spectral Information System. Faculty of Science, Medicine and Health - Papers: Part B. Retrieved from https://ro.uow.edu.au/smhpapers1/1702
Research Online is the open access institutional repository for the University of Wollongong. For further information contact the UOW Library: [email protected]
Abstract
Abstract
© 2020 IEEE. Spectral Information Systems provide a framework to assemble, curate, and serve spectral data and their associated metadata. This article documents the evolution of the SPECCHIO system, devised to enable long-term usability and data-sharing of field spectroradiometer data. The new
capabilities include a modern, web-based client-server architecture, a flexible metadata storage scheme for generic metadata handling, and a rich application programming interface, enabling scientists to directly access spectral data and metadata from their programming environment of choice. The
SPECCHIO system source code has been moved into the open source domain to stimulate contributions from the spectroscopy community while binary distributions, including the SPECCHIO virtual machine, simplify the installation and use of the system for the end-users.
Publication Details
Publication Details
Hueni, A., Chisholm, L., Ong, C., Malthus, T., Wyatt, M., Trim, S., Schaepman, M. & Thankappan, M. (2020). The SPECCHIO Spectral Information System. IEEE Journal of Selected Topics in Applied Earth
Observations and Remote Sensing, 13 5789-5799.
Authors
Authors
Andreas Hueni, Laurie A. Chisholm, Cindy Ong, Tim Malthus, Mathew Wyatt, Simon Trim, Michael Schaepman, and Medhavy Thankappan
IEEE JOURNAL OF SELECTED TOPICS IN APPLIED EARTH OBSERVATIONS AND REMOTE SENSING, VOL. 13, 2020 5789
The SPECCHIO Spectral Information System
Andreas Hueni
, Member, IEEE
, Laurie A. Chisholm
, Cindy Ong
, Member, IEEE
, Tim J. Malthus
,
Mathew Wyatt, Simon A. Trim, Michael E. Schaepman
, Senior Member, IEEE
, and Medhavy Thankappan
Abstract—Spectral Information Systems provide a framework to assemble, curate, and serve spectral data and their associated metadata. This article documents the evolution of the SPECCHIO system, devised to enable long-term usability and data-sharing of field spectroradiometer data. The new capabilities include a modern, web-based client-server architecture, a flexible metadata storage scheme for generic metadata handling, and a rich applica-tion programming interface, enabling scientists to directly access spectral data and metadata from their programming environment of choice. The SPECCHIO system source code has been moved into the open source domain to stimulate contributions from the spectroscopy community while binary distributions, including the SPECCHIO virtual machine, simplify the installation and use of the system for the end-users.
Index Terms—Information systems, metadata, relational databases, spectroradiometers, spectroscopy.
I. INTRODUCTION
S
PECTRAL signatures, acquired by spectroradiometers measuring emitted or reflected electromagnetic radiation, are used for a wide range of Earth System science purposes [1]. The quality and interpretation of air- or satellite-borne, remotely sensed spectral signatures relies essentially on calibration [2], validation, comparisons, and models [3], [4], all of which, in turn, often rely onin situspectral data. Consequently, field and laboratory spectroscopy are indispensable tools to provide theManuscript received April 29, 2020; revised July 28, 2020 and August 23, 2020; accepted September 14, 2020. Date of publication September 21, 2020; date of current version October 2, 2020. This work was supported in part by the COST Action Eurospec, in part by the Australian National Data Service project DC-10, in part by the APEX Airborne Prism Experiment, in part by the Swiss Commission on Remote Sensing, and in part by MetEOC projects through the EMRP and EMPIR Programmes co-financed by the Participating States and from the European Union’s Horizon 2020 research and innovation programme. The work of Andreas Hueni and Michael E. Schaepman was supported by the University of Zurich Priority Programme on Global Change and Biodiversity.
(Corresponding author: Andreas Hueni.)
Andreas Hueni, Simon A. Trim, and Michael E. Schaepman are with Re-mote Sensing Laboratories, University of Zurich, 8057 Zurich, Switzerland (e-mail: [email protected]; [email protected]; michael.schaepman@ xgeo.uzh.ch).
Laurie A. Chisholm is with the Faculty of Science, University of Wollongong, Wollongong, NSW 2522, Australia (e-mail: [email protected]).
Cindy Ong is with Mineral Resources, CSIRO, Clayton, VIC 3169, Australia (e-mail: [email protected]).
Tim J. Malthus is with Coasts Program, CSIRO Oceans and Atmosphere, Brisbane, QLD 4102, Australia (e-mail: [email protected]).
Mathew Wyatt is with the Indian Ocean Marine Research Centre, Australian Institute of Marine Science, Crawley WA, Australia (e-mail: [email protected]).
Medhavy Thankappan is with the Environmental Geoscience Divi-sion, Geoscience Australia, Canberra, ACT 2609, Australia (e-mail: [email protected]).
Digital Object Identifier 10.1109/JSTARS.2020.3025117
required reference and training data, but they also represent a research method in their own right [5].
The value of spectral data is strongly linked to information about the measurement context [6], i.e., the description of the target and its sampling environment at the time of measurement. Proximal sensing methods offer generally a higher degree of control over explanatory variables and the statistical sampling used in the experiment than airborne or space-based acquisitions. The target and its extent, the time of day and the illumination conditions may be chosen more freely (and repeatedly), while the measurement context can be defined by auxiliary in situ
measurements and protocols. In many cases, datasets obtained in such a manner are viewed to be of veridical, i.e., truthful, nature, colloquially referred to as “ground truth.” This may be linked to the belief that proximity and perceived control of the sampling process result in correct data, with many newer users of field spectroscopy underestimating the involved complexities [7]. It is however a fact that all measured data are uncertain and thus there may be no such thing as “ground truth” [8]. Furthermore, comparisons with datasets acquired by other sen-sors at different spatial resolutions, instantaneous fields-of-view, and viewing/illumination angles are hampered by scaling and BRDF issues [3], [8]–[10]. This once more corroborates the need for precise documentation of measurement conditions [7], in particular if datasets are to be made fit for long-term use and applicable for a variety of purposes by a wider community. We argue here that the term “ground truth” refers to a more advanced set of metadata available of the target measuredin situ, as well as more intrinsic knowledge of the target, rather than to a superior physical measurement on the ground.
The technical solution to enable such long-term usability and data sharing is the spectral database [11]–[13], acting as a repository for spectral data and their metadata, where the metadata provide the alluded measurement context, essentially giving meaning to the data [14].
A number of spectral databases have appeared over the past decade since the second version of the SPECCHIO spectral database system [11] was designed and implemented. Examples of such systems are the Ahvaz Spectral Geodatabase Platform [15], a workflow for spectroradiometric field surveys including a spectral database [16], a landcover database in Egypt [17], a multispectral material signature database [18], a spectral li-brary for outcrop characterization [19], and the generic EcoSIS solution [20], amongst many others.
All of these works are based to a large extent on the metadata schemas introduced by SPECCHIO versions 1 and 2 [11], [13], but add their individual flavours to accomplish application
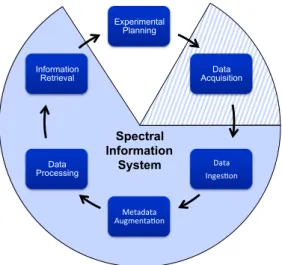
Fig. 1. Spectroscopy data life cycle, supported by a spectral information system.
specific services, such as geographic information system, spectral processing or analysis functionality. This indicates a paradigm shift towards more informed systems, which we term Spectral Information Systems (SIS) and define as follows:
SIS are systems for building and providing spectral information, utilizing spectral databases as repositories for spectral data and associated metadata.
SIS support the spectroscopy data life cycle [21] by giving metadata-specific guidance during data acquisition, providing automated data ingestion, functions for metadata augmentation (i.e., annotating spectral data with metadata), and spectral data and metadata processing, thus enabling the information retrieval to build knowledge and new conclusions leading to improved experimental planning (see Fig. 1). Information is inferred from data [22] by both metadata augmentation and data processing.
Our experiences with designing and using SPECCHIO V2 as well as the review of the implementations of other spectral libraries alluded to above have helped to shape the require-ments for the next generation of spectral information systems. This requirement analysis was significantly supported by the Australian National Data Service (ANDS) data capture project DC-10, aimed at establishing an Australian spectral database system. The most essential findings are summarized as follows. 1) Metadata requirements are a function of the different user groups and their application domain, with each group tending to use a set of general meta attributes plus domain specific ones [23], [24].
2) Native sensor file format support by the data ingestion process is an ongoing task as industry continues to de-velop spectral sensors to meet scientific requirements, e.g., the measurement of fluorescence [25]. The SIS must allow generic spectral data storage, i.e., provide multi-instrument support. Essentially, while the storage is generic, the file reading is sensor or company specific. 3) Sharing data within research groups requires a more
de-tailed management of user rights to allow collaborative research.
4) The demand for increased visibility of data requires the feeding of data discovery portals, where a portal is a website that gives users unified access to content [26], [27].
5) Monolithic systems with built-in scientific processing can never provide the analytical flexibility required by the broad range of disciplines and in particular by the per se individualistic nature of scientists.
6) The scalability of the SIS with number of spectra and related metadata quickly becomes a relevant issue with the deployment of automated sensors [4] and the aggregation of data on a continental scale, such as in the framework of Digital Earth Australia [28].
7) Access to the system should include a web browser-based option to enable easy, interactive data exploration without the need of installing specialized software.
Version 3 of SPECCHIO was designed to further meet these requirements by offering a flexible metadata system, enhancing the support of new sensors by automating the sensor definition in the database, supporting higher-level languages to allow scientists writing their own algorithms, and redesigning the stor-age system to enable scalability. Furthermore, the system was updated to a modern client–server architecture with increased system security to accommodate the hosting constraints of many institutions.
This article introduces the concepts chosen for the imple-mentation of SPECCHIO V3, documents the achieved results in terms of system capability and availability, demonstrates the sys-tem use in a case study, presents lessons learned, and discusses future system capabilities. It furthermore provides the required knowledge background for SPECCHIO end-users to customize their individual SPECCHIO instances by leveraging in particular the new, flexible, and powerful Entity-Attribute-Value based metadata storage, and optimize their system usage.
II. CONCEPTS
The concepts described in this section address the latest requirements for spectral information systems and reflect the solutions chosen for the SPECCHIO V3 system.
A. SPECCHIO V3 System Architecture
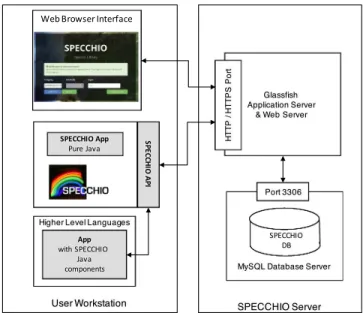
SPECCHIO V3 is based on a client–server-based architecture (see Fig. 2) using the open-source Glassfish application server1 and the open-source Jersey RESTful web services framework.2 All communication of the SPECCHIO Java client with the spectral database on the server side including user authentication is handled via the Glassfish server in the SPECCHIO application service, effectively shielding the database from direct user access via Structured Query Language (SQL) calls. Java objects are passed between client and server encoded as XML via Hypertext Transfer Protocol Secure (HTTPS), but communication may also use the unencrypted Hypertext Transfer Protocol (HTTP).
1[Online]. Available: https://javaee.github.io/glassfish/ 2[Online]. Available: https://jersey.github.io
HUENIet al.: THE SPECCHIO SPECTRAL INFORMATION SYSTEM 5791
Fig. 2. SPECCHIO V3 system architecture showing the encapsulation of the MySQL-based spectral database by using a Glassfish application server for all communication.
Higher-level languages also rely on the SPECCHIO Java client for communication with the SPECCHIO application ser-vice.
The web browser interface is supported through the Glassfish server by the SPECCHIO web service. This web service itself uses the SPECCHIO application programming interface (API) to communicate with the SPECCHIO application service.
B. Support of Higher-Level Processing Languages
The number of applications of spectroscopy is enormous [29], [30] and consequently an ever-growing plethora of analysis tech-niques exist. Algorithms to process spectral data are developed by scientists using various programming languages and must invariably deal with spectral data selection, input and output. These basic functions are made available via the SPECCHIO API and thus allow the development of code that can operate on a common data pool, namely the SPECCHIO database run by the MySQL Relational Database Management System (see Fig. 3).
The SPECCHIO API provides a large number of functions to interact with the SPECCHIO database server, which are as follows:
1) spectral data selection via metadata space queries; 2) grouping of selected spectral data by metadata attributes; 3) extraction of metadata vectors for a given spectral dataset; 4) insert and update of spectral data and metadata; and 5) linking of new spectral information with existing
metadata.
The API allows the writing of code that supports the data life cycle stages of data ingestion, augmentation, information building, and retrieval [31]. A simple example of information building for a given set of spectra would be the determination of solar angles based on the UTC and latitude/longitude meta-data parameters, which in turn would contribute to metameta-data
Fig. 3. Tiers of the SPECCHIO system for higher-level language support, uti-lizing Java Bridge to interface scientific higher-level code with the SPECCHIO API.
augmentation. Thus, the generic SPECCHIO API supports the implementation of application or domain specific workflows by end users.
C. Flexible Metadata Storage and Redundancy Reduction
Metadata are of prime importance within spectral information systems as they define the context of the spectral data and enable their retrieval. There are no metadata standards of spectral data collections yet, although work toward such a goal is underway [23], [32]. It is expected that a standard would define a minimal set of mandatory attributes and allow for optional attributes. The applicability of spectroscopy to many fields, and in particular its ability to estimate bio-geophysical parameters has led to an ever-increasing demand to store application specific metadata.
A static, traditional relational database model, such as adopted for SPECCHIO version 2, offers no solution to such dynamic re-quirements. Hence, the Entity-Attribute-Value (EAV) paradigm [33] was chosen as the new data storage concept. By doing so, we took advantage of our previous experience of the EAV approach in the APEX Calibration and Information System [34], which is used to handle and process laboratory calibration data of the APEX airborne imaging spectroradiometer [35].
Within the EAV approach, attributes are defined in a meta-layer. Entities, i.e., the spectral data, refer to these attributes and actual attribute values are stored in a generic storage container [36].
The SPECCHIO system uses a generic value table that can store attribute values as integer, double, date/time, string, cate-gorical, spatial field, or binary. The default storage field as well as the cardinality per spectrum are part of the attribute definition. For any given attribute, the cardinality defines the number of permitted metadata values per spectrum, e.g., a capture time can occur only once per spectrum, while the latter may be associated with several keywords.
Categorical values are linked to defined vocabularies that are implemented as taxonomies. The taxonomy approach was based on the one used in the Australian Ecological Knowledge and Observation System [37].
Binary values can hold items such as pictures or PDF files encoded as binary streams. The interpretation of the content itself is a task of the system software and as such is irrelevant to the metadata storage concept.
Attributes are grouped into metadata categories to allow con-figurable, application/domain specific graphical user interfaces. Metadata of spectral data collections are highly redundant. Typically, a statistically relevant number of measurements will be acquired for the same target, also known as the measurand. The resulting spectra will usually have common attributes such as integration time, spatial location, and target description. The metadata storage model is normalized such that several spectra can refer to the same attribute value. Data normalization is car-ried out during data ingestion by using an attribute-value lookup table (LUT) containing already inserted values per database user to maintain system integrity. The data insert process checks the LUT for an identical attribute value, and, if existing, inserts a cross reference to the spectrum entity. For new values both the value and a cross-reference are inserted and the new value added to the LUT.
D. Metadata Storage Levels
Metadata are generally associated with a spectrum. This may seem obvious in first instance, but a more thorough analysis shows that many metaparameters are often shared by several spectra, as pointed out above. The SPECCHIO system has always supported the structuring of spectral data by hierarchies. This is in effect a grouping function and is exploited in the SPECCHIO system to carry out easy selections and updates via the hierarchical tree structure.
Linking metadata at the spectrum level, however, imposes some limitations once the sizes of spectral collections grow. The APEX spectral ground control point campaign, as more com-prehensively introduced later in the case study, comprises some 84’000 spectra and serves to illustrate the issue at this point. Two problems present themselves when annotating such a large dataset: 1) metaparameters that apply to all spectra, like a docu-ment describing a sampling approach common to all data acqui-sitions, will be stored once as a value, but will be linked to all spectra, creating∼84 000 entries in the spectrum to value cross-relational table, and 2) new datasets added to this campaign need to have these common metaparameters redefined explicitly.
Adding the hierarchy as a further storage level solves both is-sues: a single link is created between the value and the hierarchy, and new data inserted below this hierarchy will automatically inherit metadata defined at the hierarchy level.
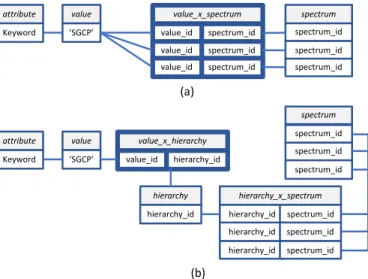
Fig. 4 illustrates the storage levels within the database. It must be noted that the tablehierarchy_x_spectrum is filled in all cases to speed up data selections via hierarchies, and hence no storage penalty is paid when linking metaparameter values at the hierarchy level.
E. Campaign Handling
Data storage in SPECCHIO is organized by campaigns, where a campaign is a high-level container for data collected, for example, a particular purpose or within a certain project. Actual sampling campaigns can be constrained both spatially
Fig. 4. Illustration of the storage levels by linking metaparameter values to spectra using the EAV paradigm. (a) Linking at spectrum level. (b) Linking at hierarchy level.
and temporally, but SPECCHIO applies no such restrictions, i.e., the campaign is a conceptual container grouping data that are in some manner related to each other.
A fundamental concept of the campaign is its relation to file system hierarchies holding spectral input files.3A campaign can be related to several directory structures, acting as data sources during data ingestion.
Campaigns can be built in the system over time by adding new data sources, all contributing to the same campaign. These sources can even be spread over different computers that may be situated in separate networks. Each data source is essentially an entry point into a file system hierarchy. The data ingestion process parses the underlying folders and files by using these entry points. Data loading replicates the hierarchy structure of each source within the database. Re-invocations of the data loader lead to the identification of additional files and folders and a consecutive loading. We term this feature the “delta-loading” capability. It supports the gradual building of campaigns, e.g., from data generated by a regular source of spectra, such as spec-trometers mounted on flux towers [38] or flown on unmanned aerial vehicles [39].
F. Research Groups
The concept of the research group allows the collaboration of researchers within the SPECCHIO system, working on a partic-ular campaign. Quite often, remote sensing campaigns involve participants from different institutions, each team handling a different aspect of the measurement process. In such cases, the resulting data can also be spread across the participating institutions. A research group is automatically created for each campaign. Initially, the user creating the campaign will be the only group member. Additional members can be added at any time to an existing campaign, which in turn lets them add their own data sources as well as add other team members.
3A list of supported input flies can be found online. Available: https://specchio.
HUENIet al.: THE SPECCHIO SPECTRAL INFORMATION SYSTEM 5793
G. Sensors, Instruments, and Calibrations
Sensors, instruments, and calibrations are part of the SPEC-CHIO relational database model. A sensor refers to the blueprint specification of a spectrometer, i.e., it is a theoretical concept. An instance of a sensor is called an instrument, i.e., it relates to an actual device that is usually identified by a serial number. Instruments tend to be wavelength calibrated, specifying an average wavelength per spectral band. The associated calibration file cannot be made to substitute the serial number as a means for identifying a specific device, as an instrument can be recalibrated over time, resulting in a different calibration file, while the serial number naturally remains constant. Depending on the manu-facturer, instruments resample their calibrated wavelengths to the sensor blueprint specification, while many others deliver the instrument and calibration specific center wavelength per band with each measured spectrum. Furthermore, instruments can also relate to radiometric calibration coefficients.
Instrument calibrations are handled via the calibration entity in the database. Each calibration holds the parameters that define the radiometric and spectral performance of a calibrated instrument and every spectrum captured by an instrument refers to the appropriate calibration in the database. Consequently, instrument coefficients such as wavelengths for a particular calibration are only stored once within the database.
The generation of sensors, instruments, and calibrations yet unknown to the system is automated upon data loading and calibration specific metadata are parsed from the input files where provided. The update of these database system tables requires administrator rights [40] to maintain the integrity of the system. The file loading process however allows such inserts by encapsulating them in a process on the server side, hence shielded from direct user interaction.
H. Generic Spectral Data Storage and Handling
Generic spectral vector storage in the SPECCHIO spectral database is based on binary large objects. Spectral vectors are stored as floating-point vectors represented as binary strings. This approach allows the storage of spectra irrespective of the number of spectral bands and also increases the retrieval flexibility and speed as spectra can be subset within SQL queries, e.g., allowing the selection of single spectral bands without the need to load the full spectrum into memory.
The system must also generically handle spectral data as the database can hold spectra acquired by different instruments. The concept is based on the spectral spaces paradigm [41], where a spectral space holds spectral vectors that share common characteristics: same number of spectral bands, identical center wavelengths and physical unit of measurement. Spaces are used throughout the system for processing, visualization, and file output. A space is a Java class comprising a Java array to hold the spectral vectors and information about the center wavelengths and physical unit. To deal with the handling of spaces, we introduce the Space Factory.
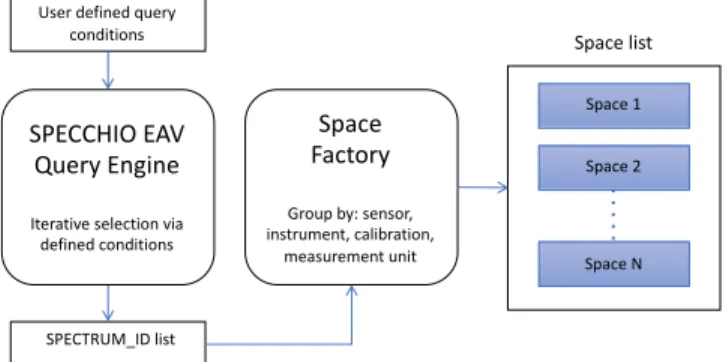
The Space Factory is a conceptual, central component of the SPECCHIO system. It creates new spaces based on given inputs and contains the logic to form “non-mixed” spaces. As
Fig. 5. Building of spaces by the Space Factory based on user defined query conditions.
an example, assume the use case of creating spectral plots of a number of spectra that were acquired by different instruments. To do so requires that spectral vectors are plotted versus their related wavelengths. Thus, spectra must be compiled into their spectral spaces first before any processing or plotting can be done.
In a first step, the user will select the spectra to be plotted by defining query conditions that are passed to the SPECCHIO EAV query engine. The query engine affects a subspace projection [42]. This yields a number of spectrum IDs that are matching the user’s selection. These IDs are then handed to the Space Factory. The Space Factory creates spaces for all existing combinations of the sensors, instruments, calibrations, and measurement units associated with the selected spectra (see Fig. 5).
Utilizing the Space Factory ensures that all spectra contained by a space have a common wavelength per band and the same measurement unit. Spectral spaces and the Space Factory are be-ing used extensively when implementbe-ing any spectral processbe-ing based on the SPECCHIO API.
III. RESULTS
A. Comparison of SPECCHIO Versions 2 and 3
This section highlights the changes that were made in the upgrade from SPECCHIO V2 to V3. Each of the following table blocks Table I lists the capability or quantity for V2 and V3 and the specific update (>) that was applied.
B. Open Source
The new SPECCHIO version has been moved to open source as per ANDS regulations. The source code of version 3 was initially deposited on an ANDS project related github4account, but merged consecutively with the version curated by the Re-mote Sensing Laboratories (RSL) at the University Zurich. This federated SPECCHIO code is available via github [43].
C. System Availability
Most end users prefer to either connect to an existing SPEC-CHIO instance, where data can be shared with other existing
TABLE I
LIST OFMAJORCHANGES(>) FROMSPECCHIO V2TOV3 FEATURE users, or to setup their own local instance while avoiding the complexities of an installation at the server end from scratch.
D. Clients
The SPECCHIO client software is able to connect to any SPECCHIO server instance. It is compiled in two versions sup-porting generic platforms and MacOS X specifically. The instal-lation package is available for download from the SPECCHIO webpage.5At the time of writing, SPECCHIO runs seamlessly on Java version 8, build 212 or lower. Users with higher Java build numbers should install the latest version of the SPECCHIO client or refer to further information given in the SPECCHIO FAQ6 to avoid certification problems caused by more recent versions of Java.
E. SPECCHIO Virtual Machine
The complete SPECCHIO system including database, Glass-fish application server and client has been setup in a CentOS 7 system within an Oracle Virtual Machine. Users can download7 this readymade solution and run it on their own machines.
F. Australian SPECCHIO Instance
The new SPECCHIO version was made available to the Australian community in mid-2013 and operated by the Uni-versity of Wollongong. This instance is planned to transition to Geoscience Australia (GA) to provide operational hosting and long-term custodianship of SPECCHIO. GA expects to operate this Australian instance as a continental-wide data source within the framework of Digital Earth Australia Program [28], where it is expected to be used routinely for calibration and validation of multisource satellite data [44].
A metadata feed has been implemented for the Research Data Australia service of the ANDS portal. Any SPECCHIO server can be configured to support publishing of information to ANDS. A similar data feed has been conceptualized for the Terrestrial Ecosystem Research Network (TERN)8as well, but has not been implemented at the time of writing. A spectral dataset may be published on the ANDS portal by carrying out a data selection in the SPECCHIO user interface, choose a principal investigator and hitting the “Publish Collection” button, which in turn will autogenerate an RIF-CS XML file that is sent to the ANDS server and ingested on a periodic basis. An ANDS Collection Key will be generated upon publishing and added as new metadata value to all exported spectra, allowing their identification within the SPECCHIO system.
G. Worldwide SPECCHIO Online Instance
The University of Zurich maintains an online instance of the SPECCHIO system, available to users worldwide for testing and productive purposes. The productive database contains some 154 700 spectra (Date: 27.04.2020).
5[Online]. Available: https://specchio.ch/downloads/ 6[Online]. Available: https://specchio.ch/faq/ 7[Online]. Available: https://specchio.ch/downloads/ 8[Online]. Available: www.tern.org.au
HUENIet al.: THE SPECCHIO SPECTRAL INFORMATION SYSTEM 5795
TABLE II
NUMBER OFATTRIBUTES ANDDATADETAILSPERDATATYPE
H. Metadata Attributes
The metadata supported by SPECCHIO has been consider-ably updated, utilizing the EAV paradigm. The attribute table is prefilled with 380 entries of eight different data types (see Table II). A detailed list of all available attributes can be dis-played via a function within the SPECCHIO client application. The large number of floating-point data type attributes is mainly related to the support of bio- and geophysical variables from the domains vegetation, soil, and geochemistry.
New attributes can be added to the system by administrators using MySQL insert statements. Once added, they become immediately available to all clients after the SPECCHIO ap-plication service has been restarted.
I. Metadata Entry Methods and Redundancy Reduction
Entering metadata has been made easier and faster by support-ing metadata augmentation from tabular data held in Microsoft Excel files. Existing spectral data can be updated with new metadata by using matching between metaparameters existing in both the database and the input file, e.g., sample plot num-bers encoded within the spectral file names may be matched with corresponding numbers in the Excel file using wildcard9 definitions.
The efficiency of the automated metadata redundancy reduc-tion is essentially a funcreduc-tion of the redundancy of the input data as only existing redundancies can be minimized. Reductions for, e.g., Analytical Spectral Devices spectrometer binary files amount to an average of 70% with a standard deviation of 10%.
9Wildcard: a symbol such as an asterisk which can be used to represent any
character or range of characters in certain commands.
J. Supported Input File Formats
The number of supported input files has been enhanced to 19 different formats. Native file loading is the preferred option as metadata can be automatically extracted and ingested into the SPECCHIO metaparameter table. The SPECCHIO webpage features a collection of spectral file formats with example files provided to help the user community checking on file format compliance.10
K. SPECCHIO API
The SPECCHIO API is implemented in a Java class and documented online [47]. Any programming language supporting Java either natively such as MATLAB [48] or via bridging technologies, e.g., R via the rJava package [49] or Python via JPype [50], can therefore be used to interface SPECCHIO (see Fig. 3). All other SPECCHIO classes available in the client may also be used to interact with the system to maximum effect. Use cases of the SPECCHIO API can be found online.11
L. SPECCHIO Web Interface
The building of dynamic interactive web pages for spec-tral data exploration was first prototyped using the VAADIN framework.12 The concept was greatly refined in collabora-tion with the University of Applied Sciences of Northwestern Switzerland (FHNW), leading to an appealing solution,13where data can be queried by dynamic metadata restrictions [51]. This implementation uses Java and Java Script and relies on the SPECCHIO Java API, thus greatly reducing the required implementation and updating efforts.
M. SPECCHIO Graphical User Interface
Most of SPECCHIO’s graphical user interfaces (GUI) were redesigned due to the change to the EAV based metaparameter storage. As a consequence, no software updates are required when new metadata attributes are added to the system. The building of GUIs like the Metadata Editor (see Fig. 6) is purely generic and dependent on the metadata configuration of the SPECCHIO server the client is connected to.
The introduction of an attribute called the Application Do-main allows the control of the metadata categories shown by default. The Application Domain is a taxonomy that can be extended or modified by the system administrator via MySQL statements. It thus enables end users to be presented with cate-gories tuned according to their research domain. Fig. 6 shows the default categories for the Spectral Ground Control Point (SGCP) domain [8].
IV. CASESTUDY
This section exemplifies the practical application of SPEC-CHIO. We selected the spectral ground control point (SGCP)
10[Online]. Available: https://specchio.ch/faq/ 11[Online]. Available: https://specchio.ch/guides/ 12[Online]. Available: https://vaadin.com
13[Online]. Available: http://sc22.geo.uzh.ch:8080/SPECCHIO_Web_
Fig. 6. SPECCHIO Metadata Editor graphical user interface illustrating the hierarchical data browser for data selection (left side), metadata fields grouped by categories (middle) and category selection panel showing the default config-uration for SGCPs (right side).
Fig. 7. Spectroscopy data life cycle as applied for SGCP campaign data.
campaign carried out in the framework of calibration and val-idation for the APEX airborne imaging spectrometer [8], [35], [52] to serve as an example. This campaign comprises some 101’300 spectra (Date: 28.04.2020) at various processing levels (digital numbers, radiances, and reflectance factors), collected over ten years of APEX operation. A fair amount of labor has been invested in annotating these data with spatial location and elevation, target classification, UTC time stamp, solar angles, cloud cover, photographs, field protocol scans, processing algo-rithm notes serving as provenance information, spatial sampling scheme, beam geometry [46], sensor to target distance, mea-surement support definition [10], and corresponding airborne mission identifier (see also Fig. 6 for an example of an SGCP reflectance set displayed in the Metadata Editor). The life cycle steps applying to this SGCP campaign are shown in Fig. 7. Data are imported from ASD binary files and augmented with most of their metadata using the SPECCHIO Metadata Editor (see Fig. 6). Additional metadata are inserted by algorithms written in MATLAB as described below.
These import and processing steps can be carried out by all researchers added as collaborators to the SGCP campaign. This allows that each field team can individually upload their SGCP data into the database. Each field mission gets an airborne mission designator in its top folder to allow easy identification. This can be observed in Fig. 6, where the hierarchy names under the campaign “APEX Spectral Ground Control” all start with APEX mission designators, like M0150. This arrangement, combined with a guideline on how to load and augment SGCP data, enables the loading of data into SPECCHIO from various machines and operating systems and by different people at their own time.
Radiance data are processed in a purpose-built, interactive MATLAB [48] software tool, utilizing the SPECCHIO API, to produce reflectance factors, involving the following steps:
1) automated flagging of white reference and target spectra in the metadata;
2) correction of radiometric steps between detectors [53] and storage of corrected radiances as intermediate products in the database;
3) interpolation of reference panel radiances over time, re-sampled to the time stamps of the target spectra; and 4) storage of the computed reflectance factors in the database. Reflectance data are used to validate and quality control APEX surface reflectance data and APEX at-sensor radiances, the latter by employing radiative transfer modeling [8]. These validation processes can be largely automated by combining the metadata of bothin situand airborne datasets, as originally conceptualized for the APEX processing and archiving facility [52] and recently implemented operationally [54]. In essence, the SPECCHIO system is queried for each flight line to identify spectra matching the airborne acquisition in both space and time. The spectrum metadata is sufficiently detailed to produce validation products with automated, target-specific annotations. An example of such an automated validation is shown in Fig. 8, indicating some remaining calibration problems, such as a loss of energy in the blue wavelengths below 450 nm or interpolation artifacts in water vapor absorption regions.
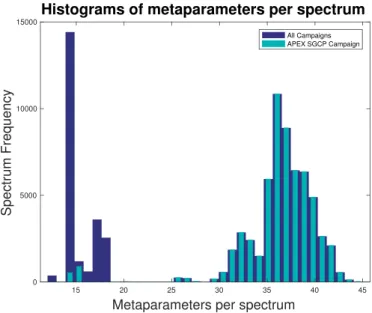
An analysis of the UZH RSL in-house database, hosting the APEX SGCP campaign among others, shows that the average number of metaparameters per spectrum is 15, while a carefully curated dataset like the APEX SGCP campaign reaches a mean of 36 (see Fig. 10).
Specific information about instruments, including their spec-tral and radiometric calibration, is not part of the metaparameter count mentioned above, but is regarded a system information which can only be changed by administrators or server processes having administrator rights. Any user can however inspect these data using the Instrumentation Metadata Editor (see Fig. 9), such as the individual components that make up a radiometric calibration of an ASD instrument.
V. DISCUSSION
The development of SPECCHIO version 3 has been a major effort as the whole architecture has largely been redesigned. The use of the EAV paradigm for the storage of metadata is one of the most eminent changes as it allows for the quick adaptation
HUENIet al.: THE SPECCHIO SPECTRAL INFORMATION SYSTEM 5797
Fig. 8. Example of an automated validation result of an APEX HDRF cube, showing a comparison of spectra with SGCP data showing the target variation as grey envelope (top left), a true-color image of the scene zoomed into SGCP neighborhood with the SGCP indicated in the middle by a red circle (top right), the ratio between APEX and ASD (bottom left), and absolute differences in reflectance (bottom right).
Fig. 9. Instrumentation Metadata Editor showing the digital number spectrum being part of the radiometric calibration coefficients for the 3°FOV fore optic of ASD instrument 18140.
of new metadata attributes within the system. This is in sharp contrast to previous versions where a database model update and software upgrade had been required. New metaparameters are instantly available to the users after being added to the system, the only exception are new binary contents where both the server and client software would need upgrading as the interpretation is done in software.
The paradigm change from spectral database to spectral infor-mation system is reflected in the new software by the EAV based metadata storage but also in the new API, offering many func-tions to select, group, and reinsert data, essentially allowing the building of information from algorithms implemented in higher level programming languages. The support of such languages is one key step toward the use of the SPECCHIO data pool for dynamic applications, e.g., continuous data insert from tower mounted instruments, and to involve more researchers by allow-ing them the use of their development environment of choice. In combination with the new research group functionality, a team
Fig. 10. Histograms of number of metaparameters per spectrum for all cam-paigns and for the APEX SGCP campaign, showing a bimodality with the distribution around a mean of 36 associated with the well-curated APEX SGCP campaign.
of researchers may work on the same data source while writing their algorithms in different programming languages.
One focus of current research is the definition of mandatory and optional metaparameters [23], [32]. The previous version of SPECCHIO supported a preliminary data quality scheme prescribing optional and mandatory metaparameters. This has been dropped in the new version, as it had never been used by any SPECCHIO end user and research by Rasaiah et al.[23] indicates that requirements differ between applications and user groups. Future versions may again include such a feature, which at that point will allow more flexibility due to the underlying EAV based storage supporting the definition of application-specific metadata requirements.
While data quality is obviously very important, there are currently no data quality indicators implemented in the system. Again, there is no technical limitation in doing so, but a missing scientific approach on how to best estimate the quality of a data set, where quality ideally is defined as “fit for purpose.” Thus, in the current version, data are imported “as is” and not assigned any automatic quality flag. A future extension of SPECCHIO in the framework of MetEOC-314 will introduce the storage and propagation of spectroradiometric uncertainties, at which point the notion of data quality will no longer only be qualitative but quantitative.
One measurement of data quality is the metadata space density [40], based on the assumption that more metadata relates to a higher descriptive power of the metadata space, enabling the interpretation of the scientific data [55]. The metadata analysis of the RSL in-house database, as presented in the case study, demonstrates that carefully curated datasets reach a mean of 36 metaparameters per spectrum of a maximum 380 possible entries (see Fig. 10). This statistical analysis also demonstrates that spectral metadata spaces are essentially sparsely populated,
thus confirming our flexible EAV storage choice where only the available metaparameters take up storage space.
It must be noted that augmenting and processing a spectral dataset still requires manual labor, dedication, and attention to the detail, despite streamlined interfaces, group update func-tions, and automated calculation algorithms.
A certain amount of development time has been spent on implementing new file format readers. It is an irksome duty of the maintainers of the code, as almost every new sensor becoming available appears to adopt another flavor of file format. We advocate that these proprietary formats should be dropped in favor of a standardized file format, such as the combination of ISO 19156 standard and Sensor Model Language proposed by Jiménezet al.[32] or the SpectroML standard extended for field spectroscopy data and metadata [56].
VI. CONCLUSION
SPECCHIO version 3 represents a major release of the SPEC-CHIO system, upgrading it to a spectral information system. The key improvements are a flexible metadata storage system that is easily extended to cater for the needs of different sci-ence domains, and a rich API that allows the automation of all SPECCHIO system functions. Scientific end-users can thus integrate direct SPECCHIO database access in their processing algorithms written in a programming language of their choice by using common Java bridging technologies.
Moving to open source opens the opportunity to involve more developers worldwide and further improve the system.
ACKNOWLEDGMENT
This project has greatly benefitted through interactions with EcoSIS, the information technology services at the University of Wollongong, and SpecNet, by work carried out in the framework of the COST Actions OPTIMISE and SENSECO, and by pro-gramming support through student semester projects at FHNW, Switzerland.
REFERENCES
[1] M. E. Schaepman, S. L. Ustin, A. J. Plaza, T. H. Painter, J. Verrelst, and S. Liang, “Earth system science related imaging spectroscopy - An assessment,”Remote Sens. Environ., vol. 113, pp. 123–137, 2009. [2] K. J. Thome, “In-flight intersensor radiometric calibration using vicarious
approaches,” inPost-Launch Calibration of Satellite Sensors, S. A. Morain, Ed. London, U.K.: Taylor Francis, 2004, pp. 95–102.
[3] J. A. Gamon, A. F. Rahman, J. L. Dungan, M. Schildhauer, and K. F. Huemmrich, “Spectral network (SpecNet) - What is it and why do we need it?”Remote Sens. Environ., vol. 103, pp. 227–235, 2006.
[4] A. Porcar-Castellet al., “EUROSPEC: At the interface between remote-sensing and ecosystem CO2 flux measurements in Europe,” Biogeo-sciences, vol. 12, pp. 6103–6124, 2015.
[5] E. J. Milton, “Field spectroscopy,” inGeoinformatics, vol. 1, P. Atkinson, Ed. Oxford, U.K.: EOLSS Publishers/UNESCO, 2009, pp. 209–239. [6] E. J. Milton, N. P. Fox, and M. Schaepman, “Progress in field
spec-troscopy,” inProc. Geosci. Remote Sens. Symp., 2006, pp. 1966–1968. [7] E. J. Milton, M. E. Schaepman, K. Anderson, M. Kneubühler, and N.
Fox, “Progress in field spectroscopy,”Remote Sens. Environ., vol. 113, pp. 92–109, 2009.
[8] A. Hueni, A. Damm, M. Kneubuehler, D. Schläpfer, and M. Schaepman, “Field and airborne spectroscopy cross-validation - some considerations,”
IEEE J. Sel. Topics Appl. Earth Observ. Remote Sens., vol. 10, no. 3, pp. 1117–1135, Mar. 2017.
[9] K. Pfitzner, R. E. Bartolo, B. Ryan, and A. Bollhöfer, “Issues to consider when designing a spectral library database,” inProc. Spatial Intell., Inno-vation Praxis, Nat. Biennial Conf. Spatial Sci. Inst., 2005, pp. 416–425. [10] K. Andersonet al., “Inter-comparison of hemispherical conical reflectance
factors (HCRF) measured with four fibre-based spectrometers,”Opt. Ex-press, vol. 21, pp. 605–617, 2013.
[11] A. Hueni, J. Nieke, J. Schopfer, M. Kneubühler, and K. Itten, “The spectral database SPECCHIO for improved long term usability and data sharing,”
Comput. Geosci., vol. 35, pp. 557–565, 2009.
[12] S. Bojinski, M. Schaepman, D. Schlaepfer, and K. Itten, “SPECCHIO: A Web-accessible database for the administration and storage of heteroge-neous spectral data,”Photogrammetry Remote Sens., vol. 57, pp. 204–211, 2002.
[13] S. Bojinski, M. Schaepman, D. Schlaepfer, and K. Itten, “SPECCHIO: a spectrum database for remote sensing applications,”Comput. Geosci., vol. 29, pp. 27–38, 2003.
[14] L. Floridi, “Is information meaningful data?”Philosophy Phenomenolog-ical Res., vol. 70, pp. 351–370, 2005.
[15] M. Karami, K. Rangzan, and A. Saberi, “Using GIS servers and inter-active maps in spectral data sharing and administration: Case study of Ahvaz Spectral Geodatabase Platform (ASGP),”Comput. Geosci., vol. 60, pp. 23–33, 2013.
[16] L. Pompilio, P. Villa, M. Boschetti, and M. Pepe, “Spectroradiometric field surveys in remote sensing practice: A workflow proposal, from planning to analysis,”IEEE Geosci. Remote Sens. Mag., vol. 1, no. 2, pp. 37–51, Jun. 2013.
[17] S. Arafat, E. Farg, M. Shokr, and G. Al-Kzaz, “Internet-based spectral database for different land covers in Egypt,”Adv. Remote Sens., vol. 2, pp. 85–92, 2013.
[18] S. Irgenfried and J. Hock, Acquisition and Storage of Multispectral Material Signatures–Workflow Design and Implementation. Karlsruhe, Germany: KIT Scientific Publishing, 2015, pp. 123–135.
[19] L. Colini et al., “Mt Etna (Italy) and Sahara desert (Algeria) sites: CAL/VAL activities for hyperspectral data and development of spectral libraries for outcropping surfaces characterization,” inProc. EARSeL SIG Imag. Spectroscopy Workshop Zurich, 2017, pp. 129–130.
[20] EcoSIS Executive Team, “Ecological spectral information system (Eco-SIS).” [Online]. Available: https://ecosis.org, Accessed: 2020.
[21] L. Chisholm and A. Hueni, “The spectroscopy dataset lifecycle: Best practice for exchange and dissemination,” inAusCover Good Practice Guidelines: A Technical Handbook Supporting Calibration and Valida-tion Activities of Remotely Sensed Data Product, A. Held, S. Phinn, M. Soto-Berelov, and S. D. Jones, Eds. Canberra, ACT, Australia: TERN AusCover, 2015, pp. 234–248.
[22] J. Rowley, “The wisdom hierarchy: Representations of the DIKW hierar-chy,”J. Inf. Sci., vol. 33, pp. 163–180, 2007.
[23] B. Rasaiah, S. Jones, C. Bellman, and T. Malthus, “Critical metadata for spectroscopy field campaigns,”Remote Sens., vol. 6, pp. 3662–3680, 2014. [24] B. Rasaiah, S. Jones, C. Bellman, T. Malthus, and A. Hueni, “Assessing field spectroscopy metadata quality,”Remote Sens., vol. 7, 2015, Art. no. 4499.
[25] A. Burkartet al., “A method for uncertainty assessment of passive sun-induced chlorophyll fluorescence retrieval using an infrared reference light,”IEEE Sens. J., vol. 15, no. 8, pp. 4603–4611, Aug. 2015. [26] W. Tang and J. Selwood,Spatial Portals. Gateways to Geographic
Infor-mation. Redlands, CA, USA: ESRI Press, 2005.
[27] B. Vockner, A. Richter, and M. Mittlböck, “From geoportals to geographic knowledge portals,”ISPRS Int. J. Geo-Inf., vol. 2, pp. 256–275, 2013. [28] A. Lewiset al., “The australian geoscience data cube — foundations and
lessons learned,”Remote Sens. Environ., vol. 202, pp. 276–292, 2017. [29] G. Shaw and D. Manolakis, “Signal processing for hyperspectral image
exploitation,” IEEE Signal Process. Mag., vol. 19, no. 1, pp. 12–16, Jan. 2002.
[30] M. E. Schaepmanet al., “The future of imaging spectroscopy – prospective technologies and applications,” inProc. IEEE Int. Geosci. Remote Sens. Symp., 2006, pp. 2005–2008.
[31] A. Hueni, L. Suarez, L. Chisholm, and A. Held, “The use of spectral databases for remote sensing of agricultural crops,” inHyperspectral Remote Sensing of Vegetation: Fundamentals, Sensor Systems, Spectral Libraries, and Data Mining for Vegetation, 2nd ed. vol. 1, P. S. Thenkabail, G. J. Lyon, and A. Huete, Eds. Boca Raton, FL, USA: CRC Press, 2018, p. 449.
[32] M. Jiménez, M. González, A. Amaro, and A. Fernández-Renau, “Field spectroscopy metadata system based on ISO and OGC standards,”ISPRS Int. J. Geo-Inf., vol. 3, pp. 1003–1022, 2014.
HUENIet al.: THE SPECCHIO SPECTRAL INFORMATION SYSTEM 5799
[33] P. Nadkarni, L. Marenco, R. Chen, E. Skoufos, G. Shepherd, and P. Miller, “Organization of heterogeneous scientific data using the EAV/CR representation,”J. Amer. Med. Informat. Assoc., vol. 6, pp. 478–493, 1999. [34] A. Hueni, K. Lenhard, A. Baumgartner, and M. Schaepman, “The APEX (airborne prism experiment - imaging spectrometer) calibration infor-mation system,”IEEE Trans. Geosci. Remote Sens., vol. 51, no. 11, pp. 5169–5180, Nov. 2013.
[35] M. Schaepmanet al., “Advanced radiometry measurements and Earth sci-ence applications with the Airborne Prism Experiment (APEX),”Remote Sens. Environ., vol. 158, pp. 207–219, 2015.
[36] V. Dinu and P. Nadkarni, “Guidelines for the effective use of entity-attribute-value modeling for biomedical databases,”Int. J. Med. Informat., vol. 76, pp. 769–779, 2007.
[37] D. J. Turner, A. K. Smyth, C. M. Walker, and A. J. Lowe, “AEKOS: Next-generation online data and information infrastructure for the ecological science community,” inTerrestrial Ecosystem Research Infrastructures: Challenges and Opportunities, A. Chabbi and H. W. Loescher, Eds. Boca Raton, FL, USA: CRC Press, 2017.
[38] M. Balzaroloet al., “Ground-based optical measurements at European flux sites: A review of methods, instruments and current controversies,”
Sensors, vol. 11, pp. 7954–7981, 2011.
[39] A. Burkart, S. Cogliati, A. Schickling, and U. Rascher, “A novel UAV-based ultra-light weight spectrometer for field spectroscopy,”IEEE Sens. J., vol. 99, 2013.
[40] A. Hueni, T. Malthus, M. Kneubuehler, and M. Schaepman, “Data ex-change between distributed spectral databases,”Comput. Geosci., vol. 37, pp. 861–873, 2011.
[41] D. Landgrebe,On Information Extraction Principles for Hyperspectral Data. West Lafayette, IN, USA: Purdue Univ., 1997.
[42] A. Hueni, J. Nieke, J. Schopfer, M. Kneubühler, and K. Itten, “Metadata of spectral data collections,” inProc. 5th EARSeL Workshop Imag. Spec-troscopy, 2007, p. 14.
[43] A. Hueni, “SPECCHIO source code.” [Online]. Available: https://github. com/SPECCHIODB/SPECCHIO, Accessed: 2020.
[44] C. Ong, T. Malthus, I. C. Lau, M. Thankappan, and G. Byrne, “The devel-opment of a standardised validation approach for surface reflectance data,” inProc. IEEE Int. Geosci. Remote Sens. Symp., 2018, pp. 6456–6459. [45] European Commission DG XI, CORINE land cover, European
Commis-sion Directorate-General Environment, Nuclear Safety and Civil Protec-tion, Office for Official Publications Eur. Communities, Luxembourg city, Luxembourg, 1993.
[46] G. Schaepman-Strub, M. Schaepman, T. H. Painter, S. Dangel, and J. V. Martonchik, “Reflectance quantities in optical remote sensing - definitions and case studies,”Remote Sens. Environ., vol. 103, pp. 27–42, 2006. [47] SPECCHIO, “SPECCHIO API.” [Online]. Available: https://specchio.ch/
javadoc/, Accessed: 2020.
[48] The MathWorks Inc., Natick, MA, USA,Matlab, 2017.
[49] S. Urbanek, “rJava: Low-level R to Java interface,” Jun. 7, 2020. [Online]. Available: http://CRAN.R-project.org/package = rJava
[50] JPype, “JPype documentation.” [Online]. Available: https://jpype. readthedocs.io/en/latest/index.html, Accessed: 2020.
[51] A. Hueni, C. Schibli, R. Rossi, and M. Gwerder, “SPECCHIO spectral information system web interface,” inProc. EARSeL SIG IS Zurich, 2017, pp. 123–124.
[52] A. Hueniet al., “Structure, components and interfaces of the airborne prism experiment (APEX) processing and archiving facility,”IEEE Trans. Geosci. Remote Sens., vol. 47, no. 1, pp. 29–43, Jan. 2009.
[53] A. Hueni and A. Bialek, “Cause, effect and correction of field spectrora-diometer inter-channel radiometric steps,”IEEE J. Sel. Topics Appl. Earth Observ. Remote Sens., vol. 10, no. 4, pp. 1542–1551, Apr. 2017. [54] C. Meiller, H. Kuehle, M. Werfeli, and A. Hueni, “A calibration and
validation tool for data quality analysis of airborne imaging spectroscopy data,” inProc. Int. Geosci. Remote Sens. Symp., 2020, pp. 6234–6237. [55] W. K. Michener, “Metadata,” inEcological Data: Design, Management
and Processing, W. K. Michener and J. W. Brunt, Eds. Oxford, U.K.: Blackwell Sci., 2000, pp. 92–116.
[56] T. Malthus and A. Hueni, “An XML-based format for the exchange of spectroradiometric data,” inProc. EARSeL SIG IS, 2009.