UC San Diego Electronic Theses and Dissertations
Title
Quantifying and Accommodating Heterogeneity in High Throughput Drug Response Studies
Permalink https://escholarship.org/uc/item/6w65k84f Author Ding, Kuan-Fu Publication Date 2017 Peer reviewed|Thesis/dissertation
eScholarship.org Powered by the California Digital Library University of California
Quantifying and Accommodating Heterogeneity in High Throughput Drug Response Studies
A dissertation submitted in partial satisfaction of the requirements for the degree
Doctor of Philosophy
in
Bioinformatics and Systems Biology
by
Kuan-Fu Ding
Committee in charge:
Professor Nicholas J. Schork, Chair Professor Bing Ren, Co-Chair Professor Hannah Carter Professor Terry Gaasterland Professor Olivier Harismendy
film and electronically:
Co-Chair
Chair
University of California, San Diego
2017
To my family and friends
To my parents
To my wife and son
You made this work possible
Thank you for your unwavering support
Statistics is the grammar of science.
— K. Pearson
...the null hypothesis is never proved or established, but is possibly disproved, in the course of experimentation. Every experiment may be said to exist only to give the facts a chance of disproving the null hypothesis.
— R.A. Fisher
No problem can be solved from the same level of consciousness that created it.
— A. Einstein
The whole is greater than the sum of its parts.
— Aristotle
Signature Page . . . iii
Dedication . . . iv
Epigraph . . . v
Table of Contents . . . vi
List of Figures . . . x
List of Tables . . . xvi
Acknowledgements . . . xviii
Vita and Publications . . . xxi
Abstract of the Dissertation . . . xxii
Chapter 1 Preface . . . 1
1.1 Background . . . 1
1.2 Exposing and Accommodating Issues with Heterogeneity in Drug Screens . . . 2
1.2.1 Reproducibility . . . 2
1.2.2 Association Analysis Involving Dose-Response Data 3 1.2.3 Network Rewiring and Target Identification and Modulation . . . 4
1.3 Detailed Descriptions of the Data Sets Used . . . 5
1.4 Synopsis and Discussion . . . 7
Chapter 2 Analysis of Variability in High Throughput Screening Data: Applications to Melanoma Cell Lines and Drug Responses . . 9
2.1 Abstract . . . 9
2.2 Introduction . . . 10
2.3 Results . . . 14
2.3.1 Variation of Cell Viability Data Across Dose and Drug Replicates . . . 14
2.3.2 Variation Between Two Laboratories . . . 15
2.3.3 Comprehensive Analysis Considering the Entire HTS Experimental Setting via ANOVA Modeling 18 2.3.4 Exploring Interaction Effects . . . 21
2.3.5 Re-analysis With Broader Set of Comparator Drugs and Cell Lines . . . 22
2.3.7 Analysis of CCLE and GDSC Data . . . 24
2.4 Discussion . . . 24
2.5 Materials and Methods . . . 28
2.5.1 Data . . . 28
2.5.2 Data Analysis . . . 29
2.6 Acknowledgements . . . 31
2.7 Supplemental Figures . . . 33
Chapter 3 An Additional Example of Quality Control Analyses for Drug Screening and Drug Target Validation Involving Longevity in Model Species . . . 44
3.1 Abstract . . . 44
3.2 Introduction . . . 45
3.3 Materials and Methods . . . 46
3.3.1 Caenorhabditis elegans Data Acquisition and Anal-ysis . . . 46
3.4 Results . . . 48
3.4.1 Caenorhabditis elegans Screening Study . . . 48
3.5 Discussion . . . 52
3.6 Acknowledgements . . . 53
Chapter 4 Nonlinear Mixed Effects Models for Use in High Throughput Drug Screens: Applications to Melanoma Cell Line Analysis . 54 4.1 Abstract . . . 54
4.2 Introduction . . . 55
4.3 Materials and Methods . . . 58
4.3.1 Cell Lines . . . 59
4.3.2 Drug Screening . . . 59
4.3.3 Gene Expression Assays . . . 60
4.3.4 Phosphoproteomic Assays . . . 60
4.3.5 CCLE Data Set . . . 62
4.3.6 Traditional IC50 DRC Analysis . . . 62
4.3.7 NLME-Based Analyses . . . 63
4.3.8 Simulation Based Tests . . . 65
4.4 Results . . . 66
4.4.1 Simulation Based Tests . . . 66
4.4.2 Comparing the Different Methods on the Gene Expression Data . . . 68
4.4.3 Comparing the Different Methods on the RPPA Data . . . 70
4.4.4 Assessing the Omnibus LR NLME Test . . . 70
4.4.6 Analysis of the CCLE data with NLME-Based
Models . . . 74
4.4.7 Including Mutation Status as Random Effect in CCLE Data . . . 74
4.5 Discussion . . . 75
4.6 Acknowledgements . . . 78
4.7 Supplemental Figures and Tables . . . 79
Chapter 5 Network Rewiring in Cancer: Applications to Melanoma Cell Lines and The Cancer Genome Atlas Melanoma Patients . . . 92
5.1 Abstract . . . 92
5.2 Introduction . . . 93
5.3 Materials and Methods . . . 97
5.3.1 Transcriptional Profile on Cell Lines . . . 97
5.3.2 MAPK Pathway Information . . . 98
5.3.3 Unsupervised Network Rewiring Analysis . . . 99
5.3.4 Assessing Statistical Significance . . . 99
5.3.5 A Posteriori Supervised Analyses . . . 100
5.3.6 Exploring Network Architecture . . . 100
5.3.7 Analyses of the CCLE Melanoma Cell Line Ex-pression Data . . . 101
5.3.8 Analyses of the TCGA Melanoma Tumor Gene Expression Data . . . 102
5.3.9 Network Reconstruction Analyses . . . 102
5.4 Results . . . 103
5.4.1 Unsupervised Multivariate Mixture Model Anal-ysis of the Transcriptomes of Melanoma Cell Lines 103 5.4.2 Does Mutation Status Explain the Clustering? . . 104
5.4.3 Degree Centrality Analysis . . . 107
5.4.4 Are the Networks Equivalent for Mutation Status Defined Groups Against Normal Controls? . . . . 108
5.4.5 BRAF V600E+/- Differentially Expressed Genes Analysis with the Melanoma TCGA Tumor Data 112 5.4.6 Network Centrality Tests for the TGen Melanoma Cell Lines . . . 113
5.4.7 Network Centrality Tests for the TCGA Data . . 113
5.4.8 Are Strong Edges Present in Both Mutant and Wild Type Groups? . . . 114
5.4.9 De Novo Network Reconstruction Analysis . . . . 117
5.5 Discussion . . . 117
5.6 Acknowledgements . . . 121
Chapter 6 Conclusion, Limitations and Future Research . . . 143 6.1 Synopsis . . . 143
6.1.1 Reproducibility and Reliability of Drug Screen and Drug Target Data . . . 143 6.1.2 Analysis of Dose Response Data . . . 144 6.1.3 Exploring Evidence for Re-Wiring in Cell-Lines
Used in Drug Screens . . . 144 6.2 Extensions Beyond Current Experimental Designs and
Methodologies . . . 145 6.3 Informing Clinical Trials and Patient Data Analyses . . . 146 6.4 Closing Remarks . . . 149
Bibliography . . . 150
Figure 2.1: Differences in HTS plating schemes. Nine 384-well plates are used for each cell line. Left: TGen/SBP plating scheme. Each plate consists of triplicates of three doses across 120 drugs and 8 DMSOs. Right: Alternate plating scheme with each plate . . 16
Figure 2.2: A. Pairwise scatterplots across nine drugs comparing SBP 3-point screen against same three concentrations from SBP 9-point screen. Colors indicate concentration: 0.1 (green), 1.0 (blue), and 10.0 µM (purple). B. Correlation coefficients from . 17
Figure 2.3: A: Application of flexible linear models, using ANOVA methods, to explore the variation in CV that is explained by site, cell lines, dose, drug, and plates. Sites explained a small proportion of the variation, whereas drugs, dose, and cell lines explained . . . 20
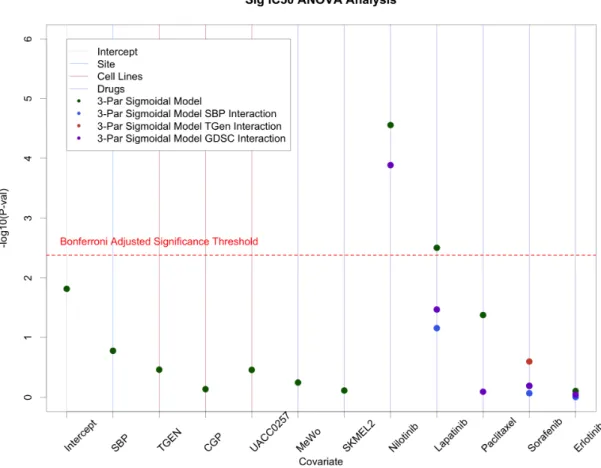
Figure 2.4: ANOVA analysis on IC50 values from SBP, TGen, GDSC, and
CCLE. Site effects were generally minimal; however, site specific effects were observed in Nilotinib. . . 25
Figure 2.5: Pairwise scatterplots across all 128 drugs comparing SBP 3-point screen against same three concentrations from SBP 9-point screen. Colors indicate concentration: 0.1 (green), 1.0 (blue), and 10.0 µM (purple). . . 33
Figure 2.6: Pairwise analysis of mean Cell Viability across 46 drugs exhibit-ing at least one CV less than 20%. Gradient indicates concen-tration from 0.02 µM (light) to 10 µM (dark). . . 34
Figure 2.7: Application of flexible linear models, using ANOVA methods, to explore the variation in CV that is explained by site, cell lines, dose, drug, and plates. Sites explained a small proportion of the variation, whereas drugs, dose, and cell lines explained a 35
Figure 2.8: Assessing the variation in CV that is explained by site, cell lines, dose, drug, and drug-site interaction. To further assess the reproducibility of HTS, we examined the drug-site interaction terms and found that 19 of the significant drugs did not have a 36
of the significant drug-dose interaction terms were from higher concentrations, indicating that a majority of the variation signi- 37
Figure 2.10: Assessing the variation in CV that is explained by site, cell lines, dose, drug, and 3-way interaction terms. Site-by-drug-by-dose effects explained 2.49% of cell viability variance. . . 38
Figure 2.11: Assessing the variation in CV that is explained by site, cell lines, dose, drug, and 3-way interaction terms. Drug-by-dose-by-cell line explained 3.6% of the variance. . . 39
Figure 2.12: Re-assessing the variation in CV that is explained by site, cell lines, dose, and drug when using AIC-defined control drugs. Results were similar from using random baseline drug in terms of proportion of variation explained by sites, cell lines, dose, . . 40
Figure 2.13: Re-assessing the variation in CV that is explained by site, cell lines, dose, drug, and dose-drug interaction when using AIC-defined control drugs. . . 41
Figure 2.14: Re-assessing the variation in CV that is explained by site, cell lines, dose, drug, and site-dose-drug interaction when using AIC-defined control drugs. . . 42
Figure 2.15: Re-assessing the variation in CV that is explained by site, cell lines, dose, drug, and cell line-dose-drug interaction when using AIC-defined control drugs. . . 43
Figure 3.1: Plot of −log10 p-values for each experimental factor against the
observed fraction of C. elegans alive. Vertical bars represent each group of factors analyzed with ANOVA. . . 49
Figure 3.2: Plot of −log10 p-values for each experimental factor, including
column x row interaction terms, against the observed fraction
ofC. elegans alive. Vertical bars represent each group of factors
analyzed with ANOVA. . . 50
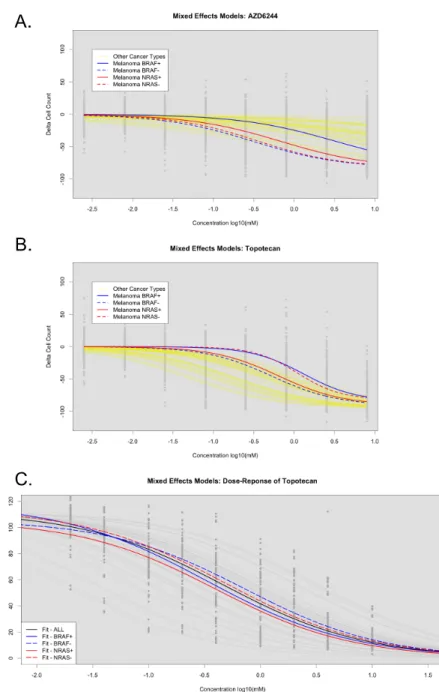
Figure 4.1: (A) Experimental design with melanoma cell lines processed with HTS, whole genome microarray genechip, and RPPA. We performed simulations under the HTS under the null model — no influence from gene expression (GEX) (B) and under the . . 61
sociations between probe set expressions and traditionally called
IC50 or NLME called IC50. (B) −log10p-values for associations 71
Figure 4.3: LLR tests for assessing significant gene expression association in BRAF-related genes. (A) Heatmap of p-values across 15 drugs. (B) Dose response curves fit within KIDINS220 over-expression (Green) and under-expression (Grey). (C) Dose response curves 73
Figure 4.4: LLR tests for assessing significant stratification of cell lines with or without mutations in CCLE and SU2C cell lines. (A) As-sessment of AZD6244 in CCLE across all cell lines (Black), melanoma BRAF+ (Solid Blue), and melanoma BRAF-(Dotted 76
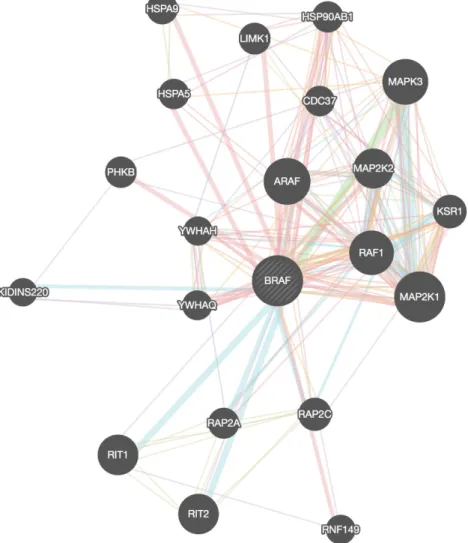
Figure 4.5: GeneMANIA BRAF-related network with K = 20. Key: Pink = Physical interactions; Purple = Co-expression; Orange = Pre-dicted; Light Blue = Pathway; Dark Blue = Co-localization; Green = Genetic interactions; Yellow = Shared protein domain; 79
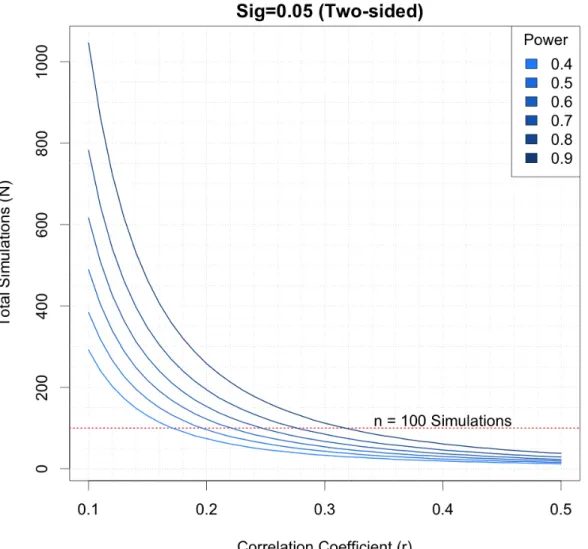
Figure 4.6: Power analysis for simulations. Based on the observed correla-tions from initial parameter simulacorrela-tions (cor >.5), 100 simula-tions should suffice. . . 80
Figure 4.7: Simulation-based power does improve with increased sample size in both the NLME called IC50 associations and in the LLR
associations. Statistical power in traditionally called IC50
asso-ciations tests yielded the worst results. . . 81
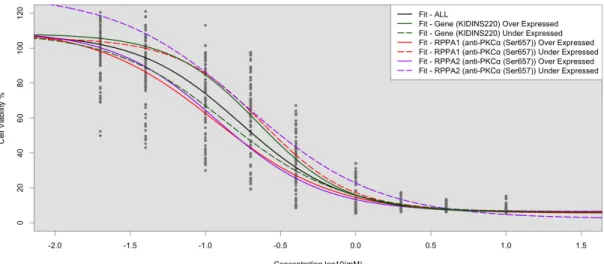
Figure 4.8: Application of LLR tests to identify concordant RPPA (Phospho-PKCα/βII (Thr638)) and Gene expression (KIDINS220) that stratify Dauanorubicin dose response curves. . . 82
Figure 4.9: Application of LLR tests to identify concordant RPPA (anti-PKCα (Ser657)) and Gene expression (KIDINS220) that strat-ify Dauanorubicin dose response curves. . . 83
Figure 4.10: Application of LLR tests to identify concordant RPPA (pBAD) and Gene expression (MAPK3) that stratify Cladribine dose response curves. . . 84
Figure 4.11: GeneMANIA pathway analysis using BRAF and BCL2 showing the network connection of MAPK3 and pBAD. . . 85
sponse curves. . . 86
Figure 4.13: GeneMANIA pathway analysis using BRAF and BCL2 showing the network connection of FOXO1 (FKHR) and KSR1. . . 87
Figure 4.14: Comparing the effects of estimatingIC50values (uM) with NLME
models and those of traditional methods. Although overall cor-relation is observed, there are some clear variations. . . 88
Figure 5.1: (A) Example of network rewiring that could occur. Under ideal conditions, Gene A is co-regulated with Gene D through gene B. When gene B is inhibited, there could be a compensatory mechanism for which gene A communicates with gene D — in . 96
Figure 5.2: Pairwise correlation between MAPK Pathway genes from the identified clusters using flexmix were used to generate heatmaps. Upper right hand half of matrix were correlation coefficients from cluster 1, whereas lower left hand half of matrix were . . . 106
Figure 5.3: Density plots of degree centrality parameters. Figures (A)-(D) are based on analysis of SU2C melanoma cell lines and figures (E)-(H) are based on analysis of CCLE melanoma cell lines. The plots are densities of centrality for (A) and (E), closeness . 109
Figure 5.4: Differential pairwise correlation of (A) BRAF associated genes differentiated by BRAF mutation status and (B) KRAS associ-ated genes differentiassoci-ated by KRAS mutation status. . . 111
Figure 5.5: Network centrality statistics identifying differential central nodes between BRAF+ and BRAF- patients from TCGA data. (A) Degree Centrality, (B) Closeness Centrality, (C) Betweenness Centrality, and (D) Eigenvector Centrality can all be used to . . 115
Figure 5.6: WGCNA derived modules used for a priori assessment of net-work rewiring. (A) Beanplots of overlapping modules between melanoma cell line BRAF+/- (red) and random permutation-based (gray) overlap (B) Beanplots of overlapping modules be- 118
Figure 5.7: Boxplot of normalized gene expression profiles across all melanoma cell lines and skin fibroblast samples. . . 122
Figure 5.9: Density plots for the posterior probability of the flexmix groups in (A) SU2C melanoma cell lines and (B) CCLE melanoma cell lines. These plots reveal that the flexmix called clusters were most distinct in the SU2C melanoma cell lines. . . 126
Figure 5.10: Circular network graph of all common nodes. Top network rep-resents the network derived from correlation associations found in cluster one, whereas the bottom network represents the edges present in cluster two. Density of the edges highlights the dif- . 127
Figure 5.11: Pairwise correlation between MAPK Pathway genes from the identified clusters in TCGA melanoma patients using flexmix were used to generate heatmaps. Upper right hand half of ma-trix were correlation coefficients from cluster 1, whereas lower . 128
Figure 5.12: Pairwise correlation between MAPK Pathway genes from the identified clusters in all CCLE cell lines using flexmix were used to generate heatmaps. Upper right hand half of matrix were correlation coefficients from cluster 1, whereas lower left hand . 129
Figure 5.13: QQ-plots for p-values based on association tests for gene copy number variation observed against the groups discovered in the CCLE dataset, using either the melanoma subset (top) or against all cell lines (bottom). . . 130
Figure 5.14: Observed p-values based on correlation strength tests. Cor-relations were compared between those derived from TCGA melanoma patients with BRAFv600e mutation against those derived from BRAF wt. Blue points represent edges significant 131
Figure 5.15: Density plot of node centrality statistics for flexmix clusters called on TCGA melanoma patients. We use four different de-gree centrality parameters (A) Centrality, (B) Closeness, (C) Betweenness, and (D) Eigenvector Centrality. . . 132
Figure 5.16: Density plot of node centrality statistics for flexmix clusters called across all CCLE cell lines. We use four different de-gree centrality parameters (A) Centrality, (B) Closeness, (C) Betweenness, and (D) Eigenvector Centrality. . . 133
parameters (A) Centrality, (B) Closeness, (C) Betweenness, and (D) Eigenvector Centrality. . . 134
Figure 5.18: Comparing node centrality statistics for KRAS+ and KRAS-from the SU2C cell lines. We use four different degree centrality parameters (A) Centrality, (B) Closeness, (C) Betweenness, and (D) Eigenvector Centrality. . . 135
Figure 5.19: Comparing node centrality statistics for BRAFv600e+ and BRAF-from the TCGA melanoma patients. We use four different de-gree centrality parameters (A) Centrality, (B) Closeness, (C) Betweenness, and (D) Eigenvector Centrality. . . 136
Figure 5.20: Network derived from edges present in TCGA BRAF+ patients. 137
Figure 5.21: Network derived from edges present in TCGA BRAFv600e+ patients. . . 138
Figure 5.22: Network derived from edges present in TCGA BRAF- patients. 139
Figure 5.23: WGCNA derived modules (with k = 20) used fora priori assess-ment of network rewiring. (A) Beanplots of overlapping mod-ules between melanoma cell line BRAF+/- (red) and random permutation-based (gray) overlap (B) Beanplots of overlapping 140
Figure 5.24: Density plots of the observed pairwise correlation coefficients when comparing the BRAF+/- subgroup using the BRAF-associated gene network and the KRAS+/- subgroup using the KRAS-associated gene network. . . 141
Figure 5.25: GeneMANIA circular view of all genes in Supplemental Table 2, i.e., genes with strong interactions identified via co-expression analysis. . . 142
Figure 6.1: Flowchart of clinical trial study pursued through SU2C. The overarching goal is to incorporate algorithms developed through analysis of in vitro and other organisms. . . 148
Table 2.1: Key: CLs = Cell Lines; MCLs = Melanoma Cell Lines; OCLs = Other Cell Lines; CCLs = Melanoma cell lines in common with the SBP nine-point data set; Common drugs = drugs in common with the SBP nine-point data set; SBPMDI = Sanford . . . 15
Table 2.2: Percentage of variance explained by the experimental factors. . . 19
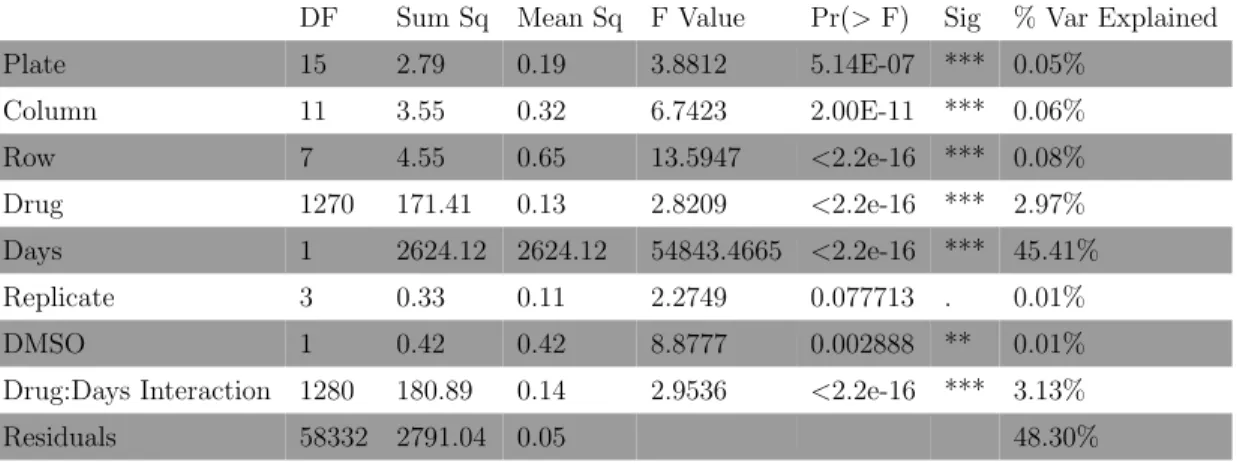
Table 3.1: Assessing the proportion of variation in experimental data ex-plained by each of the experimental factors, including column x
row interaction terms. Significance codes for F statistics: p-val
< .05 (’*’), p-val <.01 (’**’), p-val< .001 (’***’) . . . 49
Table 3.2: Assessing the proportion of variation in experimental data ex-plained by each of the experimental factors, drugs, and days (including drug x day interaction terms). Significance codes for F statistics: p-val < .05 (’*’), p-val <.01 (’**’), p-val< .001 . . 51
Table 3.3: Assessing the proportion of variation in experimental data ex-plained by each of the experimental factors, pharmacological classes, and days (including pharmacological class x day interac-tion terms). Significance codes for F statistics: p-val <.05 . . . 52
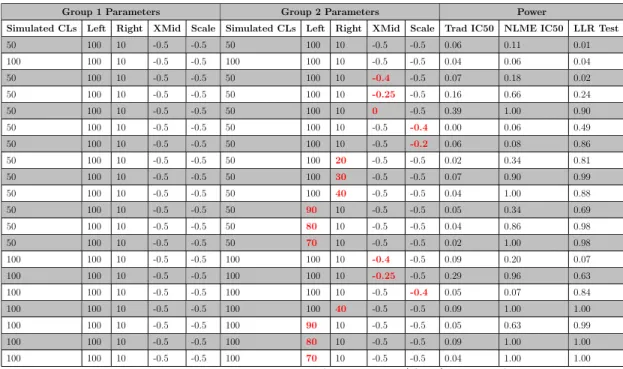
Table 4.1: The Mean and SD of power observed when a single parameter is fixed between two groups and all other parameters are varied in one of the groups (see Methods section). . . 67
Table 4.2: Simulation-based power to detect differences between DRCs be-tween two groups assuming different features about the groups DRCs. . . 69
Table 4.3: Table of cell lines available in the SU2C study. HTS repre-sents availability of high throughput drug screen, GEX reprerepre-sents availability of whole genome microarray genechips, and RPPA sets 1 and 2 represent the availability of Reverse Phase Protein . 89
Table 4.4: Total number of significant associations based on Traditionally called IC50 and NLME called IC50 vales. . . 90
genes. . . 91
Table 5.1: Comparing a priori called clusters within SU2C melanoma cell lines (MCL), CCLE MCL, CCLE all cell lines (ACL), and TCGA melanoma patients. Performed mean vector and covariance equal-ity tests within groups and used log-likelihood ratio permutation 105
Table 5.2: Table of association test results between a priori called clusters and common factors in melanoma. We test against available mutation status TCGA melanoma patients, SU2C melanoma cell lines, and CCLE melanoma cell lines. . . 107
Table 5.3: Network node centrality statistics identified central nodes for each parameter. Consensus-based approach was used to genes to match to DGIdb to identify candidate therapeutic agents. . . 108
Table 5.4: Table of correlation equality tests for the genes in the specified networks. Tests are between mutant and wild type samples. Asterisks represent at least one significant test within comparison (Stieger or Jennrich). . . 112
Table 5.5: Assessing significant nodes by degree centrality parameters. A consensus-based approach was used to genes to match to DGIdb to identify candidate therapeutic agents. . . 114
Table 5.6: A comparison between degree centrality parameters through cor-relations. DC = Degree Centrality, BW = Betweenness, CL = Closeness, EC = Eigenvector Centrality. . . 116
Table 5.7: Correlation equality tests between WGCNA defined modules in BRAF+/- SU2C cell lines, BRAF+/- TCGA melanoma patients, and BRAFv600e+/- TCGA melanoma patients. . . 119
Table 5.8: List of skin fibroblast samples obtained from GEO. Sample repos-itory, sample name, and associated meta data is provided. . . 123
Table 5.9: Identifying edges within BRAS-associated gene networks and KRAS-associated gene networks using co-expression observed within each subgroup. Edges reported had a correlation coef-ficient less than -.7 or greater than .7. . . 124
First and foremost, I must thank my advisor, Dr. Nicholas Schork. His guidance and tutelage have enabled me to become the researcher that I am. His unparalleled multi-disciplinary knowledge and unbelievable ability to distill any complex matter into a coherent thought never cease to amaze me. Yet, what I am most grateful for is his patience, kindness, thoughtfulness, and unceasing desire to impart knowledge. I cannot thank him enough for his support throughout my academic studies.
Thank you to the Schork lab for helping me work through my challenges, letting me rant and joining me in this adventure. As a team, I believe that we have made a lasting impact.
I owe a great deal of gratitude towards Professors Jeffrey M. Trent and Patricia LoRusso for allowing me to analyze data from your studies. Thank you Translational Genomics Research Institute and Sanford Burnham Prebys Medical Discovery Institute for your dedication to research. Thank you to Richard Miller and the Longevity Consortium for including me and Professor Schork’s team in the analysis of your data. Without your resources and data, my work would not have been possible.
My introduction to bioinformatics is in great part due to Timothy Gal-lagher, Professor Jae K. Lee, and Professor Dan Theoderescu. Thanks for allowing me the opportunity to learn from you. Professor Lee, I cannot thank you enough for your support, for showing me how powerful statistics can be, and for revealing to me the potential impact mathematics and computational approaches have in healthcare. Tim, thank you for your leadership and exceptional vision. Dan, your devotion and zeal towards learning in medicine are inspiring. Thank you three for being patterns of excellence.
Thank you Professor Brett Blackman, Professor Brian Wamhoff, and James Powers for allowing me to work with you and contribute to your company. Thank you for showing me the impact of biomedical sciences in the healthcare and phar-maceutical industries. I am amazed by your work and fully expect continued success. May you continue to revolutionize the way the pharmaceutical industry
Hannah Carter, Terry Gaasterland, and Olivier Harismendy. Thank you for your incredible support and attentiveness to the details in my research. I am very grateful to each one of you — especially due to the multi-disciplinary nature of my research. Without your expertise, the results of my research would have been much harder to achieve. Special thanks to Professors Ren and Gaasterland for your invaluable advice. I truly appreciate your guidance throughout my academic career and even in discussion regarding the next steps in my career.
To my parents, Zan and Phoebe, thank you for your love and care. Thank you for always encouraging me to pursue my interests, no matter how challenging they seemed. Your support has been unwavering and necessary. To my sisters, Jan and Yen, thank you for constant laughter and silliness. To my mother-in-law and sister-in-law, thank you for being great cheerleaders and for all that you are to our family.
To my wife and son: you are my love, happiness, and joy. I do what I do for you and I am inspired to make a difference because of you.
Thank you to all who have prayed for me — your prayers have sustained me on this journey. Praise God for His mercy and grace that have brought me to this day. To Him be the glory forever and ever. Amen.
Chapter 2 is a full reprint of the publication: Ding, K., Finlay, D., Yin, H., Hendricks, W.P.D., Sereduk, C., Kiefer, J., Sekulic, A., LoRusso, P.M., Vuori, K., Trent, J.M., and Schork, N.J. Analysis of Variability in High Throughput Screening Data: Applications to Melanoma Cell Lines and Drug Responses. Oncotarget. 2017; 8:27786-27799, with permission from all coauthors. The dissertation author was the primary researcher and author of this material.
Chapter 4 is a full reprint of the publication: Ding, K., Petricoin, E.F., Fin-lay, D., Yin, H., Hendricks, W.P.D., Sereduk, C., Kiefer, J., Sekulic, A., LoRusso, P.M., Vuori, K., Trent, J.M., and Schork, N.J. Applications of Nonlinear Mixed Effects Models for High Throughput Drug Screen Association Tests. (In Prepara-tion), with permission from all coauthors. The dissertation author was the primary
H., Hendricks, W.P.D., Sereduk, C., Kiefer, J., Sekulic, A., LoRusso, P.M., Vuori, K., Trent, J.M., and Schork, N.J. Network Rewiring in Cancer: Applications to Melanoma Cell Lines and the Cancer Genome Atlas Melanoma Patients. (In Preparation), with permission from all coauthors. The dissertation author was the primary researcher and author of this material.
2016-Present Senior Data Scientist, Intrexon
2017 Ph.D. in Bioinformatics and Systems Biology, University of California, San Diego
2009-2012 Bioinformatics Specialist, HemoShear
2011 M.S. in Statistics, University of Virginia
2008-2010 Biostatistics Manager, Key Genomics
2008 B.S. in Mathematics, University of Texas at Austin
PUBLICATIONS
Jamison McCorrison*, Kuan-Fu Ding*, Andrew Pickering, Dan Evans, Trina Norton, Pui Kwok, Ludmila Pawlikowska, Richard Miller, and Nicholas J. Schork. Multi-Reference Transcriptomic Analysis of Bird Species: Interpreting Reference-specific Signatures of Longevity. (In Preparation) *McCorrison and Ding con-tributed equally to the work.
Kuan-Fu Ding, Emanuel F. Petricoin, Darren Finlay, Hongwei Yin, William P.D. Hendricks, Chris Sereduk, Jeffrey Kiefer, Aleksandar Sekulic, Patricia M LoRusso, Kristiina Vuori, Jeffrey M. Trent, and Nicholas J. Schork. Applications of Nonlinear Mixed Effects Models for High Throughput Drug Screen Association Tests. (In Preparation)
Kuan-Fu Ding, Hongwei Yin, William P.D. Hendricks, Chris Sereduk, Jeffrey Kiefer, Aleksandar Sekulic, Patricia M LoRusso, Jeffrey M. Trent, and Nicholas J. Schork. Network Rewiring in Cancer: Applications to Melanoma Cell Lines and the Cancer Genome Atlas Melanoma Patients. (In Preparation)
Kuan-Fu Ding, Darren Finlay, Hongwei Yin, William P.D. Hendricks, Chris Sereduk, Jeffrey Kiefer, Aleksandar Sekulic, Patricia M LoRusso, Kristiina Vuori, Jeffrey M. Trent, and Nicholas J. Schork. Analysis of Variability in High Through-put Screening Data: Applications to Melanoma Cell Lines and Drug Responses.
Oncotarget, Volume 8, February 2017, Pages 27786-27799.
Smith, Steven, Alexander Baras, Garrett Dancik, Yuanbin Ru, Kuan-Fu Ding, Christopher Moskaluk, Yves Fradet, Jan Lehmann, Michael Stickle, Arndt Hart-mann, Jae Lee, and Dan Theodorescu. A 20-Gene Model for Molecular Nodal Staging of Bladder Cancer: Development and Prospective Assessment. The Lancet
Oncology, Volume 12, No 2, January 2011, Pages 137-143.
Quantifying and Accommodating Heterogeneity in High Throughput Drug Response Studies
by
Kuan-Fu Ding
Doctor of Philosophy in Bioinformatics and Systems Biology
University of California, San Diego, 2017
Professor Nicholas J. Schork, Chair Professor Bing Ren, Co-Chair
Over the past decade, there has been steady increase of studies leveraging genomic and related molecular profiling technologies to identify drug targets and characterize drug effects for particular diseases. This is particularly true for cancer, in which researchers can potentially identify genetic and other factors in tumors to indicate appropriate treatments. Many relevant studies have leveraged high throughput drug screen (HTS) strategies using, e.g., cancer cell lines that have been profiled at the genetic and other levels. These strategies allow researchers to assess the effects of many different drugs and compounds on cell lines exhibiting wide variation in their genomic profiles, so that associations can be identified that
problems such as false positives or a loss of statistical power must be addressed. These problems fall into three general categories: (i) the reliability of the screening data and the procedures used to generate the data; (ii) the statistical analysis methods used to identify associations between drug responses and other factors collected on the cells used in the screening; and (iii) the differences between the cell lines used in terms of their genetic architectures. I have taken a data-driven approach to address each of these concerns.
First, I assessed the reliability and reproducibility of HTS data leveraging two different collaborations. One set of analyses involved melanoma cancer cell lines subjected to two independent laboratory drug screens. I ultimately assessed the proportion of variation that could be explained by laboratory and technical effects associated with the design of the experiments and found that when sources of variation are quantified and controlled for, signals beyond “noise” can be detected that reflect true drug response. A second set of analyses involved HTS to identify drugs that influence lifespan in Caenorhabditis elegans. As with the study of the melanoma cell lines, I examined the variability in the screening outcome data that could be attributed to plate and plate-specific effects.
Second, I considered different ways of statistically analyzing dose-response data arising from HTS experiments. I ultimately evaluated the performance of nonlinear mixed effects (NLME) models relative to traditional models based on an analysis of IC50 values derived from individual cell line drug response
pro-files. Through simulation studies as well as applications to actual data, I found that testing for differences in dose-response curves using the NLME models has greater statistical power to detect gene associations with drug responses than tests involving traditional IC50-based values.
Third, I assessed differences in genetic co-expression among cell lines used in drug screening studies. Such differences can dramatically affect identification of gene/drug relationships. I find evidence for differences in the way genes are related to each other between cell lines used in screening experiments and show
on choosing the right treatment for an individual based on his or her genetic and related profile in the future — as this is the goal of “personalized,” “individualized” and “precision” medicine — I believe my analyses and approaches will motivate future studies and lead to more reliable drug screening strategies and results.
Preface
1.1
Background
There is tremendous interest in using genomic and related molecular profil-ing technologies with cell lines and other cellular systems to identify drug targets and to characterize drug effects in pharmaceutical studies [Lamb et al., 2006]. This is because genes, proteins, metabolites, and other molecular entities can be evalu-ated as drug targets using a number of strategies involving cell lines [Krogan et al., 2015]. In addition, the impact of specific drugs on those molecular entities can be studied in a high throughput fashion using state-of-the-field infrastructure, making it possible to efficiently screen thousands of experimental compounds and drugs. Such studies can provide insights into the molecular mechanisms associated with disease; the molecular and physiologic processes that are modulated via pharma-cologic manipulation; and the factors that may mitigate response to a drug and ultimately shed light on how the research community might specifically target or “personalize” medicines [Barretina et al., 2012] [Yang et al., 2013]. But, there are a number of complications associated with conducting and interpreting the results of cell line-based drug targeting and screening studies. Though numerous, these problems are generally associated with sources of variation and heterogeneity, and fall into three broad categories: (i) the reliability and reproducibility of the data generated by screening studies given the large number of potential sources of both technical and biological variation inherent to their execution; (ii) the manner in
which claims about relationships among targets, drugs and modifying factors are drawn via statistical methods, especially in light of the substantial heterogeneity exhibited by individual cell lines at the genetic and molecular physiologic levels; and (iii) whether or not the molecular systems to be interrogated exhibit variation across cell lines so extreme that the study of any particular set of cell lines pre-cludes easy generalization. The following expands on these issues as well as the need for strategies that might be used to assess and overcome them.
1.2
Exposing and Accommodating Issues with
Heterogeneity in Drug Screens
As noted, drug screening studies require a great sensitivity to the inherent heterogeneity across cell lines used and the different sources of technical variation that complicate inferences from data analyses of those cell lines and their drug responses. The specific sources of heterogeneity and how they complicate relevant data analyses have been discussed in the literature to some degree, which we review in the following.
1.2.1
Reproducibility
The reliability and reproducibility of cell line-based drug target identifica-tion and screening initiatives have become a significant contemporary concern [The CCLE and The GDSC Consortiums, 2015] [Haibe-Kains et al., 2013] [Safikhani et al., 2016a]. The massive amount of data generated in drug screening experi-ments raises questions about not only the reliability of the data, but also the rate of potential false positive results if important variation sources are not accounted for. For example, there is a need to quantify and control for purely experimental sources of variation (e.g., different plating schemes, assays done in different labo-ratories, different drug dosages, etc.). To address this, I studied various sources of technical and biological variability in high throughput drug screen (HTS) data generated by Sanford Burnham Prebys Medical Discovery Institute (SBP) and
Translational Genomics Research Institute (TGen) as part of a project sponsored by the Stand-Up-To-Cancer (SU2C) Melanoma Dream Team [Ding et al., 2017]. I also assessed variation sources in publicly available databases, such as the Cancer Cell Line Encyclopedia (CCLE) [Barretina et al., 2012] and Genomics of Drug Sensitivity in Cancer (GDSC) [Yang et al., 2013]. Lastly, I considered experimen-tal sources of variation (e.g., plate position, drug dosage, drug class, etc.) in an independent organism-specific large-scale studies. In this study, I assessed varia-tion sources in a HTS screen of drugs meant to modulate Caenorhabditis elegans
life-span [Ye et al., 2014].
1.2.2
Association Analysis Involving Dose-Response Data
Current strategies for identifying factors that influence drug response us-ing cell lines rely on analytical approaches that may not be optimal for detectus-ing, e.g., gene/drug relationships. Previous attempts in community-driven drug discov-ery challenges have demonstrated the utility of HTS studies but raised questions about the approaches to analyzing the generated data [Bansal et al., 2014]. Typi-cal analysis methods rely heavily on extracting single parameters meant to capture dose-response relationships, like theIC50 value, that may generate issues forasso-ciating those parameters with covariates and variation in drug response patterns. Comparing existing methodologies with novel methodologies could shed light on how to reliably and powerfully identify factors influencing drug response. I applied both traditional and novel approaches, such as nonlinear mixed effects (NLME) models, for relating covariates to drug response in an effort to identify factors that mitigate drug response using the aforementioned SU2C, CCLE and GDSC data sets. Based on the SU2C cell lines, I also performed simulation studies to investi-gate the utility of NLME models relative to traditional analysis models, in terms of their level-accuracy (sensitivity) and power (specificity) to detect the modifying influence of factors on drug response. NLME model-based methods advantageously balance the use of individual curves with group averaging, but are also more com-putationally demanding than traditional analysis models. These simulations show that NLME models accommodate statistical noise and are more powerful than
the standard models that only exploit, e.g., IC50 values obtained from individual
dose-response curves.
1.2.3
Network Rewiring and Target Identification and
Mod-ulation
The manner in which genes, proteins and metabolites interact and function as a whole in normal as opposed to disease states is likely to be very different for obvious reasons. However, many drug target identification and target modu-lation studies focus on the behavior of a drug or modifiable target in wild-type, normal, or available and conveniently obtained cell lines. If differences of gene in-teractions between normal and disease states are pronounced, then generalization of drug activity assessed in normal cells to cells representing the disease state is compromised. I explored differences among cell lines in terms of connections and correlations among genes to characterize how much “re-wiring” among transcrip-tional networks might exist between cell lines in normal and diseased states.
In my analysis, I incorporated both “supervised” and “unsupervised” meth-ods of machine learning to identify evidence of rewiring. “Supervised” approaches such as Evaluation of Dependency DifferentialitY (EDDY) [Jung and Kim, 2014]; Gene Set Enrichment Analysis (GSEA) [Subramanian et al., 2005] [Mootha et al., 2003]; and Gene Set Co-expression Analysis (GSCA) [Choi and Kendziorski, 2009] are limited to the settings in which the grouping of the cell lines is set in advance and hence requires prior knowledge of, e.g., disease and normal conditions. Ulti-mately, “supervised” methods require that each sample be identified as represent-ing a disease or normal state. GSEA further assumes that each set of potentially differentially expressed genes is independent and the probability of observing a set of genes differentially expressed between conditions is equal. Similarly, GSCA depends on identifying differences in the correlations between genes in previously determined disease and normal states. Finally, although EDDY does aim to iden-tify differential networks among groups of cell lines by incorporating probability distributions defining dependency networks across many genes, it still requires the prior specification of disease and normal conditions. “Unsupervised” methods do
not require, e.g., disease and normal states to be specified in advance but generate results that might be difficult to interpret or reconcile with the results of other “unsupervised” methods. This is because they must search for groups in a data set in addition to characterizing the differences between those groups. In addition, although there are plenty of unsupervised methods used almost routinely in many data analysis setting, most, if not all, of these methods only rely on exploring differences in the means or mean vectors of the factors (e.g., gene expression val-ues, protein abundances, etc.) among groups. Moreover, they do not consider the correlations, connections or relationships — i.e., the “wiring” — of those factors by exploring differences in, e.g., covariance matrices that reflect the connections among the factors between identified groups. We assess evidence for network re-wiring using both “supervised” approaches as well as “unsupervised” methods in drug screen data and consider the implications such rewiring might have for making claims about cell line responses to drugs.
1.3
Detailed Descriptions of the Data Sets Used
The data sets briefly mentioned in the previous section contain many nu-ances that were important in my analyses. I was able to collaborate with inves-tigators from various institutions to obtain complex proprietary data sets as well as leverage public databases and resources that are also quite complex. In fact, these complexities motivated many aspects of the quality control (QC) analyses I pursued. The data sets I used to conduct my analyses are described in some detail below.
1. SU2C data: The SU2C Melanoma Dream Team high throughput drug screen data [Ding et al., 2017] was generated at the SBP in La Jolla, California and TGen in Phoenix, Arizona. This data includes information about the experi-mental factors and technical constructs used in executing the screens (e.g., plate, laboratory, drug, dosage, etc.), which allows for the quantification and accommo-dation of sources of variation in drug response attributable to these factors in the
HTS experiments. In addition to this information, I obtained information about different sources of biological variation that could impact the drug responses in the screen. This included: Reverse Phase Protein Array (RPPA) protein abundance, microarray whole genome gene expression, and melanoma-related cell line muta-tional status information for each cell line used in the screens. The SU2C cell line data was also used to define parameters for simulating HTS. We used these sim-ulations to assess different methods for identifying drug x gene interactions (e.g., by defining drug sensitivity and resistance with NLME models and subsequently associating response with mutation status, gene expression and protein abundance information). Lastly, this data set was also used to assess evidence of network rewiring.
2. CCLE and GDSC data: The CCLE [Barretina et al., 2012] and GDSC [Yang et al., 2013] data sets are publicly available HTS dose-response curve data sets that I used to perform an assessment of the sources of variation influencing drug response. The CCLE and GDSC data analyses I performed are complemen-tary to my analysis of the SU2C data [Ding et al., 2017]. Since the CCLE and GDSC HTS do not use the same drug concentration ranges, I assessed sources of variation in the context of previously determined and publicly availableIC50values
for each cell line and drug studied. I was able to obtain dose concentrations and cell viability for each dose and drug administered in the CCLE data, but only had access to the IC50 values for the GDSC data set. Additionally, plate information
was not available for these studies and could not be included in my comparative analyses.
3. Caenorhabditis elegans life span data from Michael Petrascheck: This
data set was used to assess technical and experimental variation sources (e.g., plate position, drug dosage, drug class, etc.) contributing to 1280 drugs screened for their ability to modulateC. elegans life span. I assessed the variability of the screening data in the context of plate effects (including specific row and column of plates), date, and the laboratory performing the HTS experiments.
4. The Cancer Genome Atlas (TCGA) [Cancer Genome Atlas Network, 2015]: This is a very large, scientific community organized data set with thousands of patient tumors all having some kind of genome profiling done on them, such as gene expression pattern characterization. I used the gene expression data to find evidence of network rewiring in melanoma patients using both “supervised” and “unsupervised” data analysis methods that consider (i) differences across groups of tumors that are reflected in mean gene expression differences, and (ii) differences in their correlations as reflected in covariance matrices. I obtained Melanoma TCGA patient RNA-sequencing samples from the TCGA BROAD GDAC Firehose.
1.4
Synopsis and Discussion
Each of the analyses I pursued was designed to address a specific ques-tion related to cell line-based drug assessment studies, but could be extended in a number of ways. For example, as there are a number of published methodolo-gies designed to relate particular pharmacologic manipulations and drug screens to factors measured on cell lines and the cell lines’ responsiveness [Costello et al., 2014], a comparison of those methodolgies would be ideal. My approach was to (i) address issues plaguing HTS and drug target identification studies that have received attention in literature and (ii) expose areas of additional immediate and future research. This is highly appropriate for three reasons: (i) as genomic and related profiling technologies become more efficient and cost-effective, they will be used to identify potential drug targets and assess drug response in unprecedented ways; (ii) the use of standard cell lines, such as available immortalized cell lines, will likely be replaced with more sophisticated cellular constructs, such as fresh cells, induced pluripotent stem cells, and organoids with similar problems as those in traditional cell lines; and (iii) it is becoming increasingly clear that many fac-tors mitigate drug response clinically as it is well-known that most commonly used drugs only help a fraction of users. Identifying those factors in cellular models could motivate the development of assays, companion diagnostic, and prognostic
markers that could ultimately lead to “personalized medicines” [Johnson and Gal-lagher, 2010] [Lupski et al., 2010] [Bainbridge et al., 2011]. These three reasons for pursuing my studies also support the importance of anticipating future analytical needs for HTS studies, since they will undoubtedly involve the combination of (i) better and cheaper data generation technologies; (ii) a desire to understand drug activity as a function of the potentially unique and nuanced profiles of individu-als and their cells; and (iii) more biologically relevant and sophisticated cellular systems. Thus, I believe our analyses and approaches will motivate future studies and lead to more reliable drug screening strategies and results.
Analysis of Variability in High
Throughput Screening Data:
Applications to Melanoma Cell
Lines and Drug Responses
2.1
Abstract
High-throughput screening (HTS) strategies and protocols have undergone significant development in the last decade. It is now possible to screen hundreds of thousands of compounds, each exploring multiple biological phenotypes and pa-rameters, against various cell lines or model systems in a single setting. However, given the vast amount of data such studies generate, the fact that they use multi-ple reagents, and are often technician-intensive, questions have been raised about the variability, reliability and reproducibility of HTS results. Assessments of the impact of the multiple factors in HTS studies could arguably lead to more com-pelling insights into the robustness of the results of a particular screen, as well as the overall quality of the study. We leveraged classical, yet highly flexible, analysis of variance (ANOVA)-based linear models to explore how different factors con-tribute to the variation observed in a screening study of four different melanoma
cell lines and 120 drugs over nine dosages studied in two independent academic laboratories. We find that factors such as plate effects, appropriate dosing ranges, and to a lesser extent, the laboratory performing the screen, are significant predic-tors of variation in drug responses across the cell lines. Further, we show that when sources of variation are quantified and controlled for, they contextualize claims of inconsistencies and reveal the overall quality of the HTS studies performed at each participating laboratory. In the context of the broader screening study, we show that our analysis can also elucidate the robust effects of drugs, even those within specific cell lines.
2.2
Introduction
High-throughput screening (HTS) strategies allow researchers to assess the effects of thousands of compounds on drug responses in one large experimental set-ting. Over the past decade, applications of HTS for drug discovery and drug effect characterization studies have steadily increased, ranging from studies focusing on the assessment of multiple phenotypic endpoints in high-content screening [Taylor, 2010], the evaluation of drugs on traits such as lifespan through the sophisticated use of model species such as Caenorhabditis elegans [Ye et al., 2014], as well as drug response pattern identification using massive amounts of genomic informa-tion made available for crowd-sourcing efforts and community driven challenges [Eduati et al., 2015]. HTS studies have also been pursued to advance personal-ized medicine, especially in oncology settings, since tumor-derived cell lines can be used in the screening studies to identify compounds that are active against them or some subset of them. For example, large HTS databases — such as the NCI-60 [Shoemaker, 2006], the Cancer Cell Line Encyclopedia [Barretina et al., 2012] (CCLE) and the Genomics of Drug Sensitivity in Cancer [Yang et al., 2013] (GDSC) have been made available to researchers for the express purpose of un-covering drugs that exhibit unique effects against tumor-generated cell lines with specific genomic profiles. In addition, very recent work involving the Connectivity Map [Lamb et al., 2006] has exploited genetic network and pathway reconstruction
methods to identify sets of genes that mediate specific drug responses in subsets of cancers. In this light, the Cancer Cell Map Initiative [Krogan et al., 2015] (CCMI) and related initiatives have not only drastically reduced drug discovery costs, but have also guided efforts to identify genomically-informed, patient-specific cancer treatment strategies. Unfortunately, as timely and as sophisticated as these ef-forts have been, very recent studies comparing the quality of different HTS studies meant to advance insights into personalized cancer care have raised questions and concerns about their reliability and reproducibility as well as the interpretation of the data they generated [Haibe-Kains et al., 2013] [The CCLE and The GDSC Consortiums, 2015].
Assessing the reliability of HTS studies is not trivial given the number of compounds typically considered, the number of reagents used, the way in which constructs such as plating schemes and distributed robotic handlers are set up, the manner in which dose response curves are constructed, and the fact that differ-ent labs likely follow slightly, if not overtly, differdiffer-ent protocols; i.e., the sources of HTS cells, tissues or organisms, cell culture and assay conditions, reagents, con-sumables and instrumentation are not standardized within the community. This is particularly true for, e.g., tumor-derived cell line-based screening studies where the nature of the source cell lines, their procurement and sustenance as well as the responses measured on them may vary widely between different laboratories. In addition, although diverse in execution, many cancer-oriented HTS studies focus on cell counts upon stimulation with a drug that reflect that drug’s ability to kill cells derived from a specific cell lines across differing drug concentrations. These concentrations often range from inducing no response (i.e., no cells are killed) to a very strong response (e.g., all the cells are killed). The dose ranges necessary to achieve variation in the number of cells killed and establish a dose response curve are very hard to anticipate often leading to different labs using different concentrations and numbers of concentrations.
After having established the drug concentrations or doses to be used and applying them to cells derived from a single cancer cell line, sigmoidal curves are often fit to the cell counts associated with each drug dose to generate drug-specific
dose response curves (DRCs). This is repeated for each cell line. The half minimal inhibitory concentration (IC50) is then extracted from these curves [Shoemaker,
2006] [Barretina et al., 2012]. These IC50 values, which are often couple with
related response measures such as the area under each dose response curve (AUC), are then used to determine the sensitivity or resistance of each cell line to the different drugs. Recently, the IC50 and AUC results from two large cancer cell
line HTS studies, the Cancer Cell Line Encyclopedia (CCLE) and the Genomics of Drug Sensitivity in Cancer (GDSC) studies, were used to assess the variability of HTS assays pursued in this manner [Barretina et al., 2012] [The CCLE and The GDSC Consortiums, 2015] [Yang et al., 2013]. The results of an assessment of the comparability and reproducibility of CCLE and GDSC data sets by two different research teams yielded opposing interpretations, which underscores the complexity of HTS studies and their interpreration [Haibe-Kains et al., 2013] [The CCLE and The GDSC Consortiums, 2015] [Safikhani et al., 2016b]. A third research team recently reevaluated the CCLE and GDSC data and came to yet a different a conclusion [Haverty et al., 2016].
In order to assess the reliability of HTS data, we conducted a study of intra-and inter-site experimental variability across melanoma cell lines treated with 120 different drugs that are either in use in clinical trials or have been FDA-approved for use in treating cancers. Our study was motivated by not only the controversies surrounding the reliability of the CCLE and GDSC data sets, but also by our engagement in a large clinical trial exploring the utility of personalized treatment for late-stage BRAF wild-type melanoma [LoRusso et al., 2015]. We first measured variability across replicated dose and drug applications to 29 melanoma cell lines pursued within a single institution, the Sanford Burnham Prebys (SBP) Medical Discovery Institute in La Jolla, California. The SBP studies were pursued using two independent HTS formats and screens: a nine-concentration and a three-concentration dose-response screens. Using the same 120 drugs and four of the 29 cell lines, we performed an independent nine-concentration dose response screen at the Translational Genomics Research Institute (TGen) in Phoenix, Arizona. To enable analysis of inter-site experimental variability, two copies of the master drug
plates were generated at SBP. One was then ultimately used onsite at SBP and the other was provided to TGen for their respective screens. Furthermore, the two sites used the same final dosing concentrations and the same cell lines. All other aspects of the screen were independent, resulting in variation in the environments in the which the screens were pursued, personnel, compound freeze/thaw cycles, cell passages, culture conditions, plating density, actual plates and other consumables, and instrumentation.
To analyze the data produced from the two nine-concentration HTS stud-ies, and to assess the variability of the results, we used flexible linear models and analysis of variance (ANOVA) techniques. These traditional techniques allowed us to examine how variation in drug responses (i.e., variation in the fraction of cells killed for a particular cell line, drug and dose) is impacted by different factors, such as the laboratory, the drug used, the plate on which specific assays were conducted. We also considered interaction terms in the relevant (e.g., dose x drug interactions). We chose not to generate dose-response curves and extract IC50 values for use in
our analyses, since our interests were in quantifying as many sources of variation as possible and not condensing or obscuring any of them in dose-response relation-ships reflected in single derived value. Thus, we modeled the dosage effects of each drug as a separate independent or explanatory variable for drug response varia-tion. It is well-known that models that are “saturated” in that they exhaustively model the effects of independent variables and their interactions are inherently linear. This fact is exploited in many contexts, most notably econometrics, to help draw causal inferences between independent and dependent variables [Angrist and Pischke, 2009]. Although we did not consider all possible interaction terms in our models, we did consider most of them. Ultimately, our linear modeling and ANOVA analyses allowed us to make comprehensive claims about that effects of particular drugs and dosages on specific cell lines while accounting for factors built into the design of the HTS, such a plate effects, that could induce variation in drug responses. Thus, we believe our analyses can help identify signals of truly statistically-significant drug effects over-and-above the “noise” created by various factors, including individual laboratories and/or the individual plates upon which
cells were placed for drug effect characterization. We firmly believe that more so-phisticated analytical methods, careful analyses, and interpretations of drug effect claims in HTS experiments are necessary and will likely lead to the identification and characterization of correctable sources of variation that may obscure HTS results and shed light on claims about their lack of reproducibility.
2.3
Results
2.3.1
Variation of Cell Viability Data Across Dose and
Drug Replicates
Table 2.1 provides a brief summary of the data sets we considered in our analyses. As an initial assessment of the consistency of drug-by-dose effects across the 29 cell lines in common between the SBP nine-concentration and three-concentration HTS studies (Figure 2.1), which comprise all HTS data obtained at matching doses within the SBP HTS data, we considered the use of simple correlation analyses. We found that the data cell viability data are not normally distributed (Shapiro-Wilks test p-value<2.2e-16 for drug responses for each drug) and that the non-parametric Spearman correlation coefficient, rather than the stan-dard Pearson correlation coefficient would be more appropriate for use in assessing the consistency between the two data sets. We computed pairwise Spearman cor-relations for the replicates at 0.1, 1.0, and 10.0 µM concentrations across each drug and cell line (Figure 2.2A, Figure 2.5). Additionally, we calculated the cor-relation coefficients using all available concentrations. As expected, the pairwise correlations at the three concentration points suggested that a subset of the cell lines showed greater evidence for reproducibility. These cell lines were identified as those most likely to be sensitive to the drugs. This makes sense since the cell lines exhibiting no response (i.e., does response curve) contributed only noise to the correlations. In addition, within each dose, the distribution of the correlation coefficients for each drug was skewed left (Figure 2.2B), with a long tail towards negative correlations. This was the same when considering all dosages together,
Table 2.1: Key: CLs = Cell Lines; MCLs = Melanoma Cell Lines; OCLs = Other Cell Lines; CCLs = Melanoma cell lines in common with the SBP nine-point data set; Common drugs = drugs in common with the SBP nine-point data set; SBPMDI = Sanford Burnham Prebys Medical Discovery Institute; TGen = Translational Genomics Research Institute; CCLE = Cancer Cell Line Encyclopedia; GDSC = Genomics of Drug Sensitivity in Cancer
Data Set Doses (um) MCLs OCLs # Drugs CCLs Common Drugs SBPMDI 1 dose 10 49 0 747 37 89 SBPMDI 3 dose .1, 1, 10 30 0 120 29 120 SBPMDI 9 dose .02, .04, .1, .2, .4, 1, 2, 4, 10 40 0 120 40 120 TGen 9 doses .02, .04, .1, .2, .4, 1, 2, 4, 10 4 0 120 4 120 CCLE 8 doses .0025, .008, .025, .08, .25, .8, 2.53, 8 59 888 24 4 9 GDSC 8 doses varied 45 1209 139 4 6
although there was an observed improvement in the correlation coefficient, which may reflect a larger sample size (Figure 2.2C). This highlights the advantage of considering the overall pattern of consistency for drug sensitivity profiles, as op-posed to considering each dose individually. Thus, studies exploring the influence of different factors on HTS results should pursue analyses reflecting variation in the entire experiment, instead of just focusing on each individual drug, cell line or dose in isolation.
2.3.2
Variation Between Two Laboratories
For drugs with at least one cell line exhibiting a 20% cell viability at higher doses, which is consistent with a drug response (n=46), we also calculated the Spearman correlation coefficient between the SBP and TGen response data for each of the nine concentrations and also across all nine concentrations (Figure 2.2D, Figure 2.2E, Figure 2.6). The correlation coefficients across all available
Figure 2.1: Differences in HTS plating schemes. Nine 384-well plates are used for each cell line. Left: TGen/SBP plating scheme. Each plate consists of triplicates of three doses across 120 drugs and 8 DMSOs. Right: Alternate plating scheme with each plate including all 9 doses.
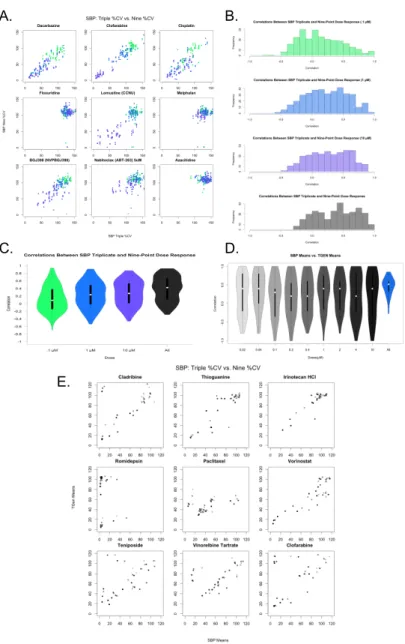
A. B.
C. D.
E.
Figure 2.2: A. Pairwise scatterplots across nine drugs comparing SBP 3-point screen against same three concentrations from SBP 9-point screen. Colors indi-cate concentration: 0.1 (green), 1.0 (blue), and 10.0 µM (purple). B. Correlation coefficients from pairwise spearman correlation across same three concentrations. Colors indicate concentration: 0.1 (green), 1.0 (blue), 10.0µM (purple), and across all three concentrations. C. Violin plot of correlation coefficients. D: Violin plot of correlation coefficients. E. Pairwise analysis of mean Cell Viability across nine drugs exhibiting at least one CV less than 20%. Gradient indicates concentration from 0.02 M (light) to 10µM (dark). Pairwise scatterplots comparing SBP 9-point HTS against TGen 9-point HTS.
dosages were greater than 0.0 in 44 out of the 46 drugs (Bonferroni-adjusted p-value < .05 in 22 of the 44 drugs). Individual pairwise scatterplots for each dose across the 46 drugs indicate that for a large number of them, there is a high degree of between-laboratory consistency. As in the three-concentration drug response analysis performed, the drug responses were more consistent at higher doses and across all dosages when considered together (Figure 2.2E, Figure 2.6). The stronger correlation at higher dosages, especially in the context of lower doses that do not induce an effect or response, reveal technical variation and “noise” that should be considered in analyses seeking to identify bona fide drug-induced effects producing signals that rise above this experiment-wise noise. Likewise, the improved corre-lation coefficients observed when comparing the nine-concentration dose-response curves (DRCs) against the three-concentration DRCs suggest that a full range of DRCs may be better at revealing true biological variation in the HTS data.
2.3.3
Comprehensive Analysis Considering the Entire HTS
Experimental Setting via ANOVA Modeling
For a more comprehensive assessment of the factors contributing to the variation in drug response associated with our HTS studies, we applied flexible linear regression modeling within an ANOVA context. We ultimately wanted to partition the variation in cell viability data arising from the entire HTS study into factors representing different experimental and biological conditions (i.e., across all plates on which the samples were arranged, drugs, drug concentrations, cell lines, and laboratories; Supplemental Table 2.1). We limited this analysis to the four cell lines in common at the two independent laboratories. In order to conduct the modeling appropriately, we initially had to choose a comparator to be contrasted with all the other subgroupings for each of the different factors we studied. This was achieved by creating simple zero (absence) or one (presence) dummy variables for each factor subgroup. We randomly selected SBP as the comparator laboratory, Cladribine as the comparator drug, plate 36 (from the SBP experiment) as the comparator plate, cell line A375 as the comparator cell line, and the lowest dose (0.02 µM) as the comparator dose. Our analysis found that the laboratory used
Table 2.2: Percentage of variance explained by the experimental factors.
Df Sum Sq Mean Sq F value Pr(>F) % Variance explained CellLines 3 1409075 469692 1064.446 <2.2e-16 4.94 SBP 1 7975 7975 18.0742 2.13E-05 0.03 Ldose 8 1493445 186681 423.0677 <2.2e-16 5.24 Drug 119 12966053 108958 246.9287 <2.2e-16 45.46 Plates 65 921052 14170 34.236 <2.2e-16 3.23 Residuals 25723 11721774 441
explained 0.028% of the variation in drug response, whereas plate (3.23%) and other biological factors such as drugs (45.5%), concentration (5.24%), and cell lines (4.94%) explained approximately 60% of the variation (Table 2.2). To identify the individual factors that were most statistically significant sources of variation, we carried out simple t-tests on each factors regression coefficient. We used a conservative Bonferroni-correction to accommodate the multiple tests. The results suggested that laboratory was only marginally significant factor relative to the others (Figure 2.3A, Figure 2.7). Analysis of the cell lines indicated that two of the four cell lines, MeWo and SK-MEL-2, had an effect on drug responses that were statistically significantly different from the comparator cell line A375. This could be due to the BRAF mutation status in the cell lines: A375 (the comparator cell line) and UACC-0257 are cell lines with the BRAF V600E mutation, whereas MeWo and SK-Mel-2 are BRAF wild type cell lines. Obviously, more work on this hypothesis is needed before attributing differences to the presence of the BRAF V600E mutation. Additionally, the higher concentrations (i.e., 2.0, 4.0, and 10.0
µM) were the most statistically significant, consistent with the existence of overall dose-response relationships in the experiment.
Interestingly, we also found that a large number of SBP plates were mod-erately statistically different from other plates both used at SBP and TGen; how-ever, a single TGen plate (plate 25) was highly significant. Furthermore, only one SBP plate yielded a more significant t-statistic (plate 27) than the TGen plate 25 (Supplemental Table 2.2). As expected, the outlying plates produced DRCs with greater variability (e.g., Mitoxantrone DRCs for UACC-0257 at 0.1, 1.0, and 10.0
A.
B.
C.
Figure 2.3: A: Application of flexible linear models, using ANOVA methods, to explore the variation in CV that is explained by site, cell lines, dose, drug, and plates. Sites explained a small proportion of the variation, whereas drugs, dose, and cell lines explained a majority of the variation observed in CV. Nine of the 120 drugs are shown. B. Plots of dose response curves for each of the cell line and site combinations. For example, greater variance is observed within Mitoxantrone in concentration from outlying plates detected by ANOVA-like methods. C. Assessing the variation in CV that is explained by site, cell lines, dose, drug, and drug-site interaction. To further assess the reproducibility of HTS, we examined the drug-site interaction terms and found that 19 of the significant drugs did not have a significant drug-site interaction term.
µM for SBP plate 27 and at 0.02, 0.2, and 2.0µM for TGen plate 25, Figure 2.3B). Although plate-effects explained 3.23% of the variation in cell viability, the small number of highly significant plates suggests that plate analysis and ways of accom-modating plate effects in HTS data analyses, or subsequent removal of outlying plates, should be performed to assess the overall quality of the HTS data and po-tentially lead to explanations for why some drugs dont replicate across site-specific studies (e.g., because some plates were outlying and should be removed as opposed to a more global analysis and rationale). The reasons for plate effects should be explored, but could reflect contamination, technician, or robot error when setting up the plate or experiment in question. Importantly, if the drugs, concentrations and cell lines used on the plate led to biologically meaningful effects, then one would not be able to separate the biological significance from a potential technical artifact, which suggests the use of controls and designed plating schemes are neces-sary. Finally, we found that most drugs in the study exhibited strong, statistically significant p-values, far beyond what would be expected by chance alone.
2.3.4
Exploring Interaction Effects
To identify whether specific drugs, cell lines, doses, and sites were significant predictors of drug response (i.e., cell viability) while considering other factors, we added interaction terms to the linear models. When we accounted for laboratory x drug interactions, we found that many of the drugs exhibited significant inter-action term p-values; in fact many more than would be expected by chance alone. These results indicate that although drugs may influence variation in cell viabil-ity across the experiment as a whole, some of the cell viabilviabil-ity variation may be laboratory-specific (Supplemental Table 2.3). 19 drugs yielded significant drug p-values, yet non-significant drug-laboratory interaction effects (Figure 2.3C, Figure 2.8), indicating that these drugs exhibited overtly reproducible effects (Supple-mental Table 2.4). As expected, when we incorporated the drug x dose interaction terms into our analysis models, we found that a majority of the variation signifi-cantly accounted for by dose was limited to higher concentrations, which of course makes sense (Figure 2.9). Importantly, drug x laboratory interaction effects only