A Latent Variable Approach for the
Construction of Continuous Health
Indicators
David Conne and Maria-Pia Victoria-Feser
No 2004.07
Cahiers du département d’économétrie
Faculté des sciences économiques et sociales
Université de Genève
Août 2004
A Latent Variable Approach for the
Construction of Continuous Health Indicators
David Conne and Maria-Pia Victoria-Feser
∗University of Geneva,
Faculty of Economics and Social Sciences
August 2004
Abstract
In most health survey the state of health of individuals is measured through several different kinds of variables such as qualitative, discrete quantitative or dichotomic ones. From these variables, one aims at building univariate indices of health that summarize the information. To do so, we propose in this paper to use Generalized Linear Latent Variable Models (GLLVM) (see e.g. Bartholomew and Knott 1999), which allows to estimate one or more continuous latent variables from a set of observable ones. As an application, we consider the data from the 1997 Swiss Health Survey and build two health indicators. The first one describes the health status induced merely by the age of the subject, and the second one complements the first one.
∗Part of the research took place while the first author was working under the
super-vision of Prof. G. Antille Gaillard, for the IRIS program of the Universities of Lausanne and Geneva and the Swiss Federal Institute of Technology, Lausanne. This program is financially supported by the “Conference Universitaire Suisse" and its partners. The second author is partialy supported by the Swiss National Science Fundation (grant no 610-057883.99).
1
Introduction
In most European countries, gouvernements are concerned with the increase of health expenditure. To help politics to make good decisions, it is important to give them clear information about health status of the population, possi-bly summarized by means of a small number of indicators. The latter can be health inequality indicators which are computed on continuous health vari-ables. However, the information obtained from health surveys are answers to questions mostly on ordinal or binary scales. It is therefore important to be able to summarize this type of multivariate information into one ore more continuous indicators on which summary statistics can be computed.
van Doorslaer and Jones (2003) have proposed a single variable as an health indicator: the self-assessed health (SAH). As a continuous indicator, they use a latent variable with a lognormal distribution, assumed to be un-derlying the SAH. Even if Idler and Benyamini (1997) showed that the SAH is a good health indicator, it is clearly better to select more than one variable to represent health status.
In order to use the whole information contained in a set of variables, we propose here to follow a latent variable approach in which we suppose that the latent variable (i.e. the health indicator) induce the observed answers to the questionnaires. In its simplest form, latent variables models are well known under the factor analysis model. However, the latter is valid only when the manifest variables are normal. When this is not the case, one can use Generalized Linear Latent Variable Models (GLLVM) developped by Moustaki (1996), Bartholomew and Knott (1999) and Moustaki and Knott (2000). To estimate the latter, we use the approach proposed by Huber et al. (2004) which is implemented in a software called LCube.
The paper is organized as follows: The next section is a short presentation of GLLVM, then we present the data from the 1997 Swiss Health Survey. In section 4, we show and interpret the results of the analysis. Finally, we conclude in section 5.
2
Generalized Linear Latent Variable Models
(GLLVM)
Suppose that we have p questions in our survey so that we can define p
manifest variables, noted x(j) j = 1, ..., p. We suppose that there are q
latent variables, noted z(k) k = 1, ..., q, with z = (z(1), ..., z(q)) (i.e. our
health indicators for example). Usually, q is small. The aim of the GLLVM is to describe the relationship between the manifest variables and the la-tent variables. This relationship is defined with the conditional distributions
gj(x(j)|z), j = 1, . . . , p, which belongs to the exponential family and hence
includes distributions for discrete or cardinal and binary variables. The re-lationship between the manifest and the latent variables is made explicit through the so-called linear predictor (see e.g. McCullagh and Nelder 1989) i.e.
ν
³
E£x(j)|z¤´ = α
0j+α1jz(1)+...+αqjz(q) (1)
whereν is a link function that maps the manifest variable space to the latent one. The αkj are usually called the loadings and have a direct interpretation
for the definition of the latent variables.
The essential assumption in the GLLVM is that, given the latent vari-ables, the manifest variables are conditionally independent. In other words, the latent variables explain all the dependence structure between the manifest variables. This is the same assumption made in factor analysis for example. Without loss of generality, we suppose that the latent variables are multi-variate normal z ∼N(0, R), withR a correlation matrix. The measurement scale of the latent variables is somewhat arbitrary and is not a central issue. What is important is the choice of the conditional distribution gj: choosing
for gj the normal distribution (factor analysis) when the manifest variables
are ordinal or worse binary can lead to seriously biased results.
In order to estimate the parameter of the model α (the loadings), we use the procedure of Huber et al. (2004) based on the maximum likelihood estimator. The procedure to calculate our health indicator is the following: first, we estimate the loadings α for several models (1,2,3 latent variables). Secondly, to select the suitable model, we use the Akaike (1973) criterion. Finally, based on the latter model, we compute a score on each latent variable, which constitute our health indicator.
3
The 1997 Swiss Health Survey
The 1997 Swiss Health Survey concerned 12’902 persons which were randomly selected in each household belonging to a stratified sample. These individuals are all over 15 years old and had to answer by phone to questions about their socio-demographic situation, their health status or their behaviour towards health. We chose 19 variables that can be considered as providing information about health status of individuals. These variables are given in the appendix. The manifest variable can be split into variables describing subjective health, handicaps (e.q. seeing, hearing and walking) and symptoms (pains and psychological problems). Part of these variables are ordinal ones with 3 to 5 classes and others are binary, with the lower values corresponding to healthier status.
If we make a descriptive analysis of the data, we notice that people living in Switzerland rate their health as good or better; indeed, more than 75% say that they are in a good or excellent health. The most common type of pain in Switzerland, as in other occidental countries, are backache, headache and joint problems. For ordinal variables, we observe that the distributions are skewed to the right.
4
Health Indicators
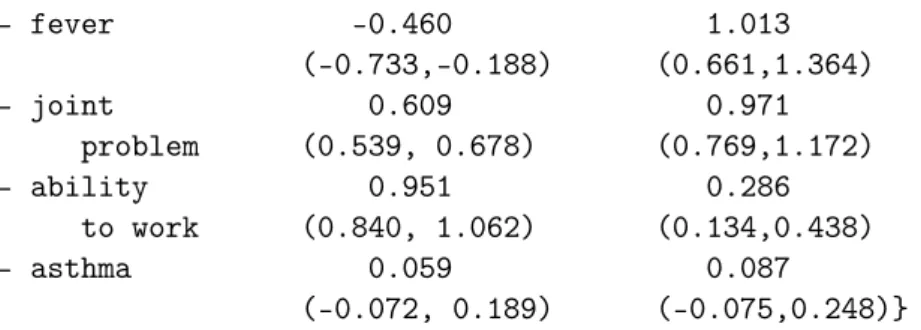
We estimate here a GLLVM to construct health indicators for Switzerland. With the Akaike criterion, we find that the model with two latent variables is the best one, which means that we have two continuous health indicators. To interpret the latter, we look at the loadings on the manifest variables for each latent variable (see eq. 1). For our data, their values are given in table 1 (in brackets, the confident intervals).
Latent 1 Latent 2 - SAH 0.857 1.305 (0.784, 0.930) (1.061,1.549) - chronic 1.294 1.246 illness (1.394, 1.195) (1.468,1.024) - eyesight 0.965 0.536 (0.843, 1.086) (0.360,0.711) - hearing 1.093 0.474 (0.958, 1.227) (0.303,0.645) - ability 27.447 0.011 to walk (21.532,33.361) (-4.296,4.318) - allergic cold -0.310 0.296 (-0.402,-0.218) (0.208,0.384) - psychiatric 0.070 1.160 treatment (-0.119, 0.258) (0.975,1.348) - backache 0.430 0.793 (0.370, 0.489) (0.638,0.948) - weakness 0.036 1.313 feeling (-0.088, 0.161) (1.120,1.506) - stomachache -0.193 0.959 (-0.339,-0.047) (0.760,1.158) - diarrhoea -0.006 0.901 (-0.124, 0.112) (0.718,1.083) - insomnia 0.452 0.799 (0.391, 0.513) (0.635,0.963) - headache -0.269 0.742 (-0.382,-0.156) (0.648,0.836) - cardiac 0.537 1.088 problem (0.437, 0.637) (0.861,1.315) - chestache 0.279 1.351
- fever -0.460 1.013 (-0.733,-0.188) (0.661,1.364) - joint 0.609 0.971 problem (0.539, 0.678) (0.769,1.172) - ability 0.951 0.286 to work (0.840, 1.062) (0.134,0.438) - asthma 0.059 0.087 (-0.072, 0.189) (-0.075,0.248)}
Table 1: Loadings estimated for both latent variables
Before interpreting the results, we make the following remarks: first, the load-ings indicate the strength of the relationship between the corresponding manifest variable and latent variables. Second, the normality of the latent variables does not imply the normality of the scores on the latent variables. Third, the order of the latent variable is arbitrary.
For the first latent variable, four variables are not significant: “psychiatric treatment”, “weakness feeling”, “diarrhoea” and “asthma”. The loadings for the manifest variable “ability to walk” (27.447) is more than 20 times higher than all the other ones. Then this latter variable represents alone a health indicator. Four variables have an inconsistant sign on this latent variable. Indeed, “allergic cold”, “stomachache”, “headache” and “fever” have a loading which is negative. Thus their relation with this latent variable is opposite to the one of the other manifest variables. However, this is not particulary relevant, because all the loadings of the manifest variables are small compared to the one of the variable “ability to walk”, and therefor their influence is negligible. Moreover, it should be noted that the variable with the second largest loadings (say around 1), correspond to health variables that rather discriminate people according to their age. These variables are “chronic illness”, “eyesight” and “hearing”. It is therefore legitimate to ask if
z(1) is more an age indicator rather than a health indicator.
For the second latent variable, only two variables are non significant: “ability to walk” and “asthma”. “asthma” has no influence on both health indicators. Except the variables “disability to work” and “allergic cold”, all the manifest variables have a comparable influence. This indicator is therefore based on a larger number of health variables than the first one. It is however based more on the symptom variables, the subjective health and the psychiatric treatment, which have higher loadings. The sign of the loadings are consistant on this second latent variable.
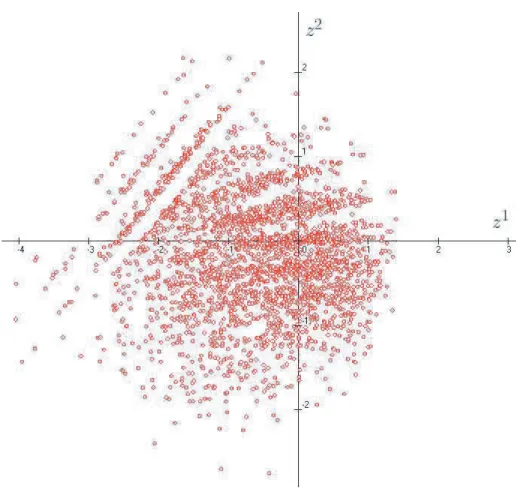
Figure 1: plot of the scores on both latent variablesz(1) and z(2)
On this graph, we can clearly see 4 groups formed by 3 "lines" and a truncated circle. After checking the data, the 4 groups correspond to the 4 modalities of the variable "ability to walk", with the truncated circle for the most able ones.
By looking at the scores onz(2) of each group, one can see that they are similar,
which in our opinion means that, as argued before, z(1) is more an age indicator than an health indicator. In other words, once one takes into account the health problems induced naturally by aging , there is a second independent indicatorz(2)
that can be use to describe the health status of the persons.
5
Conclusion and perspectives
This work has shown that it was possible, starting from ordinal and binary vari-ables, to estimate two continuous indicators on health status which are satisfactory both from the statistical point of view and from their interpretation. From this one could now derive a concentration indice based on the methodology developed by Wagstaff and van Doorslaer (1994).
6
Appendix: description and type of manifest
variables
Description Type subjective health ordinal (5) chronic illness binary eyesight ordinal (4) hearing ordinal (4) ability to walk ordinal (4) allergic cold binary psychiatric treatement binary backache ordinal (3) weakness feeling ordinal (3) stomachache ordinal (3) diarrhoea ordinal (3) insomnia ordinal (3) headache ordinal (3) cardiac problem ordinal (3) chestache ordinal (3) fiever ordinal (3) joint problem ordinal (3) disability to work ordinal (3)
References
Akaike, H. (1973), “Information Theory and an Extension of the Maximum Likeli-hood Principle,”Proceedings of the 2nd International Symposium on Information
theory, Petrov and Czaki eds., 267–281.
Bartholomew, D. J. and Knott, M. (1999), Latent Variable Models and Factor
Analysis, London: Arnold.
Huber, P., Ronchetti, E., and Victoria-Feser, M.-P. (2004), “Estimation of Gener-alized Linear Latent Variable Models,” Journal of the Royal Statistical Society, to appear.
Idler, E. and Benyamini, Y. (1997), “Income-related inequalities in health in Canada,” Social Science and Medicine, 38, 21–37.
McCullagh, P. and Nelder, J. A. (1989), Generalized Linear Models, New York: Chapman & Hall, 2nd ed.
Moustaki, I. (1996), “A Latent Trait and a Latent Class Model for Mixed Observed Variables,” British Journal of Mathematical and Statistical Psychology, 49, 313– 334.
Moustaki, I. and Knott, M. (2000), “Generalized Latent Trait Models,”
Psychome-trika, 65, 391–411.
van Doorslaer, E. and Jones, A. (2003), “Inequalities in self-reported health: val-idation of a new approach of measurement,” Journal of Health Economics, 22, 62–87.
Wagstaff, A. and van Doorslaer, E. (1994), “Measuring inequalities in health in the presence of multiple-category morbidity indicators,” Health Economics, 3, 281–291.