UNIVERSITY OF TARTU
Institute of Computer Science
Software Engineering
Shalva Avanashvili
Opinion-Driven App Recommender System
(ODARS)
Master’s Thesis (30 ECTS)
Supervisor(s): Main supervisor: Faiz Ali Shah Co-supervisor: Dietmar Pfahl
Opinion-Driven App Recommender System
Abstract:
Currently, there are no decent ways for the users to quickly determine what people are thinking about the specific application and its features, or which application is better than the other. Users mainly rely on the ratings, some articles or reviews before downloading the application. Unfortunately, it is really difficult for the human to go through all reviews in order to get an impression on an application, to see how positively or negatively people have been thinking about the specific features.
Recently, a SAFE approach was proposed for app feature extraction from user reviews and app description. The approach has shown its superiority over the previous techniques. However, there is no tool that that uses the recent SAFE approach to analyze user sentiments mentioned in user reviews at app feature-level.
The intention of this study is to develop a tool to analyze user sentiments mentioned on app features in user reviews. The tool enables to perform analysis at single app or multiple apps levels. The app features are extracted from the user reviews and app description together. A survey is conducted to evaluate the developed tool based on its ease of use, usefulness and future use.
Keywords:
Feature extraction, Appstore scrapping, opinion mining, sentiment analysis. CERCS Classification: P170 - Computer science, numerical analysis, systems, control
Arvamustel põhinev rakenduste soovitussüsteem
Kokkuvõte
Hetkel puuduvad tõhusad vahendid saamaks kiiret ülevaadet sellest, mida inimesed arvavad kindlatest rakendustest ja nende võimalustest, või milline rakendus on teistest parem. Rakenduse alla laadimisel tuginevad kasutajad peamiselt rakendusele antud hinnangutele, ülevaadetele ja arvustustele. Paraku on inimese jaoks keeruline lugeda läbi kõik arvustused, et saada rakendusest ülevaade ja mõista, kui positiivselt või negatiivselt on inimesed arvanud kindlatest funktsionaalsustest.
Hiljaaegu pakuti rakenduse funktsionaalsuse eraldamiseks kasutajate ülevaadetest ja kirjeldusest välja SAFE lähenemisviis. See lähenemisviis on tõestanud oma ülimuslikkust varasemate tehnikate suhtes. Siiski ei leidu ühtegi tööriista, mis kasutaks hiljutist SAFE lähenemisviisi, et analüüsida kasutajate meelestatust, mida on mainitud kasutajate rakenduse funktsionaalsust puututavates ülevaadetes.
Antud uurimuse eesmärgiks on välja arendada tööriist, et analüüsida rakenduse funktsionaalsust puudutavat meelestatust kasutajate ülevaadetes. See tööriist võimaldab analüüsida ühte või mitut rakendust. Rakenduse funktsionaalsused eraldatakse kasutajate ülevaadetest ja kirjeldusest. Välja arendatud tööriista kasutuslihtsuse, kasulikkuse ja tulevikuväljavaate hindamiseks viiakse läbi küsitlus.
Võtmesõnad:
funktsionaalsuse eraldamine, Appstore’ist andmete eraldamine, arvamuste kaevandamine, meelestatuse analüüs
Table of Contents
1. Introduction ... 6 1.1. Research Problem ... 6 1.2. Research Questions ... 6 1.3. Thesis Structure ... 7 2. Related Work ... 8 2.1. SUR-Miner ... 8 2.2. AR-Miner ... 102.3. Prioritizing Feature Improvements... 12
2.4. Feature-Based Evaluation of Competing Apps ... 13
3. Background ... 16 3.1. SAFE Approach ... 16 4. Methodology ... 18 4.1. Generating Recommendations ... 18 4.1.1. Data Collection ... 18 4.1.2. Preprocessing ... 20 4.1.3. Feature Extraction ... 21 4.1.4. Sentiment Analysis ... 24 4.2. Tool Development ... 25 4.3. Tool Evaluation ... 26 4.3.1. Study details ... 28 4.3.2. Scenarios ... 29 5. ODARS Implementation ... 30 5.1. Web Application UI ... 30 5.1.1. Applications Page ... 30
5.1.2. App Features Page ... 32
5.1.3. Sentiments Page ... 35
5.2. Node.js API ... 38
5.3. Stanford Core NLP ... 40
6. Evaluation ... 42
6.1. Survey Based Study for Usefulness and Usability ... 42
6.1.1. Execution of Evaluation ... 42
6.1.2. Results for "Usefulness" and "Ease of Use" ... 43
7. Summary ... 47 8. References ... 48 9. Appendix ... 51
1.
Introduction
1.1. Research Problem
There were around 2.2 million apps on the app store until March, 2017 and 60 thousand are added per month [1][25]. The rate of the uploads is also raising, which means that it may reach tens of millions in few years. There are different applications in different categories and most people are facing the problems in choosing the best. The word "best" here is subjective, "the best" app for one person may be "the worst" for the second. So searching and choosing one out of couple thousands has always been a problem.
App marketplaces have implemented the functionality to submit the review and add rating which means to express your opinion on the app. While choosing the applications, people overlook the reviews and the ratings, but it is not a surprise that it is unbelievably difficult to determine where the app has problems, which features are the best and which not. The ratings even do not give any valuable information regarding app features, some studies have been conducted which say that users mainly express their opinions about the features in a textual way [2], not numerical. The reviews hold the users’ opinion and it may contain feature as well. Thus, reviews can be used to extract features and detect how positively or negatively users are thinking about these features.
So, I am are trying to build the app recommender system - ODARS, which will help users to compare two selected applications. The analysis of those two applications is made from the user reviews and from the app description together. The tool allows a user to analyze a single application and see what people are thinking about specific features which will be selected by the user. In order to extract features from reviews and app description, I am using SAFE approach, which outperforms previous techniques in performance. No machine learning is required; moreover, it is simple and uses part of speech and sentence structure patterns to extract features.
1.2. Research Questions
● How is SAFE approach used to build the Opinion-Driven App Recommender System - ODARS?
1.3. Thesis Structure
The study is structured into the following sections. Section 2 discusses about the related work, which discusses what has been done so far. The next Section presents the background and introduces the main research questions tackled in this study. The fourth chapter is methodology the part where my algorithm of feature extraction and ODARS technical details is presented. Then comes ODARS implementation chapter, which itself consists of description how the system was developed. The last chapter is evaluation part where the interviews and future work is discussed.
2.
Related Work
Before starting working on feature extraction, first I need to parse app store. Application categories, applications themselves and their reviews, all are extracted from the Appstore. That is why I will be using the node.js wrapper called: app-store-scraper. [3] App-store-scraper is the perfect package for retrieving reviews, categories, and applications, it is built on apple RSS feed API. API, which will be the main source of data, will add different endpoints on top of already existing ones in App-store-scraper package.
Now let's speak about the existing studies that analyzes the user reviews which have been conducted before.
2.1. SUR-Miner
There have been several studies which identified app features and then presented them with their associated sentiments. One of them is "SUR-Miner" which also was built for summarising reviews. The approach classifies features into five different categories such as bug reports or new feature requests. The approach uses 26 templates of sentences for extracting the features. [4] SUR-Miner analysis the full structure of the sentences and categories them into already predefined sentence patterns. Then the sentiment analysis is done on each sentence from the review and then associated each of them to aspect-opinion pairs. Lastly, all these aspect-opinion pairs are clustered.
If we go into more details, SUR-Miner classifies five different categories of reviews which are: feature requests, bug reports, aspect evaluation, praises and others. Each sentence from the review is in either of the category from above mentioned ones. The first step is to choose sentences from 'aspect evaluation' category. Then the aspects and sentiments should be extracted from those sentences. The result is the aspect-opinion-sentiment pairs which are next, clustered and visualized. The steps which should be done are:
1. Preprocessing - this is the step where the reviews are split into sentences. On top of that all typos, slangs or shortcuts are converted into normal text e.g & = and, cos = because, U = You etc. The main tool here is Stanford Corenlp library. [6] They have come up with 60 slangs/contractions or repetitions which would replace all incorrect words.
2. Review Classification - this is the step where the sentences should be categorized in above mentioned five categories. Authors are using supervised machine learning approach to correctly assign the sentences to the categories. For that they need some model which will automatically categorize sentences into categories, thus they trained the data first. Authors manually categorized the features and then tried to train the model. They have used Max Entropy classifier which has a really good performance on text classification. [11]
3. Aspect-opinion Extraction - this is the step of a summary of users' opinions towards the aspects [4], in order to achieve that authors have to extract aspect-opinion pairs from the review sentences. e.g connectivity-accurate, location-incorrect. In order to achieve that they are taking all sentences from aspect evaluation category and searching for the pairs. Searching is not that straightforward, that is why authors are using pattern-based method for that. On contrary, state-of-art extracts the features from the sentences by frequent item-mining, which means that the reviews are considered as a bag of words [4][11][12][7] and their methods are extracting most frequent items that have been mentioned in the sentences. As mentioned above SUR-miner is defining pattern-based parsing method which parses the reviews and extracts the aspect-opinion pairs by applying the patterns and searching for them inside the sentences. Figure 1 is showing some typical patterns, [4] also the sample sentences. The templates are the patterns which represent the order of different types of words
like: verb, noun, conjunction, etc.
Figure 1: Example of patterns
4. Aspect Sentiment Analysis - despite the fact that opinions are already known, the sentiments of each opinion should be retrieved. Not only the rating is considered here but also the text sentence, from where the aspect-opinion was extracted. The review may contain several sentences thus the sentiment analysis is done in sentence level. The authors of SUR-Miner are offering their own method for sentiment analysis. First, they are using tool Deeply Moving [4] for analyzing sentences. The tool produces the score from 0 (most negative) until 4 (most positive) while 2 is
remaining to be neutral. Secondly, let's say the review contains two sentences like: "The map is working nicely. But the sound system has huge problems.". Normally, here the first sentence would have the sentiment score of 4, while the second - 0. But, the overall sentiments score is calculated depending on both sentences and plus rating of whole review. If the rating is 1, first sentence sentiment score would be 3(4-1) subtracting one because of the negative rating. But, if the rating is 5 the second sentence's score is - 1 (0+1). So each review score is depending on the rating as well. 5. Aspect clustering and summarization - the step where all aspect-opinions with the
same aspects are grouped together and where the opinions for each group and sentiments are analyzed. Authors are taking the most frequent aspect and using it as a name of a group, on top of that they are calculating the average sentiment score for the group.
6. Visualisation - the last part is showing/ visualizing two interactive diagrams. They help users and developers to identify the aspects/features which are loved by users. [4]
So, to summarise, Sur-Miner extracts the features which are loved by the users, and authors are extracting features from the 'aspect evaluation' category. But my aim is to use not only 'aspect evaluation' category but 'bug reports' as well, because most of the negative feedback are depicted in the bug reports category. That is why Sur-Miner cannot be used to fully achieve my goals.
2.2. AR-Miner
Another interesting study has been made by Ning Chen, Jialiu Liny, Steven C. H. Hoi, Xiaokui Xiao, Boshen Zhang in Singapore Management University. Their study is called AR-Miner and the main purpose of it is to get as much useful information from user reviews as possible. Mainly this information is intended for developers in order to fix bugs, implement specific features or improve the user experience. [7] Before starting the review extraction AR-Miner as SUR-Miner clears the noise in the sentences and removes unnecessary sentences or even reviews. Plus formats the reviews in a nice way. After preprocessing it filters out the reviews which can be used and which not by applying already predefined classifier. As the authors are mentioning that only 35.1% of reviews are useful for developers. [7] The sentences are divided into two categories: informative and non-informative. Informative are sentences which may have any valuable information for the
developer, while non-informative sentences are not holding any value for the developer. On top of that, these two categories are divided again into smaller groups similar to feature requests, bug fixes e.g. To be more concise how they achieved their results lets explain it step-by-step.
1. Preprocessing - the main idea of preprocessing is to convert each review in the predefined format, called as a review instance, which looks like A = {Text, Rating, Timestamp}. Since the review may contain multiple sentences authors are splitting it into sentence level by splitter tool LingPipe, [14] the reason is that some of the sentences from the review may be informative and some of them not. After having sentence granularity level then the authors are clearing the sentences, removing non-alphanumeric symbols, converting all words into lowercase, removing extra white spaces. The final sub-step is to remove all review instances which became empty after the pre-processing.
2. Filtering - the step where the sentences are grouped into two categories: informative or non-informative. Filtering can be achieved by building some classifier which will be applied to the sentences and filter out all non-informative sentences.
3. Authors are using machine learning algorithm EMNB (Expectation Maximization for Naive Bayes) [15] and a small amount of labelled data to build the classifier.
4. Grouping - after the filtering is done, informative review sentences are grouped together based on the topics they are about. To achieve that there were two ways: first to use K-means [16] algorithm which will assign the sentence to exactly one topic which can be problematic at some point. Another is to use topic modelling which assigns topic to the sentence itself e.g. sentence may have 50% of one topic and 50% of another.
5. Ranking - ranks the groups by importance. They have implemented their own ranking model which mainly searches the most important feature discussed in the sentences. 6. Visualisation - system visualizes the top 10 features from the ranking model. Figure 2
shows top ten features and their scores. The bottom part is the visualization part how the authors have decided to draw the result to developers.
Figure 2: scores of the top ten features from the ranking model [7]
Basically Ar-Miner is designed for the developers to see how their apps are behaving and what customers are thinking about it. It only displays top 10 features from the app, but my main goal is a bit broader. Since I am comparing two applications to each other there is really low chance to find enough common features between them from those extracted ten features.
2.3. Prioritizing Feature Improvements
One of the recent studies have been done by Swetha Keertipati, Bastin Tony Roy Savarimuthu and Sherlock A. Licorish who was analyzing app reviews and then extracting the features. The idea is that each noun is considered to be the feature of the app. [5] But since they were looking only for the sentences where the improvements were mentioned authors had different approaches, compared to above mentioned studies, to find them. As a first step, they were splitting the reviews to a sentence level. Authors thought that delimiters like dot (.) or exclamation mark (!) could be logical to use to split reviews into sentences. Since their aim was to find only sentences that met some specific criteria(only improvements) they took sentences that had rating less than 3, also sentences that mentioned negative emotions have been selected.
The second step was the identification and also extraction of attributes [5] which could be beginning of prioritizing the features. In order to achieve this, authors tried several ways like:
1. Prioritising by frequency - each attribute was searched once in a single sentence if the sentence mentioned that attribute the count of the attribute was incremented by one. At the end of this sub-step features with the highest counts were selected.
2. Prioritising by rating - users are giving the rating with the review within the scale points from one to five. So for each attribute, the average rating was calculated and at the end of the step, the attributes with the lowest rating were selected. Authors thought that a lower rating means that there is more chance for the attribute to be required to be improved.
3. Prioritising by emotions - authors were depending on the research of psychologists, [19] that they have analyzed the emotions of human and divided them into six categories: fear, anger, sadness, joy, love, and surprise. So they were selecting most negative emotions such as fear, anger and sadness as the ones that can be used for finding the sentences requesting the improvements. For identifying and categorizing sentences into those three emotions LIWC [17] dictionary was used. The idea of selection attributes was that everytime the attribute was within the selected emotions category the count number was incremented by one. At the end of the substep the attributes with the highest count number were selected.
4. Prioritising with deontics - the word deontic means the obligation. [18] So the authors were searching the sentences which were signaling to obligation. Again at the moment the attribute was found in the sentence the count number was incremented and at the end of the process the attributes with the highest count number were selected
The last step was to compare different approaches how effective they were. Current study is designed for extracting the features which need to be improved; it does not use sentences which mention bug reports, so quite important features may be lost.
2.4. Feature-Based Evaluation of Competing Apps
Another paper about the feature extraction was done at the University of Tartu by Faiz Ali Shah, Yevhenii Sabanin and Dietmar Pfahl. They are using a predefined dataset which is publicly available on the Website of the Swinburne University of Technology and contains 25 applications from the App Store. They are starting to clean data, like removing the typos or changing the slangs into formal words e.g '&' is converted into 'and', 'plz' is converted into
please etc. [2] Authors did the same as Guzman[8], extracted nouns, verbs and adjectives from the sentences because most likely, those words will hold the information about the feature and the opinion about it. They used NLTK (Natural Language Tool-Kit) for extraction. After that stop words were removed, the words that do not make any sense or do not hold any valuable information like: "it", "this" etc. They also added some custom stop words which were excluded from the further study. The last step for preprocessing was to group semantically similar words together, like "using" and "uses" should have been grouped into "use". For that again NLTK was used.
Next step is to extract the features from the sentences, for that authors have used Guzman[8] technique. First they are trying to search two word collocations and their support count. For that python library Pymining is used which extracts two word collocations. Authors are believing that they are potential product features. [2] The order between the words does not change anything, thus "strong tea" and "tea strong" are considered to be the same word collocation. Since users may use different words to express the same opinion, authors are grouping the synonyms together and the collocation with the highest frequency will become the name of the group. Like if you have two collocations: "track exercise" and "track workout" with support count 69 and 22 respectively, after grouping them together the name of the group would become "track exercise" since it has the highest support count (frequency). [2]
Next step is to make sentiment analysis on the sentences. The aim of this step is to have knowledge whether the sentence is positive or negative. The library which the authors are using is called SentiStrength which decides the sentence is either negative or positive. The scale for positive sentences starts from 1 and ends with 5, where 5 means extremely positive and 1 indicates that there is something positive in the sentence. Almost same applies for negative sentences, compared to positive scale here the sign is changed and the scale is from -1 to -5, where -5 indicates that the sentence is extremely negative and -1 means that there is something negative in the sentence. Average sentiment for the feature is calculated by summing up the sentiments scores for each sentence where the feature was mentioned and then divided the summed number by the count of sentences where the feature was mentioned. And the last step is to store features with support count with their sentiments score and also associated sentences into the database for the further use. [2]
3.
Background
In this chapter, I will be discussing the main ideas what I am going to improve and contribute. Mainly, I will be looking for more details in the SAFE approach, which is my main resource. SAFE is simple to implement, because no complex machine learning algorithms are required. Instead, it is using part of speech and sentence patterns to extract features. On top of that, SAFE outweighs the other techniques in the fact that it is able to extract features not only from the reviews but from the app description as well. SAFE is the very recent study, which outperformed other studies with its performance.
3.1. SAFE Approach
The SAFE approach is the main research and resource that will be used in my study. SAFE allows me to extract features regardless the sentence category or the meaning. It does not have limitation on the number of features it can analyze, that is why I thought it can be best fit for extraction the features. Compared to above-mentioned papers, SAFE does not use any machine learning algorithms or any trained data to find features in the reviews. It has already predefined 18 part-of-speech patterns which mainly contain the features. [9]
As the first step authors are identifying the SAFE patterns - there are two types of patterns that should be identified in the reviews. The first pattern is called SAFE POS while second - SAFE sentence patterns.
1. SAFE POS - this is the substep for identifying the patterns which are used to express the feature. For that reason, 100 apps from Google Play Store have been taken and have been manually looked through to find the feature patterns [9] like VB NN NN(Verb, Noun, Noun). Authors have been using NLTK(Natural Language Tool-Kit) for extracting sentences from reviews, and then one of the researcher manually looked through those 100 app descriptions and took the patterns. After identifying the patterns from the sentences they have excluded those POS patterns which occurred less than 10 times.
2. SAFE Sentence Patterns - sometimes the structure of the sentence is not similar to the ones mentioned in the above step. Users sometimes are using delimiters to express several features e.g I love taking pictures, videos and slow-motion videos. Here instead of the one we have three features: take a picture, take video, take slow motion video. So authors have come up with five similar cases and are handling them. Those cases can be sentences split by enumerations(comma) or any conjunction [9].
3. At the end of this step, the patterns are already clear and ready to be applied to the reviews. Next step is automatically extracting features with the help of the patterns mentioned in the above step. At first, before starting extracting the features from the reviews, I have to clean the reviews/sentences, so basically I have to process and clean the text. Sentences, which include URLs, email address, quotas, are removed. On top of that all sentences containing asterixis(*) which refers to bullet-points are removed. Secondly, SAFE analyses and decomposes the sentences based on conjunctions, enumerations and feature patterns which were discussed above. The approach applies all patterns on the sentences to get the features from the sentences. The last thing to do in this step is to iterate through all those extracted features and remove duplicates and clean the noise.
4. Automated Feature Matching - after having the features the similar features should be matched. Matching is decided based on binary text similarity function, which is on the sentence level.
4.
Methodology
In this chapter, overall methodology is presented. The first sub-section is about how I am generating the recommendations, what are the steps to analyze the apps and recommend them to users. I will be also discussing about the technologies which have been used for implementing ODARS. On top of those, the last sub-section will present the evaluation plan process.
4.1. Generating Recommendations
At the beginning, data collection will be discussed, how I am retrieving data and what limitations do I have. Then comes pre-processing subsection, how I am cleaning data.
4.1.1. Data Collection
Obtaining reviews and app details for any application which user desires was not really cumbersome. Since I am researching only on App Store applications, I used the library which is built on Apple's provided API called RSS feed [24]. The library is called App Store scraper, [3] which is able to retrieve the full detail of any application, list of any applications in the App Store collections, search for the app by the name, retrieve the reviews etc.
When asking for the details of the application, the request is expecting to receive the id, which is included in the URL of the application. e.g. the URL for messenger on the app store is:
https://itunes.apple.com/us/app/messenger/id454638411?mt=8
Here, id is 454638411. After having the id of the application you can request the full details of the app and the response will be:
{
"id": 454638411,
"appId": "com.facebook.Messenger",
"title": "Messenger",
"url": "https://itunes.apple.com/us/app/messenger/id454638411?mt=8&uo=4",
"description": "Instantly connect with the people ... ",
"icon" :"https://is5-ssl.mzstatic.com/image/thumb/Purple118/v4/9a/f4/4f/9af44ff9-3afe-f7b8-6879-ce0c0d3678f4/source/512x512bb.jpg", "genres": [ "Social Networking", "Productivity" ],
...
}
Similar to that we can search for the application with name, which will return a list of applications matching the search string with the app name. For that request the developer should set the limitation, how many items does he/she want to be returned in the response? The search algorithm does not include only comparing the titles, it has a deep searching algorithm, which checks the genres, description etc. When searching for 'fitness' the response looks like: [ { "id": 454638411, "appId": "com.facebook.Messenger", "title": "Messenger", ... }, { "id": 310633997, "appId": "net.whatsapp.WhatsApp", "title": "WhatsApp Messenger", ...
} ...
]
Next, one of the most interesting requests is reviews. The maximum number of the reviews that can be retrieved amounts 500. The current request is using pagination, meaning that each page contains 50 reviews. The maximum page number is 9, but paging starts from index 0, so, all in all, there are 10 pages. While requesting the reviews, the one should pass the page number, which will return the reviews on the exact page number. For my implementation, I am iterating from zero to nine, storing all reviews and then returning to the corresponding place to get 500 reviews at once.
On top of that, Apple provides predefined collections [24]: ● New apps we love
● New games we love ● Top free
● Top free iPad ● Top Grossing ● Top Grossing iPad ● Top iPad
One can search applications within those categories, the limitation here is that maximum number of apps returned from the API can be 200.
4.1.2. Preprocessing
Text preprocessing is done in almost same way as SAFE approach but with the slight differences. The input for this step is application reviews and description together. First, the reviews are tokenized into sentences. This step is essential because mostly reviews contain more than one sentence, but the sentiments should be done on the sentence level. Next, all sentences or words between the parentheses or brackets are removed. I follow the same idea that text inside the brackets or parentheses contains additional information [8] which is not vital for me, so skipping those sentences will not harm my study. After that, I am searching three types of sentences in already existing ones and they are sentences that contain URLs, email addresses and quotations. Those kind of sentences are referring either email addresses, some websites or quotations and most likely, there will not be any features mentioned. All sentences, which will match either of one category, are removed for further study. On top of that, all kinds of bullet points or symbols like # or * which refers some kind of list are removed as well.
After having the clean sentences I am searching for subordinate clauses and cutting them, because they are holding the information how the app is behaving and giving me the reasons for that [8]. Next step is to tokenize sentences into words, and the important thing here is not to change the order of the words. After having the words, stop words are removed, which are listed in the external document [2].
Figure 5: Main steps for the text preprocessing [8]
4.1.3. Feature Extraction
4.1.3.1. Extracting from Reviews and Description
As mentioned in above section my main resource is the SAFE approach, which me and my supervisor are trying to improve. If we look carefully, we will see that SAFE approach extracts features either from the description or from app reviews. But my idea is to extract features from both description and reviews but I will leave only features from reviews which are mentioned in the description.
Feature extraction starts when the user requests the features for the concrete application. Web App sends the request to API to get the features. At that moment, API will retrieve the description and the most recent 500 reviews from the app store and will pass them to app feature extraction scripts, and this is the exact moment when the feature extraction starts. First, I am trying to extract features from application description. In order to achieve that, first I am segmenting description into sentences. After having the sentences from the description, I am trying to clean them. Moreover all sentences which contain email addresses and URLs are removed. After that, all bullet points and symbols #,-, and * are replaced with an empty string. For the next step for text preprocessing I am removing all subordinate clauses, the words such as 'when', 'after', 'although', 'because', 'before', 'if', 'rather', 'since' etc.
which are thought to be used in subordinate clause. That kind of sentences will not give any information about the features. Instead, the clause is telling me how the app is behaving, which is not used for current study.
After having the clean sentences, the sentences are tokenized into words with the help of NLTK library for python. Completing this step gives me the array of words, the order of the words is the same as it was in the sentence. Next comes removing the stop words. I have manually listed all stop words [28] which should be excluded from the further study. I am iterating over all words in the sentences, if the word is listed in the stop word list I am removing it and then again joining the words to get the whole sentence.
For the next step the above generated sentences are used as the input. So here I am searching POS and sentence patterns.
● POS patterns – there are 18 pos patterns in SAFE approach [9]. Authors of the paper have researched the patterns by taking 100 application description and at first, manually extracted the features. Then they looked carefully and found out that the features mainly obey 18 patterns which are:
a) NOUN NOUN b) VERB NOUN c) ADJECTIVE NOUN
d) NOUN CONJUNCTION NOUN e) ADJECTIVE NOUN NOUN f) NOUN NOUN NOUN g) VERB PRONOUN NOUN h) VERB NOUN NOUN i) VERB ADJECTIVE NOUN j) ADJECTIVE ADJECTIVE NOUN k) NOUN PREPOSITION NOUN l) VERB DETERMINER NOUN
m) VERB NOUN PREPOSITION NOUN n) ADJECTIVE NOUN NOUN NOUN
o) ADJECTIVE CONJUNCTION ADJECTIVE p) VERB PREPOSITION ADJECTIVE NOUN q) VERB PRONOUN ADJECTIVE NOUN r) NOUN CONJUNCTION NOUN NOUN
● Sentence patterns – there are five sentence patterns which have the different structure than POS patterns but there are really high chance of feature existence. The first pattern is just the combination of two features with one conjunction 'and' e.g sentence "send image and messages" contain two features 'send image' and 'send
messages'. The second pattern is when the features are separated by the comma e.g
"send image, messages, songs". It contains three features which are 'send image', 'send messages', 'send songs'. The third pattern contains two conjunctions and four feature identifier e.g 'send and check messages and pictures'. Here we have four features 'send messages', 'send pictures', 'check messages', 'check pictures'. The Fourth pattern is a bit difficult to find but it contains two conjunctions and several feature identifiers e.g "Use chat details to check and edit last messages, calls, pictures and songs". At first, I am searching for two conjunctions. Then, I am taking right and left feature identifiers from the last conjunction ('and'), which will give me four feature identifiers 'songs', 'pictures', 'calls', 'last messages'. From the first conjunction, I am taking left and right sides as well and I will have 'check' and 'edit'. All those found words are combined one by one and have eight features are generated: 'edit songs', 'edit pictures', 'edit calls', 'edit last messages', 'check songs', 'check pictures', 'check calls', 'check last messages'. The fifth pattern also contains two conjunctions and list/enumeration of feature identifiers left side but feature identifier on the right side. So at first my approach will find the first conjunction and will take enumeration and feature identifier, it will do the same for the second conjunction and then it will merge everything together. e.g. sentence "Send, upload and edit videos, images and songs" will have features: 'send videos', 'send images', 'send songs', upload videos', 'upload images', 'upload songs', edit videos', edit images' and edit songs'.
After completing above mentioned steps the features from app description should be ready. In order to extract features from the reviews I am repeating exactly same steps for the reviews which also gives me set of features.
The whole preprocessing scripts and algorithms are the implementation of my supervisor. However, further implementation, which is for instance: Merging and Clustering, cleaning app features and identifying common features of two applications are fully implemented by me.
4.1.3.2. Merging
The input for the next step is two sets of features, one from app description another from the user reviews. I am trying to clean the features which are not relevant to the application at all. In order to achieve that, I am comparing how similar are the features extracted from reviews
to features extracted app description. I am taking threshold 0.80 if the feature from the review is similar more than 80% to one of the features from the description it will be used for the further study, otherwise, I am throwing it out. The similarity check is done by spacy library[10], which gives me the 300-dimensional vector for each word. I am calculating the average vector space for each feature and in order to compare two features to each other, the cosine between the two vectors are calculated, which measures how similar the vectors are. cosine = lambda v1, v2: np.dot(v1, v2) / (LA.norm(v1) * LA.norm(v2)) where v1 is the vector for the feature extracted from review and v2 is the vector for the feature extracted from the app description.
If the cosine is greater than 0.8 (80 percent), this is the default value of the threshold, I am leaving the feature for the further study. The above-mentioned can be changed by users on their preference. After I filter out false positive features, I am trying to merge similar features together; merged groups are called the clusters. For generating the cluster the same similarity formula is used with the vector spaces. The idea again is the identical, I am taking one feature and comparing to others if the threshold is greater than 0.8 I am considering that the features are semantically same but syntactically different, so they are merged into one cluster. The name of the cluster is the feature name, which has the largest frequency in the sentences, in other words, the feature that was mentioned most frequently in the review sentences.
4.1.4. Sentiment Analysis
Sentiment analysis is the process to use the natural language processing tools in order to identify, extract and quantify its subjectiveness and emotional states. For most cases the sentiment for the sentence can be positive, negative or neutral. I am heavily using the sentiment analysis to see what is the emotion behind the sentence which was taken from the user review.
Since ODARS shows the user's opinion and its sentiments, some analysis tool is required. Before starting the actual system(ODARS) implementation first, the proper sentiment analysis tool should have been found, after some investigation I found out two options: Senti4SD[22] and Stanford corenlp[23]. Since the decision which one to use should have been made objectively I did a small research. I took 100 random app reviews from the different category apps. The sentences were chosen wisely, meaning that each sentence
consisted of the feature and the opinion of the user about this feature. My supervisor and I manually estimated the sentiments of the sentences, and then we compared results against each other and resolved the differences. After having the final manual decisions, we analyzed same sentences with both tools and compared the tool results to our ones. It showed that Stanford core NLP tool had a bit higher percentage in predicting the sentiment. In this small research, I am depending on the author's opinions, because the sentiment results were compared to human results as mentioned above already.
The result is shown in Figure 6.
Figure 6 - The results of sentiment analysis comparison[29]
Resulting in, that the tool, which will be used in building current system for analysing sentiments, will be Stanford corenlp, which will definitely ease my work.
Since, the ODARS idea is to give the users recommendations on how the features were performing in concrete applications, I am making the sentiment analysis on the reviews to see what people have been thinking about those features. So at first, I am extracting features from the reviews, and if the user selects the feature, I am making the sentiment analysis on the sentences where this feature (or semantically same feature) has been mentioned. I am sending the requests to the Stanford core NLP server and analyzing sentences one by one. Whenever the server is done with analyzing, the results are sent back to API while API sends the results to the web application which on its own is drawing the charts and giving the user insight how the app was performing in the selected features.
4.2. Tool Development
The system consists of several components which together creates ODARS. The components are:
● Web application - The is the client application which is written with HTML/CSS, Javascript, jquery and bootstrap. In order to draw nice charts in the tool, I am heavily using chart.js1 3rd party library.
1 http://www.chartjs.org/
● API - web application is communicating only with the API, which is written in Node.js. API on its own is talking with app feature extraction scripts, App Store RSS Feed API and Stanford core NLP server.
● App feature extraction - the scripts are written in Python. Main purpose of the scripts is to extract features from the reviews, which are passed by API with the help of python-shell2 3rd party library. Whenever current component is done with extracting the features from the reviews it will send back the response to API.
● Stanford core NLP - the local server, which is built on JAVA, is running on local machine. The idea of the component is to receive the request to make the sentiment analysis on the sentence and give the answer back to caller.
4.3. Tool Evaluation
The main purpose of the study is to evaluate the developed tool ODARS, with regards to its usefulness and ease of use. To achieve my objective, I adopted TAM (Technology Acceptance Measurement), a widely used model that has been used in various previous studies to assess the usefulness and ease of use of tools. Usefulness is defined as “the degree to which a person believes that using a particular technology would enhance his or her job performance”. While perceived ease of use refers to “the degree to which a person believes that using a particular system would be free of effort.” [21][20]. The research questions that I
aim to answer are:
1. How useful are the tasks available in the tool?
2. How easy is it for the users to perform different tasks available in the tool? 3. How people are interested in using such a tool in the future?
4. Does the usefulness and ease of use factors has any correlation with the background or technical experience of the people?
Figure 7: Relationships of questionnaire parts to higher-level TAM constructs. [20]
To answer these research objectives, I prepared the questions, which were categorized into four groups: (1) Perceived Usefulness, (2) Ease of Use(3) Self-predicted future use (4) Prior subject experience.
Questions for “Perceived Usefulness” (U):
Usefulness (U1): Do you find the tool useful to know about the app features in which a selected mobile application performed well?
Strengths and weaknesses (U2): Do you think, the tool is helpful to analyze the strengths and weaknesses of two similar mobile applications in App Store?
Make decision (U3): Does the tool give enough information to make a decision while choosing an app for the download?
Questions for perceived “Ease of Use” (E):
Tasks are easy (E1): Do you think the tasks available in the tool are easy to use?
Enough instructions (E2): Does the tool provide enough instructions to finish the planned task?
Clear and understandable (E3): Do you think, the interaction with the tool is clear and understandable?
Remember steps (E4)s: Is it easy to remember the steps required to compare two similar mobile applications?
Charts understandable (E5): Are the charts summarising users’ sentiments on the app features understandable?
Questions for “Self-predicted future use” (S):
Future use (S1): Do you have plan to use this tool in the future before choosing a mobile application for download?
Questions for "Prior subject experience (PE)"
Regular use of smartphone (PE1): I regularly use any smartphone i.e., Android, iOS or Windows?
Downloading apps from store (PE2): I regularly download applications from App marketplaces like PlayStore or App Store.
Assessing apps (PE3): I assess the quality of a mobile application by looking at ratings or reading through the reviews before download it.
Using some tools (PE4): I use some tools or searching a bit before I choose the mobile application for download.
I am using Likert scale (except for Prior subject experience (PE)) that measures the questions with six-point scale like in [20]. Starting from 1, meaning extremely unlikely and ending with 6, meaning extremely likely. I am not using seven point scale to remove the ability to select the medium point. So, basically user has to express his/her tendency towards negative or positive side.
4.3.1. Study details
Location and schedule diversifies depending on the participants’ needs and time. Session lasts around 30-40 minutes, covering two use cases (single and multiple apps) which are discussed in details below. In the first session, I ask questions (Prior subject experience (PE)) to collect information related to user’s prior experience. The interview is recorded with iPhone 6s, iOS 11.3 separately for each participant. The aim of that interview is to clearly understand participants’ technical background and their experience. In the next session, users are given tool for interaction and have to assess its usage for two scenarios. The session is ended with the survey that ask questions related to Perceived Usefulness, Ease of Use and Self-predicted future use. The details of these two scenarios are given below:
4.3.2. Scenarios
Participants have to perform following two scenarios using my developed tool.
Scenario 1 - View summary of sentiments conveyed towards app features: the participant is curious about what the users are thinking about the different features offered in the app. Tasks need to be completed are:
1. Choose the category or directly search for the app.
2. Choose an application from the category if the category was selected in the previous step.
3. Choose the specific feature(s) on which you want to hear the users' opinion 4. Check the sentiment summaries and analysis.
Scenario 2 - Compare two similar apps based on sentiments conveyed towards their app features: The participant is searching for the application on AppStore and found two very similar apps and has to decide which one should be trusted, downloaded. Participant knows which functionalities are most important for him/her. Tasks need to be performed are:
1. Choose the category or select two applications from the search.
2. Choose the two similar applications from the category to compare if the category was selected in the previous step.
3. Select the specific feature(s) on which you want to compare applications and hear users' opinion.
4. Check the sentiments summary and analysis.
I am using MacBook Pro, 2015 15 inches, mid-2015. OSX 10.12.16 High Sierra, Firefox 58.0.1 (64 bit). Overall, nineteen participants, who come from various countries, are interviewed and I selected master and bachelor students from different programs, mainly: Technical - Computer science and all related programs.
Mid-technical - Technical programs (not clearly related to Computer Science, like MBA) Non-technical - Non-technical programs, like MA, IR etc.
5.
ODARS Implementation
The section provides the detailed information about all parts of the system, which together creates ODARS. The first subsection represents the web application, which is running on the client side. While the second subsection explains the API written in Node.js, API establishes the connection between web application, app feature extraction scripts, AppStore and sentiment analysis tool. On top of those, the last sub-section represents the Stanford CoreNLP server - the sentiment analysis tool.
5.1. Web Application UI
Besides the research done for the sentiment tools, one of the main experiments is the tool, which demonstrates and implements my idea, algorithms and improvements of SAFE approach. The whole system consists of a web application, which is written with HTML/CSS, javascript, jquery + Bootstrap, node.js API, app feature extraction scripts; written with Python and I am running sentiment analysis server locally as well. There are three pages in the web application:
● Applications page ● Features page ● Sentiments page
All of them are described in details in below subchapters. 5.1.1. Applications Page
On the very first page, the user has to select single or two applications, depending on the use case. If the user is interested in comparing two competitive apps he/she should select two apps, in another case - only one. The selection can be done in several ways.
1. Searching by name - user sees the search bar where he/she can search the apps by the name. However, the search algorithm is not that simple, searched string can appear in the description, or in bundle identifier, or in genre etc. Whenever user stops writing, tool shows five best-fit applications. Figure 8 represents how the searching by the name can be accomplished in the tool.
Figure 8: Searching the application by name
Moreover, whenever user clicks the checkbox the application is selected. Figure 9 shows how user can select the app.
Figure 9: Selecting application
2. Selecting category - users can select the category to search the applications. The categories are:
○ New apps ios ○ New games ios ○ Top free ios
○ Top free games ios ○ Top grossing ios ○ Top paid ios ○ Top paid games ios
Figure 10: Selecting application category
After selecting the category user will be redirected to the second page where he/she should select the application or applications (again depending on the use case). On this page, I am showing top two hundred applications which are under the chosen category. Figure 8 shows top two hundred application under the category "Top free ios".
Figure 11: Showing top 200 applications from category "top free ios"
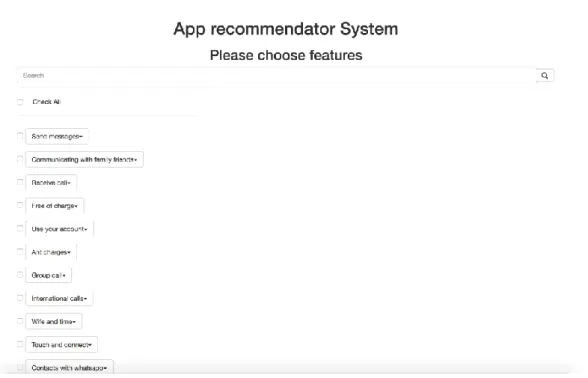
5.1.2. App Features Page
The next page, which is called "App Features page", represents the features extracted from the application. For use case one, where the user is selecting only one application, I am
showing all features, which were mentioned by users in the reviews and, as discussed in the previous chapter, filtering them out with description. Here, the user has to select features, which he/she is interested in to analyze and see what other people are thinking about them. Figure 12 represents the example of all features for WhatsApp Messenger.
Figure 12: Features for WhatsApp Messenger
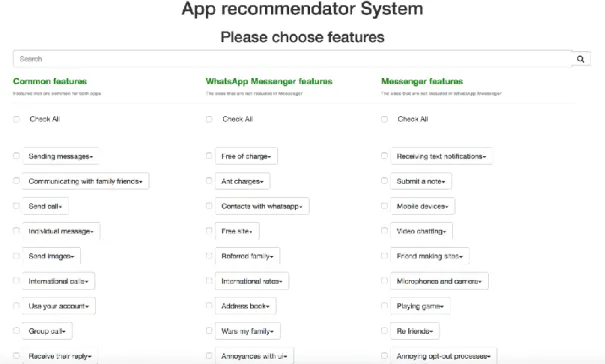
Users can filter features by name, or click "Check All" checkbox to select all features. For use case two, when the user has selected two applications to compare, the page looks slightly different. Here, common features, which are shared between two applications, and uncommon features for both applications are shown. Overall, there are three columns of features consisting of:
● Common features
● Uncommon features which are mentioned only in the first app ● Uncommon features which are mentioned only in the second app
In Figure 13, two competitive applications: Messenger and WhatsApp Messenger are compared.
Figure 13: Features for Messenger and WhatsApp Messenger
In figure 14, I am setting the threshold for the description and features to be 75%. Below of the features, two progress bars (sliders), which are used to change thresholds, are provided. As mentioned in the methodology chapter, after extracting features from reviews, I am filtering them out by the app description. Let's say after analyzing the reviews and extracting features from them we have the array of features. Then after analyzing the application description, we have the array of features as well. Filtering starts after those two steps are completed, one feature from the reviews is taken and I am comparing one by one to the features extracted from the description how similar they are. The similarity is calculated by the formula:
np.dot(v1, v2) / (LA.norm(v1) * LA.norm(v2))
Here, v1 and v2 are the vector spaces of the feature clusters, which is the 300-dimensional matrix and represents the semantic value of the words in the feature. The formula returns the values from 0 to 1.0, which can be represented as the percentage. The higher number is, more similar two words or expressions are. Therefore, the first slider, called as 'description slider', increases the threshold how similar the feature extracted from reviews should be to feature extracted from a description. If the number returned from the formula is less than the threshold, I am not considering them to include in features.
The second slider changes threshold as well, but in that case, it changes the threshold for the features. As mentioned in the methodology part, after extracting the features from reviews I am grouping them in one cluster. If the features are similar to each other, they are grouped together. So let's say, after analyzing all reviews we got the array of the features. Then I am iterating over them and checking one by one if two features are similar. The similarity is calculated by the same formula:
np.dot(v1, v2) / (LA.norm(v1) * LA.norm(v2))
And again, it returns the same scale, starting from 0.0 to 1.0 which can be represented as a percentage. So, if the number returned from the formula is greater than the threshold, I am considering them to be equal and clustering them together.
Figure 14: Thresholds for description and feature clusters
5.1.3. Sentiments Page
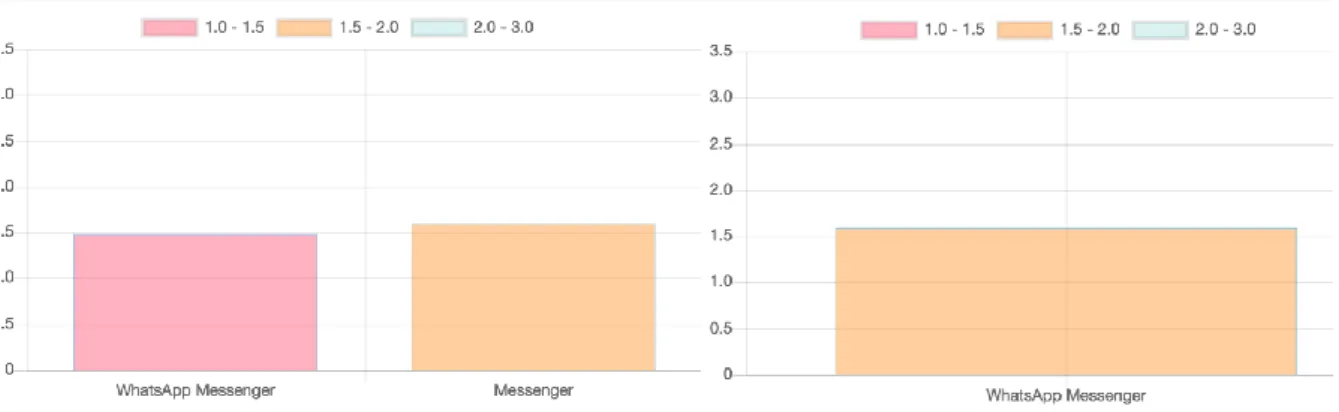
The last page is a place where the user should see all analyses, results and get the bunch of information about the features of apps. The sentiments page consists of several charts, very first one is an average sentiment score chart, which shows the average score from those features, which were selected by the user on the features page. For use case one, it will show only one bar, but for use case two it will compare average sentiment scores for two applications like it is in Figure 15.
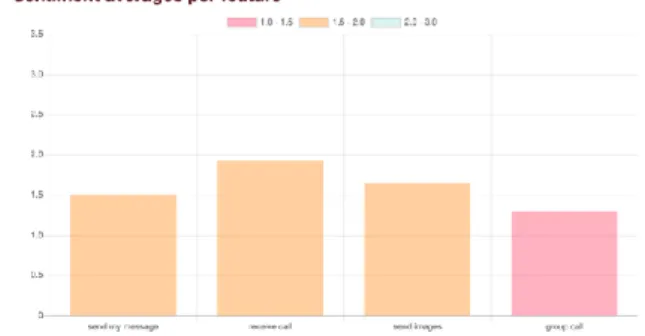
The second chart shows sentiment averages for the features. For the second use case, two bars for each feature are shown, which represent the sentiments scores for two applications for a different feature. While for the first use case, I am showing one bar per feature, representing the average sentiment score for the corresponding feature.
In Figure 16, the left chart shows two competitive apps’ (WhatsApp Messenger and Messenger) comparison with five features: sending messages, send call, individual messages, send images, group call. In addition, there are two bars per feature, representing different apps. While on the right side the features for only WhatsApp Messenger are presented: send my messages, receive the call, send images, group call.
Figure 16: Chart showing sentiment scores per feature
Apart from the general charts, which give us a look how the app or apps performed in selected features, I provide more details to the user. It includes digging into details for each feature, such as checking the sentences where the particular feature was mentioned. Under the main charts user has the ability to expand the details of the feature where he/she will see several things, like:
● Separate chart for sentiment average for the particular feature - Figure 17 shows the details for both use cases. On the left side, there is a chart representing the details for the feature "Sending messages" for two competitive applications: Messenger and WhatsApp Messenger. While on the right side I have the details for the feature "Send my message" for the single app: WhatsApp messenger.
Figure 17: Details of the concrete feature
● Sentences chart for the feature - this chart shows all sentences with their sentiment scores where the particular feature was mentioned. This is the lowest level where I am starting to calculate overall sentiment score for the app, because feature average score is calculated by summing up all sentences’ sentiment scores and dividing it by the number of sentences. After having the scores for all features, they are summed up and divided by the number of features the user has selected. This gives me the average sentiment score of the application based on the selected features. The figure 15 shows how the sentence chart looks like. In the chart Y label is the sentiment score, which is always between 1.0 - 3.0. The scale is divided into three categories:
○ From 1.0 - 1.5 is negative ○ From 1.5 - 2.0 is neutral ○ From 2.0 - 3.0 is positive.
X label represents the sentences and hovering over the bar will show the sentence itself.
Figure 18: Sentence chart for WhatsApp Messenger, feature: "Send my message"
Full source of the Web APP can be found in source version control system – GitHub [27].
5.2. Node.js API
The main purpose of the API is to parse App Store and get all collections, which are: ○ New apps we love
○ New games we love ○ Top free
○ Top free iPad ○ Top Grossing ○ Top Grossing iPad ○ Top iPad
Moreover, it can get all applications for the specific category, reviews for a specific application and all details about the concrete app. I am using App Store scraper [3] library, which is built on Apple's RSS Feed API.[24] On top of that, API will call app feature extraction scripts for feature extraction, the scripts are written in Python. This is the most important part because the scripts are demonstrating my improvements. The communication between the Node.js and Python scripts is established by the python-shell library, which is
responsible for sending the data to Python scripts and returning the response to Node.js server.
Web app involves two use cases. The first use case is when the user is interested in one application's features and want to see how the app is performing in selected features.
The second use case is when the user is interested in comparing two competitive applications, he/she wants to know which application is better in which feature.
The flow looks like that: for single app use case web app will ask API to give all features for the concrete app, API on its own will retrieve most recent 500 reviews from App Store and passes them to Python scripts. During the review analysis, scripts are trying to extract features from the reviews, cluster them. After all processes are done, it will send the response back to API. When the API receives the answer from scripts, it will send the features to the web app to draw for the user.
For competitive app use case, the web app is asking the API to give common and uncommon features for two applications. API will retrieve reviews for both applications and then will pass one by one to the scripts. When the scripts analyze first 500 reviews for the first app, it will receive the second 500 from API and it tries to analyze again and after all processes are done, it will give the response back to API. When API receives both app features, it will start to analyze and find common features between two app features.
Each feature is represented as a general cluster, which on its own contains elements(inner features). They are basically the same but represented with different words e.g. cluster name can be 'take picture' but inside it contains 'take photo', 'capture picture' etc. Each cluster contains the vector space, generated by spacy.io library. [10] The library generates the unique vectors for unique words, but if the words are semantically close the vectors are similar. Since the cluster contains several features the vector is calculated by taking the mean of all inner feature vectors. In addition, the inner feature vector space is calculated by taking the mean of all word vector spaces inside the feature. e.g. if we have inner feature 'capture image' I will take the mean of the vectors from 'capture' vector space and 'image' vector space. After having multiple applications' feature clusters and their vectors I am searching for the common features based on how similar the cluster vector spaces are. The similarity is calculated by the formula:
The formula returns the value from 0.0 to 1.0. If we multiply the result to 100 we will get the percentage how two clusters are similar to each other.
Full source of the API can be found on source version control system - GitHub [26].
5.3. Stanford Core NLP
This is the natural language processing server written in Java. The server is used in a web application in order to get sentiments for the sentences that have been used to extract features from. Stanford core NLP provides various text processing tools like word relations in the sentence, identify the part of the speeches in the sentence and lots of really useful ones. However, for my study, I am using only sentiments tool, which receives the sentence(s) and returns the structure of the sentence(s), plus the scale for sentiment score starting from 1 to 3.
● 1 - Negative ● 2 - Neutral ● 3 - Positive
The flow of the system is that first web app calls the methods of Node.js API to get the feature, API scraps the AppStore and calling feature extraction scripts to get features. After receiving the answer from the feature extraction scripts API is calling the Stanford core NLP server requests to get the sentiments for the sentences where the selected features were mentioned.
6.
Evaluation
6.1. Survey Based Study for Usefulness and Usability
6.1.1. Execution of Evaluation
Overall, 19 students have been interviewed. They were from different countries like USA, Turkey, Iran, Georgia and Armenia. The number of students in each category is presented in table 1.
Technical Mid-technical Non-technical
Students with ID: 4,5,6,15,16,17,19
Students with ID: 1,2,9,11,15
Students with ID: 3,7,8,10,12,14,18
Table 1: Participants in the categories
The participation was totally voluntary, students' data is 100% anonymised and I guarantee them full privacy. I gathered all data and analysed it when all of the nineteen students were interviewed. The analysed data gave me the weak points of the tool and the ideas how I can improve the performance.
The idea of categorising participants is to get the information from different kind of people having different technical backgrounds and experience. Since full privacy is guaranteed for the participants, they were assigned the ID's and I have been using it for identification students. The schedule of the interviews is shown in Appendix section.
Since the plan was to have moderate in-person type usability test all remarks and problems have been noted and recorded by me. Most of the feedback came from the sentiments page where people had difficulties to understand charts and see analyses properly. The results and the feedback from the participants allowed me to think that the charts can be problematic for the non-technical people because lack of previous experience in mathematics. Although overall results of the interview were promising.
I calculated the average scores for each category for prior experience. Seems that each category has its strengths and weaknesses. It was not surprising that people from all category are using smartphones regularly, but technical people are downloading the apps more often than the others. Moreover, they are assessing the apps with huge curiosity by ratings and reviews. PE4 gives me information if the participants are using any tool or reading anything
about the app before downloading. Seems it is not really relevant for technical and non-technical categories while it seems important for participants from the mid-non-technical category. Figure 20 shows the calculated average for each question in each category.
Figure 20: Results for prior experience
Next, I calculated overall scores for the prior experience, which again showed me that participants are actively using the smartphones, Android, iOS or windows phone (PE1). On top of that, they are reading reviews and looking at ratings carefully before downloading the application (PE3) which is essential for my study as well. The lowest assessment has the last question - PE4. Still, the average result is on "likely" side, which is fine as well. All this data gives me the possibility to think that the participants were chosen correctly.
6.1.2. Results for "Usefulness" and "Ease of Use"
The second survey gave me information how useful the tool was, how easy it was to use and tells me if the participants are interested in the tool to use in future. We see that none of the averages of the questions is below 3.0, which means that the results from the participants were mostly positive. The tool seems to be useful for participants; the sum of the average of usefulness questions is 15.26 from 18, which is around 85%.
As for ease of use the sum of the average is 21.52 out of 30 which is around 72%. Question E2, which was about the instructions provided by the tool, got the lowest result - 3.74. It can be deducted that it was a bit difficult for the users to navigate in the tool. This fact is proved as well with the notes from the participants, who had the problems understanding how to navigate to the next page. Moreover, most of the participants could not see how to open the details of the feature on sentiments page. They were clicking on the wrong button or link. Figure 21 shows the results of the questions in each group.
![Figure 2: scores of the top ten features from the ranking model [7]](https://thumb-us.123doks.com/thumbv2/123dok_us/11053168.2992345/12.892.156.467.140.437/figure-scores-features-ranking-model.webp)
![Figure 3: Overall overview of the processes [2]](https://thumb-us.123doks.com/thumbv2/123dok_us/11053168.2992345/15.892.148.793.158.361/figure-overall-overview-processes.webp)
![Figure 4 - 18 patterns for feature extraction [9]](https://thumb-us.123doks.com/thumbv2/123dok_us/11053168.2992345/16.892.138.669.640.1026/figure-patterns-feature-extraction.webp)
![Figure 5: Main steps for the text preprocessing [8]](https://thumb-us.123doks.com/thumbv2/123dok_us/11053168.2992345/21.892.139.340.130.534/figure-main-steps-text-preprocessing.webp)
![Figure 6 - The results of sentiment analysis comparison[29]](https://thumb-us.123doks.com/thumbv2/123dok_us/11053168.2992345/25.892.140.603.401.480/figure-results-sentiment-analysis-comparison.webp)
![Figure 7: Relationships of questionnaire parts to higher-level TAM constructs. [20]](https://thumb-us.123doks.com/thumbv2/123dok_us/11053168.2992345/27.892.273.670.133.409/figure-relationships-questionnaire-parts-higher-level-tam-constructs.webp)