Using Discriminant Analysis to Verify the Clustering of
Self-Organizing Map
Suwardi Annas
Study Program of Statistics, Department of Mathematics, Faculty of Mathematics and Science, State University of Makassar, Jl. Dg. Tata Makassar, 90224, Indonesia
Email: [email protected]
ABSTRACT
The data models according to the hot spots spreading in Indonesian forests are usually available with the large of feature space and heterogeneous of distribution patterns. The complexities of this hot spot data structure are central to the present analysis. Clustering of the hot spot regions that persist over time are good indicators of fire risk problems. Therefore, the self-organizing map (SOM) was implemented for clustering hot spot regions. This method is a nonlinear statistical technique that can be used for solving data problems that involved classification and information visualization. The finding of study shows that SOM has provided a classification of hot spot via regions into some different clusters. However, a specification of the cluster is needed when the SOM nodes does not clearly reveal the borders of cluster. Under these circumstances, a supervised learning of discriminant analysis (DA) is used to validate the SOM clusters. The main purpose of DA is to predict cluster membership according to a given prior cluster information, through distance measures and distinct coloring of the nodes in the SOM. DA gave highly accurate cluster discrimination, which shows that this method can be a useful tool to verify the SOM clustering. The combination of the proposed methods is a reliable means of classifying and visualizing of the data, and enables interpretation of the disparities of fire risk by regions in forest on the basis of the hot spot data.
Keywords: Cluster validation, complex data, nonlinear method, supervised learning Mathematics Subject Classification:62P20
1. INTRODUCTION
The data structure compiled based on the hot spot occurrences in Indonesian forests is usually available with large space features and heterogeneous of distribution patterns. The dimensionality reduction and visualization techniques, such as PCA and SOM, have been applied to explore the complexity of hot spot dataset (Annas et al., 2007). The findings of study reported that SOM was better suited than PCA in visualizing the structure of data clusters. This result supported other study by Hausfeld et al. (2014) that the classifications performance was similar between a supervised variant of SOM and other decoding algorithms; however, the ability to visualize decoding models and underlying data topology of SOM promotes a more comprehensive understanding of classification outcomes.
Copyright © 2015 by CESER PUBLICATIONS
The use of SOM in visualizing the clusters data structure does have certain drawbacks, however. Although SOM can be used to visualize clusters, sometime it is required further specification of SOM clusters (Kohonen, 1998). Moreover, SOM can only provide relative relationships among data points, which makes distinguishing the distributions of inter-clusters from extra-clusters difficult (Yin, 2001). Therefore, a specific method to give good performances for unit clusters is still required to effectively utilize the information provided by SOM clusters.
There are several approaches to overcome the deficiencies of SOM clustering. Vesanto and Alhoniemi (2000) have implemented both agglomerative and partitive (k-means) clustering algorithm to cluster output from SOM. Further, Kiang (2001) has included a contiguity-constrained clustering method to perform clustering based on the map of the SOM output. The current study found that the combination of SOM and the contiguity-constrained clustering method produced clustering results that are comparable with that of other clustering methods.
The present study proposes the use of a supervised learning of DA to resolve the clustering problem of SOM. DA is a good option for identifying boundaries between clusters of objects when representative objects from the clusters are available (Siswadi and Suharjo, 1998). In this study, the original dataset is first classified into some clusters using a combination of the distance measure and color-coding of SOM to develop prior clusters of hot spot to their regions. Since the distance measure and discoloration are not clear to reveal the border of clusters, a DA algorithm is further implemented to clarify a frontier region between clusters. The main goal of DA here is to minimize the within-class and maximize the between-class distance simultaneously, thus achieving clearly the borders of SOM clusters.
2. MATERIALS AND METHODS
2.1. Data description
In implementing the proposed methods, the hot spots responsible for fire risk in many regions of Indonesian forest are central to the present analysis. The acquiring of the data is supported by the Indonesian State Ministry of Environment (ISME) Bureau as part of forest fire monitoring in Indonesia. The hot spots data are gathered from the totally of 72 regions of Sumateran forests. The input variables are based on the average of hot spots occurrences in the period 2000-2003. Therefore, the datasets are compiled based on the 4-dimensional input variables on annual basis.
2.2. SOM Clustering
The Self-Organizing Map (SOM) is a popular of neural network suitable for unsupervised learning and data visualization (Kohonen, 1998; Heskes, 2001). It is an artificial neural network method, which can transform an n-dimensional input vector into a one- or two-dimensional discrete map (Heikkinen et al., 2011). The structure of the SOM network consists of an input layer, containing a set of observation vectors
x
i[
x
1,
x
2,...,
x
n]
T
n,
and a competitive array layer of nodei
(Yamakawa et al., 2001). The connection between the two layers are associated by the model’s vectorm
i[
m
i1,
m
i2,...,
m
in]
n,
).
,...,
2
,
1
(
i
N
This network represents a map of real high-dimensional data onto a low-dimensional (usually 2-D) display of nodes.In the SOM algorithm, the best-matching node (winning node) is found using the criterion of greater similarity,
^
i`
ic
x
m
m
x
min
The weights of the winner node care then updated in accordance with the rule,
>
(
)
(
)
@
)
(
)
(
)
1
(
t
it
h
cit
t
it
im
x
m
m
where
t
indicates the iteration,x
(
t
)
is the input supplied in random form at the iterationt
.
Here, the)
(
t
h
ci is the neighborhood function around the winning node c (Barbalho et al., 2001). During training,h
ci(
t
)
is a decreasing function of the distance between the i-th and c-th model on the map node. For convergence, it is necessary thath
ci(
t
)
o
0
whent
o
f
.
More detail of the SOM algorithm can be found in the Kohonen (2001). For training the datasets to this SOM algorithm, the MATLAB software with SOM toolbox was utilized.In this study, the SOM algorithm is implemented for hot spot data clustering such as a Unified distance matrix (U-matrix), Component Planes (CP), and color coding. U-matrix represents the distance between neighboring nodes on the SOM map, and thus indicates a frontier region between clusters. Whereas, CP visualization enables to realize emerging patterns of hot spot data distribution on the grid nodes and obtain the correlations between the input variables. Both U-matrix and CP can be simultaneously used to create an understanding of which variables are respect to the clusters. SOM color-coding is also added for creating cluster information on the map. Here, color-code assigns the nodes according to the cluster structure. Clusters that are relatively more homogeneous will be more uniformly colored, while the areas of the map that do not correspond to clusters will be more heterogeneously colored. Although the SOM color-coding routine assigns the nodes, a difficult task is how a frontier region between clusters could be clarified when the discoloration is unclear to reveal the border of clusters. In this context, the color-coding and distance measure of SOM may be appropriate as a pre-clustering for other clustering method. Therefore, for prior cluster information, through distance measure and distinct coloring of the SOM nodes, a supervised learning of DA is implemented to verify the membership of the SOM clusters, as discussed in the next section.
2.3. Clusters validation using DA
The procedure for clarifying the SOM clusters are started to identify the clusters that comprehend the cluster of nodes. The current clusters determined from the SOM output are used to develop cclusters of region of the hot spot from N forest regions (sample). The structure of inputs is compiled by supposing a data set of x [x1,x2,...,xN],as the data vectors of the sample clusters that contain m-dimensional input space. The set of data vectors above is then implemented to the DA algorithm. This method generates a set of discrimination functionf(x) ijTx, which projects the input into the
classification space based on optimization of cluster discrimination. In DA process, the within-cluster covariance matrices
(
S
w)
and the between-cluster covariance matrices(
S
b)
are computed as:T i ij c i n j ij i w i
n
(
)
(
)
1
1 1x
x
x
x
S
¦¦
and i T c i i b(
)
(
)
1x
x
x
x
S
¦
where
n
i is the sample number of clusteri
,x
ij is thej
th
sample of clusteri
,x
i is the mean value of clusteri
,x
is the overall mean value, respectively. A common optimization in DA is given byij
S
ij
ij
S
ij
ij
ij T w b Tmax
arg
ˆ
An optimal of discriminant projection is equivalent to finding the eigenvector corresponding to the nonzero eigen values
(
O
z
0
)
of the generalized eigen values problem, such that:ij
S
ij
S
bO
wThis occurs when
(
S
bO
S
w)
ij
0
.
Thus, discriminant analysis reduces to finding the eigen values and eigenvectors of on the matrixS
w1S
b, ifS
w is non singular. It is well known (Ye, 2005) that there arec
1
eigenvectors corresponding to nonzero eigen values, wherec
is the number of clusters in the data, because the rank of the matrixS
b is bounded byc
1
. Details to solve eigen-decomposition problem can be found in (Johnson and Wichern, 1998).
3. RESULTS
3.1. Visualization of SOM clustering
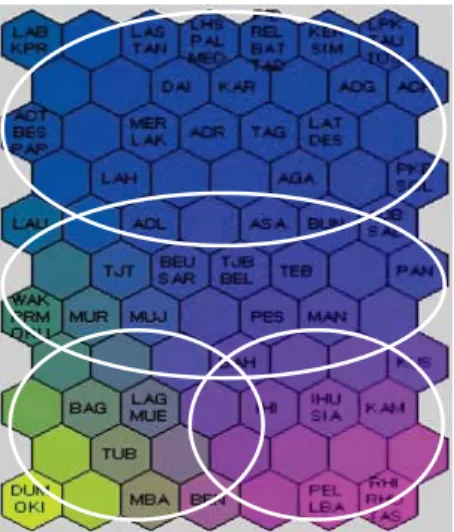
Distance measure and color-code from the SOM were used to visualize the cluster of hot spot regions. The regions of forest were also labeled on the grid nodes to investigate their position in the clusters. The prior clusters of hot spot regions that is constructed by the SOM clustering in the Sumateran forests are shown in Fig. 1. The circles on the map contained the labels of region with similar hot spot occurrences have also similar colors on the gird node and close to each other, thus indicate a cluster. Different levels of hot spot occurrences were assigned different colors and suited far to each other. However, some regions are difficult to assign in a certain cluster. The following section describes how to verify the memberships of the SOM clusters.
3.2. Verifying the SOM clusters by DA
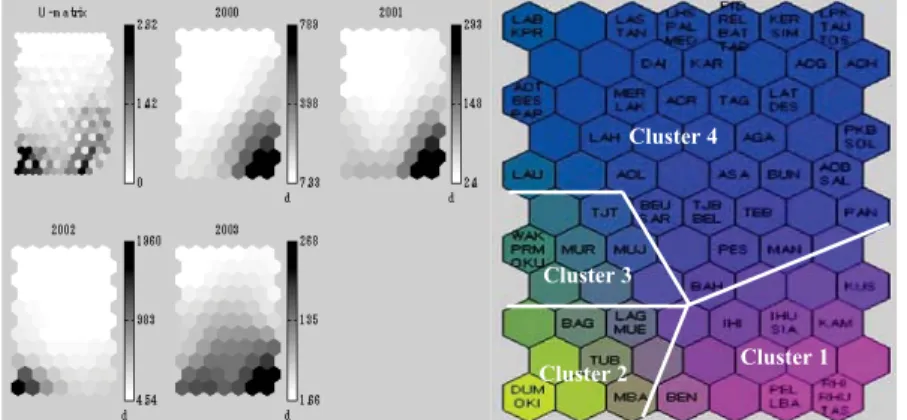
There remains a challenge in fitting clusters because the distance measure and color-coding of SOM cannot accurately locate certain hot spot regions to clusters. To overcome this problem, the membership in clusters are first manually specified using varying numbers of SOM clusters, according to the closest distance of nodes and the similarity of coloring. Given the prior cluster information provided by the SOM, DA is implemented to validate the clusters. During data training, DA maximizes the variance between clusters and minimizes the variance within clusters. The results of DA developed cluster membership for the hot spot regions and found four clusters in Sumateran forests, as shown in Fig. 2(b). The cluster borders were assigned using the lines on the SOM map. Here, the SOM maps were performed by the hexagonal nodes with sizes 11×7, to situate the 72 regions in Sumateran forests.
Figure 2.SOM cluster visualization of the hot spot regions: (a) U-matrix and four-CPs; (b) Four clusters validated by DA
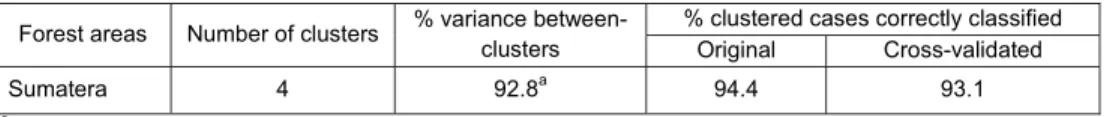
Table 1 shows the predicted cluster membership that is resulted by the DA validation to the SOM output from the nodes map in Fig. 2(b). The results indicated that in Sumateran forest, the highest percentage of misclassification (28.6%) occurs in Cluster 2, followed inCluster 3 (16.7%), and in Cluster 4 (4.2%). However, DA in table 2 allowed validation of these clusters, with 94.4% of the original and 93.1% of the cross-validated cases classified correctly. In cross-validation, each case is classified by the functions derived from all other cases. Wilks’ Lambda test for Discriminant Function explained 92.8% of the variance between clusters. These results indicate that although it occurs some misclassification of regions, DA has validated the SOM clusters, which maximizes the variance between clusters. The combination of both SOM and DA therefore provided a reliable classification pattern for hot spot in forest regions.
Table 1:Predicted clusters membership from the SOM clustering that is constructed by DA.
Clusters Predicted cluster membership Total n(%)
Correct classifiedn(%) Misclassificationn(%)
1 11(100) 0(0.00) 11(100)
2 5(71.4) 2(28.6) 7(100)
3 5(83.3) 1(16.7) 6(100)
4 46(95.8) 2(4.20) 48(100)
n: the number of forest regions in the cluster
Cluster 3
Cluster 2 Cluster 4
Table 2:The accuracy of the SOM clusters by DA validation Forest areas Number of clusters % variance
between-clusters
% clustered cases correctly classified Original Cross-validated
Sumatera 4 92.8a 94.4 93.1
a
Wilks’ Lambda test of function(s) 1 through 2 is 7.2%
3.3. Interpretation of clusters
The level of hot spots occurrence in each forest region cluster can be interpreted by investigating the possible correlation of the maps between the map of SOM visual inspection in Fig. 2(a) with the SOM clusters in Fig. 2(b). In the map of SOM visual inspection, U-matrix represents the cluster information and CP represents the data distribution of each variable (i.e. year). The color-bar values to the right of each CP provide an understanding of the contribution of each parameter to the cluster structure. The pairs of Figs. 2(a) and 2(b) are both useful to interpret the level of hot spots in forest, according to their cluster regions in terms of years.
Furthermore, the map of Sumatera in Fig. 2(b) shows that the forest regions in Cluster 1correspond to the positions of adjacent nodes with darker shades (high hot spot level) on the CPs in Fig. 2(a) for years 2000, 2001, and 2003. The regions in Cluster 2 correspond to a high hot spot level for year 2002, the regions in Cluster 3correspond to the gray shades (moderate hot spot level) for year 2003, and the regions in Cluster 4 correspond to lighter shades (low hot spot level) for all years.
4. DISCUSSION AND CONCLUSION
The combination of both SOM and DA therefore provided a reliable classification pattern for hot spot in forest regions. These results indicate that although it occurs some misclassification of regions, DA has validated the SOM clusters, which maximizes the variance between clusters. Although these hot spot cluster regions do not reflect all the real and the intensity of the fires and the size of a burned area, they have provided a good indicator of the presence of fire risk in the forest regions. The findings of this study enable interpretation of the potential fire risk by regions in forest on the basis of hot spot occurrences. It can be interpreted by investigating the possible correlation between the maps of SOM visual inspection in Figs. 2(a) with the SOM clusters in Figs. 2(b). The pairs of Figs. 2(a) and 2(b) are both useful to interpret the level of fire risk in forests, according to the cluster regions of hot spot in terms of years.
The SOM algorithm and DA have been applied to classify fire risk in forest regions based on hot spot datasets. In the present study, specification of the clusters is still needed when SOM cluster is not clearly indicated at the cluster borders. A supervised learning of DA was successfully used for validation the cluster membership of the SOM map. After cluster validation, it has the potential to better understanding of interpreting fire risk by region in forests. The combinations of the proposed methods have yielded a reliable performance in clustering and visualizing the structure of data. The challenge of further work will be to utilize this hot spot clustering for forest fires prevention activities.
5. ACKNOWLEDGEMENT
The authors thank the Indonesian State Ministry of Environment Bureau for assistance on the data for hot spots of forest fires.
6. REFERENCES
Annas, S., Kanai, T., Koyama, S., 2007, Principal component analysis and self-organizing map for visualizing and classifying fire risk in Indonesian forest. Agricultural Information Research16(2), 44-51.
Barbalho, J.M., Neto, A.D.D., Costa, J.A.F., Neto, M.L.A., 2001, Hierarchical SOM applied to image compression. IEEE,442-447.
Hausfeld, L., Valente, G., Formisano, E., 2014, Multiclass fMRI data decoding and visualization using supervised self-organizing maps.NeuroImage96,54–66.
Heikkinen, M., Poutiainen, H., Liukkonen, M., Heikkinen, T., Hiltunen, Y., 2011, Subtraction analysis based on self-organizing maps for an industrial wastewater treatment process. Mathematics and Computers in Simulation82,450–459.
Heskes, T., 2001, Self-organizing maps, vector quantization, and mixture modeling. Journal of IEEE Transactions on Neural Networks12(6),1299-1305.
Johnson, R. A., Wichern, D.W., 1998. Applied multivariate statistical analysis.International Edition, 4, United States of America,Prentice-Hall.
Kohonen, T., 1998, Self-organizing map. Neurocomputing 21, 1-6.
Kohonen T., 2001,Self-organizing maps.3rd ed. Berlin Heidelberg, Springer-Verlag.
Kiang, M. Y., 2001, Extending the Kohonen self-organizing map networks for clustering analysis.
Computational Statistics and Data Analysis38,161-180.
Siswadi, Suharjo, B., 1998, Exploratory Analysis of Multivariate Data. Department of Mathematics, Faculty of Mathematics and Natural Science, Bogor Agriculture University, Bogor.
Vesanto, J., Alhoniemi, E., 2000, Clustering of the self-organizing map. IEEE Transactions on Neural Network 11,586-600.
Yamakawa, T., Hario, K., Kubota, R., 2001, A SOM association network. In Allinson N, Yin H, Allinson L, Slack J, (eds). Advances in Self-Organising Maps,London: Springer-Verlag In Advances in Self-organizing Maps,London, Springer-Verlag, 15-20.
Ye, J., 2005, Characterization of a family of algorithm for generalized discriminant analysis on under sampled problems. Journal of Machine Learning Research6, 483-502.
Yin. H., 2001, Visualisation Induced SOM (ViSOM). In Allinson N, Yin H, Allinson L, Slack J, (eds).