FULL-LENGTH ARTICLE
A survey of data mining and social network analysis
based anomaly detection techniques
Ravneet Kaur
*, Sarbjeet Singh
University Institute of Engineering and Technology, Panjab University, Chandigarh, UT, India Received 20 February 2015; revised 26 October 2015; accepted 13 November 2015
Available online 28 December 2015
KEYWORDS Anomaly detection; Online social networks; Social network analysis; Data mining;
Graph based anomaly detection
Abstract With the increasing trend of online social networks in different domains, social network analysis has recently become the center of research. Online Social Networks (OSNs) have fetched the interest of researchers for their analysis of usage as well as detection of abnormal activities. Anomalous activities in social networks represent unusual and illegal activities exhibiting different behaviors than others present in the same structure. This paper discusses different types of anoma-lies and their novel categorization based on various characteristics. A review of number of tech-niques for preventing and detecting anomalies along with underlying assumptions and reasons for the presence of such anomalies is covered in this paper. The paper presents a review of number of data mining approaches used to detect anomalies. A special reference is made to the analysis of social network centric anomaly detection techniques which are broadly classified as behavior based, structure based and spectral based. Each one of this classification further incorporates number of techniques which are discussed in the paper. The paper has been concluded with different future directions and areas of research that could be addressed and worked upon.
Ó2015 Production and hosting by Elsevier B.V. on behalf of Faculty of Computers and Information, Cairo University. This is an open access article under the CC BY-NC-ND license (http://creativecommons. org/licenses/by-nc-nd/4.0/).
1. Introduction
Online Social Networks (OSNs) have gained much attention in recent years in terms of their analysis for usage as well as detec-tion of abnormal activities. The term has been defined
differ-ently by different authors. Like, Schneider et al.[1]formally defined OSN as ‘‘OSNs form online communities among peo-ple with common interests, activities, backgrounds, and friend-ships. Most OSNs are Web-based and allow users to upload profiles (text, images, and videos) and interact with others in numerous ways”. Adamic and Adar[2] used the term social networking instead of Online social networks and defined it as ‘‘Social networking services gather information on users’ social contacts, construct a large interconnected social net-work, and reveal to users how they are connected to others in the network”. Regardless of the terminology used for defin-ing it, social networks have become a communication platform where different users with a personalized user profile interact and share information with each other. Starting with Six * Corresponding author. Tel.: +91 9779991701.
E-mail addresses:[email protected](R. Kaur),[email protected]. in(S. Singh).
Peer review under responsibility of Faculty of Computers and Information, Cairo University.
Production and hosting by Elsevier
Egyptian Informatics Journal (2016)17, 199–216
Cairo University
Egyptian Informatics Journal
www.elsevier.com/locate/eijwww.sciencedirect.com
http://dx.doi.org/10.1016/j.eij.2015.11.004
1110-8665Ó2015 Production and hosting by Elsevier B.V. on behalf of Faculty of Computers and Information, Cairo University. This is an open access article under the CC BY-NC-ND license (http://creativecommons.org/licenses/by-nc-nd/4.0/).
Degrees in 1997[3], Online Social Networks such as Twitter, LinkedIn and Facebook have attracted large number of peo-ple. At present, almost every domain is linked in one form or the other with the social networks. Be it entertainment, edu-cation, trading, business, communication etc., OSN has made an influence on each of them. For example, mostly companies have started promoting their brands and products on social networking sites to increase the popularity of their products which in turn enhances their sales[4].
Contrary, to the positive side of social networking sites, its increasing popularity and open and free use have also led to their extensive misuse[5]. Malicious users are using it in a dif-ferent way by behaving and obeying patterns difdif-ferently from their peers. For example, a normal user often send emails to set of users which usually have connection among themselves but an anomalous user chooses its audience at random which are unlikely to have a relation in between them. Similarly, in the social networks such as Facebook and Google+ people who add friends indiscriminately, in ‘‘popularity contests” can be considered anomalous[6]. A new set of social network attacks may include unnecessary friend requests on Facebook, spam emails etc. ‘‘Millions of people fell for Facebook scams in 2014. They lost money, reputation and even their jobs after simply clicking on the wrong social media link”, claimed the Online security firm BitDefender[7].
An anomaly is defined as an unusual activity exhibiting a different behavior than others present in the same structure. The term also called an outlier, abnormality or exception, has been defined in numerous ways by different authors. Some
of the most popular and commonly used definitions are pre-sented inTable 1.
There is usually confusion between certain terms relating to anomalies which are otherwise different from it. For example, as indicated in the definition proposed by Aggarwal and Yu [11], the presence of anomalies is considered different from noisy data as noise is often viewed as a random error or a vari-ance depicted in a variable and has no relevvari-ance during data analysis. As an example, while detecting credit card faults ran-domness in the behavior can be analyzed in terms of a person’s purchase activities. Consider a scenario in which if one day a person buys a bigger lunch than he normally do, or have an extra cup of coffee than usual, it may seem like ‘‘random errors” or ‘‘variance” but it is actually the ‘‘noisy transac-tions”. And hence, it must not be considered as anomalous; otherwise, it will be highly expensive for the company to verify so many transactions or lose the consumers by troubling them with several false alarms[14]. What is usually practiced is to remove noise before performing anomaly detection. Similarly, anomaly detection is also considered analogous to novelty detection [15,16] in which previously unobserved novel pat-terns in the data are detected. They may initially appear to be same but in novelty detection upon the confirmation of new topics they are generally incorporated into the model of normal behavior.
The presence of anomalies in our data poses many prob-lems which need to be tackled carefully. For example, some sort of malicious users may construct a set of false identities and use them to communicate with a large random set of inno-cent users[17]. Hence, detection of these anomalous activities in a network is a big concern as their presence may lead to heavy losses. For example, in a computer network an anoma-lous traffic pattern could mean that a hacked computer is send-ing out sensitive data to an unauthorized destination [12]. Nowadays, not only the detection but the reason why these activities took place along with the methods to prevent these behaviors is on the rise. Here in this paper, various techniques used to detect and handle the anomalous behavior are covered. At first, a generalized view of various data mining techniques applicable to multiple domains and applications is given and then a special reference is given to some of the popular anom-aly detection methods applicable to social networks.
The paper is organized into different sections. Section 2 contains the novel categorization of anomalies on the basis of number of parameters. The major data mining and social network techniques for anomaly detection have been discussed in Sections 3 and 4 respectively. Finally, Section 5 presents conclusion along with some future directions that could be addressed.
2. Types of anomalies
Anomalies or the abnormal activities can be classified into dif-ferent categories based upon number of parameters. This sec-tion discusses some of these categories.
2.1. Based on nature of anomalies
Chandola et al.[12]classified anomalies into mainly three cat-egories based upon the nature and scope of anomalies:
Table 1 Various definitions of anomaly.
Defined by Defined in
Defined as
Grubbs[8] 1969 An outlying observation, or outlier, is one that appears to deviate markedly from other members of the sample in which it occurs
Barnett and Lewis[9]
1994 An observation (or subset of observations) which appears to be inconsistent with the remainder of that set of data
John[10] 1995 An outlier can also be considered as a surprising veridical data, a situation in which a point otherwise belonging to class A but in actual is placed in class B, thereby making the true (veridical) classification of that point surprising to the observer
Aggarwal and Yu[11]
2001 Outliers may be considered as noise points lying outside a set of defined clusters or alternatively outliers may be defined as the points that lie outside of the set of clusters but are also separated from the noise
Chandola et al.[12]
2009 Patterns in data that do not conform to a well defined notion of normal behavior Savage et al.
[13]
2014 Regions of the network whose structure differs from that expected under the normal model
2.1.1. Point anomalies
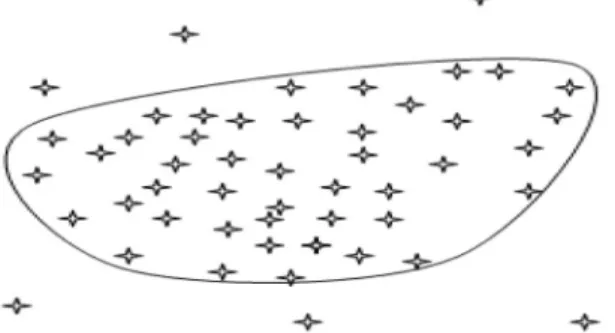
Point anomalies, also referred to as global anomalies are found if a data object (i.e. a point) shows a different behavior than that of the rest of the data. Although being the simplest kind of anomaly to be detected yet major problem associated with detecting point anomalies is finding a suitable measurement in deviation of the object from other objects. Let us assume that for a normal network every node must have at least two neighbors linked to it. As shown inFig. 1, nodes in Group V2 form such type of network and thus represent a normal behavior but group V1 contains isolated points. Because of their dissimilar behavior to other nodes they are predicted to be representing an anomalous behavior.
Similarly we may also havelocal anomalieswhich are studied relative to their local neighborhood only. For example, if we group a set of individuals based on their links in the network as friends and check their income (some parameter), a particular individual, let say A, might be having a fairly low income com-pared to his friends suspecting a local anomaly while overall in the global context his income might be insignificant as many people may have similar income representing a normal behav-ior. This behavior is depicted inFigs. 2(a) and 2(b).
2.1.2. Contextual anomalies
Frequently, referred to as conditional anomalies, these are pre-sent in the data set if the data object deviates significantly with respect to a specific context. For example, temperature may be considered as a contextual anomaly. If for example, today’s temperature is 28°C. Whether it is anomalous or not depends upon the time and location. It is viewed as an anomaly when considered in winters in Toronto. But in summers in Toronto this much temperature is normal and hence no abnormality is seen.
While detecting contextual anomalies two attributes of the data object define the data set:
Contextual attributes: These attributes define the context of the object. For example, in temperature example, contex-tual attributes are date and location.
Behavior attributes: Characteristics of an object are defined using these attributes and in a way help to identify the anomalous behavior of an object with respect to its context. In the temperature example, temperature, humidity etc. can be considered as behavior attributes.
When dealing with behavior attributes, a data object may be considered anomalous with respect to one context whereas normal in a different context. Usually proximity based meth-ods, discussed in Section3.1are used for contextual anomaly detection.
2.1.3. Collective anomalies
Collective anomalies are encountered whenever a collection of data objects as a whole depicts a different behavior than others, whereas the individual data objects may not be anomalous.
Objects in group G inFig. 3, represent a collective anomaly on the basis of let us say, density parameter. Density of this group G is very high as compared to others. But on the other hand, each individual black data object in G is not an anomaly with respect to others. Similarly, in a real-life scenario we may assume that the figure shows the set of students who reserved a seat for a particular course and if one of them leaves a course, it may be considered as normal but if multiple students start leaving the course then they as a complete group represented by G are considered as anomalous (see.Fig. 3).
One of the fine principles adopted to detect collective anomalies is to consider the behavior of thegroup of objects along with the background information about the relationship among those data objects.
Figure 1 Point anomalies.
Figure 2a Groups on the basis of friendship links.
Figure 2b Groups according to income.
2.1.4. Horizontal anomalies
Recently, another type of anomaly, calledhorizontal anomaly [18]has evolved in social networks which depict the presence of anomalies based upon the different sources of data avail-able. For example, the same user may be present in different communities on different social networks. Similarly, a user may have similar kinds of friends on number of social net-works (e.g. Facebook, Google+) but completely different kinds of friends for another social network (e.g. Twitter). This depicts an unusual activity which can be considered as anomalous.
2.2. Based on static/dynamic nature of network/graph structure
[13]
Further classification of anomalies based upon the network structure being used distinguishes them as being static or dynamic. Static networks such as bibliographic networks, allow the changes to happen slowly over time whereas dynamic networks such as mobile applications, allow the faster commu-nications and continuous changes in the networks.
2.2.1. Dynamic anomalies
A dynamic anomaly exists with respect to previous network behavior in which changes occur in the network with the pas-sage of time. For example, it may involve changes in the way interactions take place in the network.
2.2.2. Static anomalies
A static anomaly occurs with respect to remainder of the net-work ignoring the time factor. Only the current behavior of a node is analyzed with respect to others in the network. 2.3. Based on information available in network/graph structure
[13]
Depending upon the type of information available at a node or an edge, anomalies can be categorized as labeled or unlabeled. 2.3.1. Labeled anomalies
Labeled anomalies are related to both structure of the network and the information gathered from vertex or edge attributes. For example, labels on nodes may specify the attributes of individuals involved in the communication activity and that on the edges represent their interaction behavior.
2.3.2. Unlabeled anomalies
Unlabeled anomalies are related only to the network structure. No attribute of a node or an edge is taken into consideration. Their classification is mostly studied as follows and differ-ent techniques have been developed and deployed to detect these types of anomalies. A number of such techniques have been discussed in Section4.
Static unlabeled anomalies
This type of anomaly occurs when behavior of an individ-ual remains static and the attributes such as age of individindivid-uals involved, type of interactions, and its duration are ignored due to unlabeled nature of the network in which labels on nodes
and edges are ignored. Only the fact that interaction took place is important.
Static labeled anomalies
When along with the network structure labels on the ver-tices and edges are also considered, then the anomalous sub-structures found are referred to as static labeled anomalies.
Static labeled anomalies are used in spam detection, for example, to detect opinion spam (which involves the fake pro-duct reviews). A set of hidden labels are usually assigned to the vertices and edges which are iteratively updated. In the pro-duct review system, a bipartite graph with one subset of ver-tices as users and other as products is taken in which the edges between the subsets represent the product reviews. Hid-den labels are assigned to both users and products. For users the label can be in the form of honest or fraudulent and for the products it could be either good or bad. A normal honest user will give accurate results i.e. for good products they give positive response and for bad ones they will give negative reviews whereas fraudulent users are understood to do the reverse.
Dynamic unlabeled anomalies
This type of anomaly arises when we have dynamic net-works that change with time. Behavior of the data object is dif-ferent with respect to previous time period relative to the network structure. For example while considering only the pat-tern of interactions, there are maximum of six ways in which a maximal clique can evolve: shrinking, growing, splitting, merg-ing, appearing or vanishing[19]. All of these involve studying the network structure with respect to the network structure prevalent at some previous time period. Sometimes, the nor-mal behavior does not result in any network change; then, any neighborhood changes may also predict an anomalous behavior.
Dynamic labeled anomalies
In a dynamic network when anomalous behavior is observed by considering labels of the vertices and edges also; then, anomalies observed are classified as dynamic labeled anomalies. Dynamic networks are worked upon by consider-ing the structure of the network at fixed time intervals and treating them in the same way as for a static network. 2.4. Based on behavior
Another class of anomalies namely, ‘‘white crow anomalies” and ‘‘in-disguise anomalies”(seeFig. 4) is presented by Chen et al.[19].
2.4.1. White crow anomaly
It arises when one data object deviates significantly from other observations resembling the basic anomaly definition. For example, while examining the student record, if a record is found where height of a student is entered as 56 ft, which is impossible, then it is taken as a white crow anomaly. These anomalies are mostly detected as particular nodes, edges, or subgraphs representing the abnormal behavior.
2.4.2. In-disguise anomaly
It is considered as a small deviation from the normal pattern [20]. For example, anyone attempting to peep into someone’s social network account would not want to get caught; there-fore, he will try to behave in the same manner as a normal user. Such anomalies are recognized through strange patterns, which also include uncommon nodes or entity alterations. These are difficult to be detected as they are hidden inside the network.
2.5. Based on structural operations on network/graph structure When dealing with the graphical structures like in social net-works, anomalies can be classified according to the graphical properties as well. Eberle and Holder[20]classified anomalies according to the following three properties:
1.Insertion: Insertion deals with the existence of an unex-pected vertex or an edge in the graph.
2.Modification: Modification deals with the presence of an unexpected label on a vertex or an edge.
3.Deletion: Deletion involves the absence of an expected ver-tex or an edge. Sometimes, it even incorporates the concept of dangling edges i.e. with the deletion of a particular vertex all the adjacent edges to it may also have been deleted.
2.6. Based on interaction pattern in network/graph structure Types of interaction and links among nodes involve the study of anomalies in[6]as follows:
2.6.1. Near Stars/Cliques
Presence of completely disconnected (Near Stars) or all con-nected neighbors (Near Clique) is very rare and is considered anomalous
2.6.2. Heavy locality
Heavy weight around a particular area or a group is suspicious and hence determines the presence of an anomaly
2.6.3. Particular dominant links
An unexpected presence of heavy load at a particular node or link as compared to other nodes or links specifies an unusual activity
A data set or a network may contain more than one kind of anomaly. Some of these anomalies can be clubbed together to form a hybrid set. As an example, Savage et al.[13]studied the classification of anomalies as a combination of static/dynamic and labeled/unlabeled.
3. Data mining approaches to anomaly detection
Anomaly detection is defined as ‘‘an observation that deviates so much from other observations as to arouse suspicion that it was generated by a different mechanism” [21]. Many of the prevailing systems use signature based techniques to detect the strange behavior because of the fact that they produce very less false positives compared to the anomaly based techniques but still the latter is a better approach to use because of its ben-efit of detecting zero-day attacks (previously unknown attacks). From data mining perspective anomaly detection is broadly classified into the following three categories
Supervised methods Semi-supervised methods Unsupervised methods
These methods usually work on the criteria whether a domain expert labeled sample of data of normal and anoma-lous objects is either available or not to build the anomaly detection model.
Supervised methods
These methods model both the normal and abnormal behav-iors. It involves studying anomaly detection as a classification problem with the pre-labeled data, labeled either as normal or as anomalous. There are two applicable approaches for it.
One, experts may pre-label the normal data and any such data which is not analogous to this model is considered anomalous.
The other way is to do the opposite i.e. have the predefined set of anomalous data and any objects not corresponding to the set of anomalous data are considered as normal. The major task involved in classification approach of super-vised methods is to make the classifier learn. A classifier can be constructed in numerous ways. For example, it can be neural network based [22,23], support vector machine [15,16,24], Bayesian network based[25,26]etc. Supervised anomaly detec-tion methods should keep in consideradetec-tion the following two aspects:
Anomalous objects are usually very less as compared to the normal data objects. Therefore, imbalanced class problem arises which needs to be resolved using methods such as oversampling (replicating) or other makeup ‘‘artificial anomaly”methods.
Secondly, while choosing a classification method to detect anomalies major focus should be given on recall i.e. detect-ing accurately as many anomalies as possible rather than avoiding false positives.
Unsupervised methods
Unsupervised anomaly detection methods are used when labeled data objects are not available i.e. no predefined labels as ‘‘anomalous”or ‘‘normal”are attached to the data objects. Unsupervised methods are usually studied as a clustering problem.
These methods implicitly assume that the normal objects are a bit clustered forming one or more groups with distinct features. Hence, normal objects are expected to frequently fol-low a pattern whereas anomalies do not seem to behave in this manner as shown inFig. 5.
But this assumption is not always true as sometimes it is the anomalies that form the similarity pattern or clusters such as collective anomalies as shown in Fig. 3 previously. So, here unsupervised methods work inefficiently by issuing a large number of false alarms especially when the normal objects are variedly scattered.
Generally, in unsupervised methods firstly the clusters based on a similarity measure of the objects are found and the objects not obeying any cluster are considered as anomalous. A prereq-uisite for supervised methods is the prior availability of complete data before any processing can occur. Therefore, they are mainly designed to handle only the static data.Two major challenges faced by unsupervised methods are as follows:
Firstly, a data object not belonging to any cluster is consid-ered as anomalous but many times this deliberation can be false because, such a data object can be a noise rather than an anomaly.
Secondly, what is usually practiced is to firstly find the clus-ters and then the anomalies. But this methodology seems to be quite expensive as number of anomalies present in a data set is pretty less than normal data objects.
Semi-supervised methods
Semi-supervised methods work with two sets of data, labeled and unlabeled. So, these methods are used when out of the complete data set only few instances of data labeled as
nor-mal are available. Using the snor-mall amount of labeled data a classifier can be constructed which then tries to label the unlabeled data. Hence, a model for normal data objects is built which is used to detect the anomalies in a way that the objects not fitting the normal model are classified as anomalies. This is the simplest approach called self-training used under semi-supervised model. Another method called asco-trainingcan be employed where two or more classifiers train each other. Self-training is more sensitive to errors than co-training. It is known as semi-supervised as it partially functions as supervised methods because only the normal class is taught and the algorithm learns to identify anomalies by itself.
This approach is applicable to both the static and dynamic data and defines a boundary of normality. A new data object is considered as anomalous if it lies outside the boundary and normal otherwise.
The problem associated with the semi-supervised methods is that if instead of availability of labelednormaldata only a small set of labeledanomalousdata is present, and then it will be difficult to predict every possible anomaly by building a model for anomalies in the same manner as it is done for nor-mal data.
Some of the prominent approaches under these three cate-gories that are highly helpful in determining the anomalies and are covered in this paper are as follows:
Proximity based. Clustering based. Classification based.
Graph Based Anomaly Detection (with special reference to social networks).
3.1. Proximity based (or nearest neighbor based) anomaly detection
Proximity and distance terms used to represent similarity and dissimilarity respectively are the key approaches used for detection of anomalies in any network. Proximity based anom-aly detection approaches ananom-alyze each object with respect to its neighbors. It is assumed that normal data objects have a close proximity toward their neighbors i.e. they follow a dense neighborhood pattern whereas anomalous objects lie far away from their nearest neighbors. A number ofk-nearest neighbor methods can be used which make use of various measures such as distance, density and other similarity measures to determine the proximity between the nodes. These proximity measures determine the efficiency of the methods. Proximity based meth-ods can be mainly classified into the following two categories: Distance based (computes the anomaly score by using the
distance of a data object to itskneighbors).
Density based (computes the anomaly score by using rela-tive density of each data object).
3.1.1. Distance based anomaly detection method
Distance based anomalies are considered as ‘‘global anoma-lies”. Generally, Euclidean or Mahalanobis distance is taken as the distance metrics.
General method.Neighborhood of an object determined by the distance threshold is analyzed for each object. If neighborhood of an object,o, misses out many objects from complete data set D, i.e. the defined neighborhood contains few elements, then ‘o’ is regarded as an anomaly[27,28]. Discussed methods make use of two global parametersdandbexplained below.
As stated in [14], ifd (dP0) be a distance threshold,b (0 <b61) be a fraction threshold and dist(.,.) be a distance measure, then, object ‘o’ will be aDB(d,b)-anomalyif kfo0jfdistðo;o0Þ dgk
kDk b ð1Þ
This computes the anomalies as follows:
d determines the maximum distance (radius) allowed between the objects to belong to the neighborhood of the object.
b specifies the fractional threshold that determines maxi-mum number of objects that could be there in the neighbor-hood in order to behave as anomalous node. If this threshold is crossed then the behavior is assumed to be fol-lowed by thenormalnodes and hence object ‘o’ is classified as a normal node.
Summing up the both the factors it can be predicted that for every node o, thek-nearest neighbors,ok, whereke[b||D||] are analyzed and all those nodes having less thankobjects in their neighborhood and dist(o, ok) >dare considered anomalous.
The above approach is defined in a similar way by Knorr et al.[28]as follows: ‘‘an objectOin a data setTis a DB(p,D) outlier if at least fractionpof the objects inTlies greater than distanceDfromO.”
The simplest approach in distance based anomaly detection is the use of nested loop method [28]. In this method, inner loop matches theb condition and concludes about the object whether it is anomalous or not based upon the number of ele-ments present in thed-neighborhood of the object.
Even though being the simplest approach it takes O(n2) time and is encountered as too costly when viewed from fol-lowing two aspects:
It tests each object against whole of the data set. Rather, there must be a way to determine the anomalous behavior of an object from the nearby neighbors.
Each object is checked one by one.
An alternative can be to make groups of the objects based on certain proximity measure and then check anomalies group by group.
To make such improvements in the behavior, a grid-based CELL approach[14,28]was formulated in which each cell con-sists of a number of objects that form a group as shown in Fig. 6and each cell has a diagonal of lengthd/2, wheredis the distance threshold value. A multidimensional grid may be constructed with length of each edge depending upon the number of dimensions i.e. with ‘n’dimensions, length of each edge is d
2pn. For a 2-D set data (Fig. 6) the example can be sum-marized as follows:
Neighbors of each cell C is divided into 2 parts: Level-1 cells (immediate neighbors) and Level-2 cells (one or two cells away) with the following implicit properties:
Level-1 cell property:For any point ‘a’ in cell C, and any point ‘b’ in level-1 cell, dist(a,b)6dalways hold true. Level-2 cell property:For any point ‘a’ in cell C, and any
point ‘b’, if dist(a,b)Pd, then ‘b’ belongs to a Level-2 cell. Based upon the above two properties, for each level a prun-ing rule is defined to conclude about the presence or absence of anomaly in the whole group (cell). Letx,y1,y2 be the total number of data objects in cell C, level-1, level-2 respectively.
Level-1 cell pruning rule: Assuming level-1 cell property holds true, ifx+y1> [bn], then all the objects in Cell C are not anomalous as they are satisfying the normal object behavior.
Level-2 cell pruning rule:Using the Level-2 cell property, all the objects in cell C are distance based anomalies if x +y1+y2< [bn] + 1 as both the conditions for anoma-lous behavior are met.
For higher dimensions the approach can be improved using Hilbert space filling curve. The multi-dimensional space in grid based approach is extended by Angiulli and Pizzuti[29]to han-dle the high dimensional data more efficiently. Hilbert space filling curve is used along with HilOut algorithm, an algorithm defined to choose the anomalies based on their aggregate score with their neighbors rather than one absolute score. For each object o, weight w, is computed as[14]:
wðoÞ ¼X k
j¼0
distðo;nnjðoÞÞ ð2Þ
wherenn1(o),nn2(o),. . .nnk(o) are thek-nearest neighbors of node o. After the weight computation, all the objects are ranked in decreasing order and top-m are stated as anomalous. Use of space filling curve reduces the time and space complex-ity which otherwise increases with the increasing dimensional-ity. Similar approach is used by Ramaswamy et al. [30] in which the ranked retrieval of anomalies is there. Instead of applying the approaches to full dimensional space, high dimen-sional spaces can be reduced to low dimendimen-sional space using dimensionality reduction method. The best way to extract the lower dimensional space is by using principal component analysis (PCA) in which usually principal components having low variance are chosen since normal objects on these dimen-sions are expected to be closer to one another while anomalous nodes deviate from others. This application of PCA is classi-fied into correlation based clustering methods. Other grid-based approaches include Clustering in QUEst (CLIQUE)
introduced by Chang and Jin[31], used for locating dense and spare clusters in subspaces.
As the dimensionality increases the question about why and up to what extent the data object is an anomaly is of more con-cern rather than just predicting out anomalies. One of the sim-plest approaches toward it is to compute sparsity coefficient. The more negative its value is, sparser a cell (hypercube) is and more likely the objects in C are anomalies.
3.1.2. Density based anomaly detection method
The major problem associated with distance based methods is its failure to detect local anomalies which can be easily over-come by density based methods. Density based approaches work by comparing the density of an object with density around its neighbors. For a normal object both densities are assumed to be same whereas for anomalous objects they are different. The concept of relative density is often used to mea-sure the degree of anomalous behavior of an object.
The simplest approach developed in this domain is the Out-lier Detection using In-degree Number (ODIN) proposed by Hautama¨ki et al.[32]. ODIN score of an object is the number of such k-neighbors of an object for whom this particular object is also ak-nearest neighbor. Inverse of such a node pre-dicts the anomalous score.
The most popular density based anomaly detection approach is the Local Outlier Factor (LOF) computation given in[33]. LOF score is defined as the ratio of local reach-ability density ofk-neighbors of object ‘o’ being examined with that of its own. This local reachability density used to compute LOF is a factor of bothk-nearest neighborhood of object ‘o’ and the reachability distance measure. For an anomalous object LOF score is higher as relative density of an anomalous node is less than that of its neighbors. But for normal data objects both densities are approximately the same.
A small variation in the consideration of neighborhood set led to the formulation of a number of different approaches which otherwise worked same as the LOF. For example, in Connectivity-based Outlier Factor (COF) [34] neighborhood set of an object is constructed by adding the closest object to ‘o’ in the set and then incrementally updating the list with the objects having minimum distance to any other object pre-sent in the neighborhood set, until it reaches k. Similarly, another technique called Influential Outlier (INFLO)[35]also works on the different variant of a neighborhood set. It uses reverseknearest neighbors set (RNNk) to get all those points which has object oin its neighborhood set. Computation of anomalous score in these methods is in the same manner as in LOF with certain added terminologies.
In order to make the approaches computationally less expensive some sort of statistical measures are added to them. For example, instead of using the densities as it is the compu-tation of standard deviation of densities led toward an approach named as Multi-granularity Deviation Factor (MDEF) as suggested by Papadimitriou et al.[36]. Similarly, Local Outlier Probability (LoOP) method [37] also makes use of the statistical measures and estimates the probabilistic LOF as a factor of ratio of densities to finally compute the measure called as LoOP.
Merits of proximity based approaches Simplest data mining approach.
Applicable to a number of domains.
An easy and straight forward approach as the only major requirement for such methods is the identification of a distance or density measure.
Demerits of proximity based approaches
Handling and detection of anomalies become difficult when we have several regions with widely differing densities.
Also it becomes difficult to detect the group of anomalies if they are present close to each other.
Proximity based methods are highly dependent on the proximity measures used for their efficient working which might not be available in certain situations.
3.2. Cluster based anomaly detection
As stated by Berkhin[38]clustering is considered as an unsu-pervised learning of a hidden data concept. Clusters of the data objects can be constructed using numerous methods such as, K-Means, K-Medoids for small data sets and CLARA [39], CLARANS[40]for large data sets and BIRCH [41], Chame-leon [42] for performing macro clustering on micro clusters. Cluster based methods follow a simple assumption that usually anomalies either belong to a small sparse cluster or do not belong to any cluster whereas the normal objects are a part of large and dense clusters. So, cluster based anomaly detec-tion approaches state the presence of anomaly in the following three cases:
If the object does not belong to any cluster.
If the distance between object and cluster to which it is clos-est is large.
If the object is a part of small or sparse cluster, then not only the object but all the objects belonging to that cluster are considered as anomalous.
3.2.1. If the object does not belong to any cluster
For this case, simply the density based clustering approaches can be used simplest of which is the DBSCAN and its numer-ous variants. DBSCAN [43]checks the density around each object and the one being isolated or of lower density than others is considered as an anomaly. One of the striking fea-tures of this method is that it can detect the clusters of arbitrar-ily any shape. A number of improved variants of DBSCAN such as, FDBSCAN[44], L-DBSCAN[45], C-DBSCAN[46], P-DBSCAN[47], and TI-DBSCAN[48]have also been applied to detect the anomalies efficiently. Apart from the DBSCAN other applicable approaches are C2P[49], CURE [50], SNN [51] etc. Out of all such measures the prominent one is the Shared Nearest Neighbor (SNN) method in which the similar-ity between the data points is identified based upon the number of nearest neighbors shared and hence the core points around which the clusters are to be built are identified. This approach helps to identify the dense as well as medium and sparse clusters.
3.2.2. If the distance between object and cluster to which it is closest is large
No doubt, the proposed methods help to identify the anoma-lies but they focus more toward finding the clusters and consid-ering any point not related to any cluster as noise which in a way is assumed to be anomalous. Some of the cluster based methods also avoid finding the degree of anonymous behavior shown by each data object. In order to encounter such prob-lems, numerous advanced approaches have been proposed. For example, Cluster based Local outlier factor (CBLOF) [52] and the corresponding algorithm FindCBLOF are used to mine the encountered anomalies. CBLOF is measured as a factor of both the cluster sizeto which object belongs and itsdistancefrom the cluster it is closest to. FindCBLOF uses the Squeezer algorithm which constructs the clusters out of which a set of large and small clusters are formed and CBLOF is calculated for every data point. In a similar fashion a num-ber of other techniques using different distance measures have also been proposed like, Self-organizing maps (SOM) an unsu-pervised method proposed by Kohonen[53],k-means cluster-ing[54,55],k-means++[56,57]. As these techniques involve the computation of distance factor, therefore, they are a good way to handle the second case. Some of the semi-supervised methods proposed by Wu and Zhang[58], Vinueza and Grudic [59]can also be used.
3.2.3. If the object is a part of small or sparse cluster
This case is handled by defining a threshold value for the clusters and the objects belonging to low value clusters are considered as anomalous. FindCBLOF algorithm detects both the individual objects and points belonging to small clusters as anomalous by computing the similarity between the objects in the small cluster and the closest large cluster. CBLOF value for such points comes out to be very low. Apart from this, other applicable approaches are described in [52,60,61]. Distance or densities of the small clusters gen-erated are compared with those of large clusters and anoma-lies are detected. Numerous efficient techniques such as k-d trees and CD-trees are used to partition the data into clusters.
Along with the above techniques concepts of local cluster-ing, co-clustercluster-ing, bi-clustering and subspace clustering have been used by Beutel et al.[62]to select the set of attackers in social network domain. In subspace clustering a cluster is defined as a subset of data objects which are similar to one another in terms of the above defined similarity measures such as distance, density or other such variants for a particular sub-space. For example, one of the subspace clustering algorithms, CLustering In QUEst (CLIQUE) proposed by Chang and Jin [31]is used for locating dense and spare clusters in subspaces. Similarly, bi-clusters allow both the objects and attributes to be clustered at the same time allowing a particular object or attribute to be involved in multiple clusters, or not in any clus-ter at all.
Merits of clustering based approaches
The major advantage of cluster based approaches is its unsupervised nature where no predefined set of labeled classes of data objects is required.
These methods involve fast comparison process as once clusters are constructed it is faster to compare objects to clusters because a number of clusters available are com-paratively less than number of objects.
Demerits of Clustering Based approaches
Incur high computation cost when the clusters are to be found before detecting anomalies.
A data object not belonging to any cluster may be a noise rather than an anomaly.
Computational complexity for such methods is highest of all the data mining methods applied.
Clustering approaches are a costly procedure for large data sets
Sometimes clustering process involves anomalous objects depicting similar behavior and hence forming the clusters. As anomalies follow a presumption to be belonging to either no cluster or a small cluster, so, objects in the above encountered clusters might be considered as normal.
3.3. Classification based approaches
Classification is defined in[14] as a supervised method with two steps i.e. a learning step and a classification step. In the learning stage a trained set of labeled data instances are used to construct a classification model and in the classi-fication step the constructed model is used to predict the class labels for the data. Both the steps are respectively sta-ted as the training and the testing stages. For detection of anomalies, the training data objects are labeled as ‘normal’ and ‘anomalous’. Numerous classifiers are available which can be used for the detection of anomalies. Classification based approaches can use either a one class model [63] or a multiclass model. A simple brute force approach may not be much effective as the number of normal data objects is much larger than number of anomalous data objects. Hence, there arises a need for such class models.
In one class model, only a single labeled class is defined i.e. classifier is constructed to only define the normal class and all those data objects that belong to that class are treated as nor-mal whereas the ones that do not fit in the defined class are treated as anomalies. Some of the examples of one class models used for anomaly detection are one-class SVM[64], Gaussian model description (GAUSSD)[65], Principal component anal-ysis description (PCAD)[66], Parzen window classifier (PWC) [67]etc. In each of them a decision boundary is set up. The data objects falling outside the decision boundary are treated as anomalous. One-class models help to detect new anomalous objects that are far from the other anomalous objects present in the given training set.
The other set of model called the multiclass model is used when the available data objects not only belong to a single class but to multiple classes. For example, the classification of a set of images of fruits into the probable classes of apples, oranges or mangoes. Every data object may be assigned only one label. Just like, a fruit may be classified as either one out of the three categories but not more than one at the same time.
On the contrary, in one-class model only class defined is that of the fruit. Irrespective of the type, every fruit object is put in this class and the remaining objects are classified as anomalous.
A number of classifiers can be used for the classification process. Some of them which are best suited for the detection of anomalies are discussed in the following subsections. 3.3.1. Bayesian classifier
These are thestatistical classifiersmaking use of the prediction probabilities about any data object belonging to a particular class. Heckerman and David[68]gave a detail picture of Baye-sian networks for data mining including its use in supervised and unsupervised learning.
The simplest Bayesian classification involves the use of Naı¨ve Bayesian Classifiers. There are two properties that it exhibits. One, it makes use of the Bayes’ theorem of posterior probability. Second, it obeys the class conditional indepen-dence property i.e. any effect of an attribute value on a certain class is independent of the value of other attributes.
Another variant of Bayesian classification is the Bayesian belief classifiers. They are the probabilistic graphical models having a directed acyclic graph with each node representing a discrete random variable of interest and a set of conditional probability tables representing casual relationships on which learning can be performed. They differ from naı¨ve Bayesian classifiers in a manner that they allow dependencies between attribute values to be defined. It outperforms the latter’s per-formance because of the explicit representation of causal struc-ture and the presence of human expertise knowledge thereby increasing the learning rate.
Theoretically, Bayesian classifiers are more accurate than other classifiers with minimum error rate. But practically this might not always hold true. Also, even though the inferences drawn from it and threshold-based systems are found to be quite similar this approach requires much greater computa-tional cost and effort[69].
Kruegel et al. [69] studied the detection of anomalous behavior using Bayesian classifiers. Using this approach, all the previously unknown attacks are also identified but with the generation of a number of false positives. A model of the normal behavior is available and deviations from these behav-iors are identified as anomalies. There are a number of models which evaluate different set of features and return different probabilistic values as anomalous scores which are aggregated into a single value. But in every such model the final decision process is conducted using a Bayesian classifier.
3.3.2. Support vector machine[70]
It makes use of a hyperplane as a decision boundary to sepa-rate the tuples of different classes from one another. The major task involved in SVM is the selection of best separating hyper-plane from among several of them. An approach toward this issue is the use ofmaximum marginal hyperplane(MMH) i.e. the one with largest margin is considered most accurate for classification. SVM as a classification measure can be used to detect the anomalies in various applications.
Otherwise being a two class model approach, it may some-times be used as a one class algorithm with an addition of the fact that only a positive data set is taken as a class and the ‘‘anomalies”that are detected are treated as the other class.
Using a one class support vector machine model, anomalous behavior has been detected by Cortes and Vapnik[70]. Similar behavior has been described by Manevitz and Yousef[71]for classification of various documents represented in different formats. In [16], time series novel data considered to be anomalous has been detected using one class support value regression technique and ranked by attaching a confidence level to each anomaly. Eskin et al. [72] defined a feature space to which data objects are mapped and are classified as anomalous depending upon their position in it. For example, in the feature space, objects in sparse region are classified as anomalies. Another SVM based approach that uses Multiple-Classifier Payload-based Anomaly Detector (McPAD) consti-tuting one-class classifiers is used by Perdisci et al. [73]. Piciarelli et al.[74]detect the anomalies by the use of trajectory analysis used in traffic monitoring and video surveillance. The deployed method makes use of one-class SVM clustering to detect anomalous trajectories.
3.3.3. Neural network based
Neural network based classification methods, also called as backpropagation method or connectionist learning consist of weighted connected components in which at the initial phase of learning the associated weights are adjusted in order to make a correct prediction of the classes. Despite its difficulty for interpretation by human beings and long training times, these methods are highly used in classification and other prediction tasks due to their capability to classify the untrained data and high tolerance toward noisy data. These methods are also applicable both to the single class and multiclass environment. Multiclass problem in[75]is solved using neural network to not only detect the normal or the attack pattern but also the type of the attack. NNID, an off-line anomaly detection system is examined using Multi Layer Perceptron (MLP) neural network. A number of important commands are set to depict the user’s behavior. The process is carried out by identifying each user’s profile and detection of intrusions for every user based upon the evaluation of their commands. Another approach called Principal Compo-nent Analysis (PCA) used by Liu et al. [76], proved to be quite a beneficial classification approach to detect various threats.
In general, the classification process can be summed up as a sequence of following 4 steps
1. Start by discovering a set of class attributes and classes from the training data.
2. From those attributes, identify the ones suitable for classification.
3. A model using the training data is learnt.
4. The model is then used for the classification of unknown data objects.
Merits of classification based approaches
Usually a fast process, especially the testing phase, because a classification model has already been learnt which just needs to be analyzed for testing process. Classification based techniques help in improving the
efficiency especially when ensemble methods incorporat-ing integration of a number of classifiers are used.
Demerits of classification based approaches
One of the concerns for the classification method is the heavy dependency and reliability on training data which if not properly available may lead to the degradation of performance.
Many of the times we may encounter a class imbalance problem in which only few objects represent the main class. Although a number of sampling strategies have been proposed still this issue needs to be addressed.
Combination of both classification and clustering approaches as shown inFig. 7helps to find the anomalies in semi-supervised manner by forming the clusters first and then applying class models to it. The points not classified in any of the cluster are considered as anomalies.
Other inter-related domains such as intrusion detection, misuse detection, and novelty detection are equally being explored to detect different novel and miscellaneous events. But somehow all such techniques are working with the similar objective in mind. Therefore, researchers nowadays are drift-ing toward integratdrift-ing these independent domains to develop a hybrid approach. A number of researchers have inferred that the use of multiple detection techniques helps to achieve a bet-ter performance than the use of a single technique. For exam-ple, recently Kim et al.[77]proposed a novel hybrid approach for intrusion detecting by hierarchically clubbing anomaly detection and misuse detection methods. C4.5 decision tree algorithm was used for misuse detection and many one-class SVMs were used to handle different decomposed training sub-sets. The experiments were performed on renowned KDD data set. Similar approach has been used to detect malicious web pages also[78]. The implication used is that misuse detection method is an efficient way to identify the well known attacks but fails to detect new ones whereas the anomaly detection method is good in detecting the unknown events, no doubt most of the times with a high false positive rate. Therefore, to overcome the shortcomings of both the methods, an effort has been made to combine both the domains by implementing a two-phase process. First phase involves misuse detection (supervised learning) and the second phase undergoes anomaly detection (unsupervised learning). In a similar fashion, a novel approach named Cluster center and nearest neighbor approach (CANN) has been proposed in which two distance measures are computed and summed[79]. As the name suggests, first dis-tance is computed between each subset of data and its cluster
center whereas the other one is calculated between the data object and its nearest neighbor in the same cluster. Finallyk -NN classifier is used to classify nodes in each subset of data.
4. Anomaly detection in social networks
Online social networks being the center of attraction for num-ber of applications are best viewed as a graphical structure with nodes and edges depicting the users and their interaction activities respectively. The nodes and edges in a network can be labeled or not depending upon the network structure being studied. Most of the cases involve considering only the binary and static social links in which mere presence of a link is con-sidered sufficiently good without giving any importance to the actual communication activity of users. But going through the literature, it has been observed that earlier research analyzed the significance of users’ actual interactions also. ‘‘No matter what resources are available within a structure, without com-munication activity those resources will remain dormant, and no benefits will be provided for individuals”[80]. Taking into consideration actual communication activities and interactions of users, the resulting graph, usually called an activity graph [81,82]are drawn. This activity graph can be categorized as a basic activity graph or a weighted activity graph. A graph con-taining similar kind of edges in every pair of nodes irrespective of strong or weak ties between them is called a basic activity graph but weighted activity graph represents a graph structure in which strength of the activity link is also taken into account. The increasing trend of social networks attracted their mis-use by number of malicious individuals also. Hence, the detec-tion of anomalous activities becomes the need of the hour. Sometimes, it becomes difficult to analyze the social networks because of their large size and complex nature and it becomes necessary to prune the networks to include only the most rel-evant and significant relationships[83]. Usually, the presence of an anomaly is considered as a binary property in which anomaly is either present or not, but in some applications the extent to which anomaly is present is considered by giving degree of being an outlier to each object in the data set. As an example, Breunig et al.[33]referred this degree as Local Out-lier factor (LOF).
OSN are often represented as graphs in which users are rep-resented as nodes and interactions among users as edges which can be either labeled or not. In most of the cases, binary and static social links are considered in which only the mere pres-ence of a link is considered sufficiently good but users’ actual communication activity is given no importance. However, it has been found that earlier research focused on the importance of users’ actual interactions also. ‘‘No matter what resources are available within a structure, without communication activ-ity those resources will remain dormant, and no benefits will be provided for individuals”[80]. The graph resulting from such networks involving user interaction activities is called an activ-ity graph[81,82]which can either be a basic activity graph or a weighted one. Basic activity graph represents the graph in which every pair of nodes has similar kind of edges irrespective of strong or weak ties in between them whereas weighted activ-ity graph is the one in which strength of the activactiv-ity link is also taken into account.
Sometimes, large size and complex nature of social net-works make them difficult for analysis purpose. Hence, in such
cases, pruning of the networks to include only most relevant relationships is done[83]. In most of the cases, the presence of an anomaly is considered as a binary property in which anomaly is either present or not, but in some applications the extent to which anomaly is present is considered by giving degree of being an outlier to each object in the data set. For example, this degree has been referred to as Local Outlier fac-tor (LOF) by Breunig et al.[33].
It has been seen that for any kind of social network, analysis of one or more of the three influence factors is targeted[84]:
a subject node (node influencing others),
a tie or a social link (communication link between nodes), or
an object node (the node being influenced).
Out of these three factors first two have been the center of study by most of the researchers but the last one has got very little attention and is a current topic of research.
The graphical representation of the social networks leads to the applicability of different anomaly detection techniques. Proximity or similarity measures defined in data mining tech-niques do not seem much appropriate for social networks. Similarity in social networks may be defined on the following basis:
Structure context-based similarity: It is a local cluster or neighborhood based similarity in a way that nodes having similar neighborhood are considered as similar. For exam-ple, in social networks, different users getting recommenda-tion about a page or a community etc. from a number of mutual friends usually make similar decisions and help in determining how close they are.
Similarity based on random walks: This type of similarity could be well described by this example. Suppose, an information or message needs to be forwarded to multiple users. But at an initial stage it is sent to only two users A and B who forward it to their friends. Now, the closeness or similarity could be measured by the simultaneous receipt of the message from both A and B to the nodes. So, here similarity is addressed as a random walk measure over the network.
In social networks, the nodes disobeying these similarity measures by following behavior different from the other nodes are detected as anomalous.
Broadly, anomaly detection techniques in social networks can be categorized as follows:
Behavior based techniques
Structure (Graph) based techniques Spectral Based techniques
4.1. Behavior based techniques
Behavior based techniques handle the behavioral properties of the users such as number and content of messages, content of the items shared, number of likes or comments on a post and duration of a conversation. Some of the popular behavior based techniques are discussed below.
4.1.1. Content-based filtering
Content based filtering is one of the prominent and well-known behavior based approaches in which anomalous behav-ior is detected by looking at the internal content of the sent and received messages. A trained classification model that may be used in the analysis phase is built using the content of the mes-sages. As an example, Vanetti et al.[85]found a Filtered Wall system in which certain set of filtering rules were used by the users to avoid the unwanted and irrelevant posts from their walls. A Blacklist may be created using these filtering rules in which a number of constraints are imposed like ‘constraint on message creators’, ‘constraints on message contents’, and ‘action taken in the form of blocking, publishing or notifica-tion’. A user is regarded as anomalous or not based on the rel-ative frequency of unknown activities that node performs by disobeying the set of filtering rules continuously. Depending upon the anomalous activities performed respective constraint may be imposed and the users may be put into the blacklist called as BL. However, some smart malicious users are intelli-gent enough to befool and deceive others by behaving similar to the legitimate users. For example, in social network scenario two of the famous attacks called Sybil attacks and cloning attacks are quite popular nowadays [86]. Though a number of techniques have been projected to handle such type of attacks yet most of them seem to fail because of one or the other reason. For example, some of the simple techniques such as clustering coefficient (CC), and voting scheme are botched by the spammers by behaving or creating a similar network structure to that of a normal user. In Clustering coefficient method, for normal users value of clustering coefficient is high whereas that for spammers is close to 0. But in order to present themselves as legitimate, the spammers increase their CC value by making the neighborhood structure similar to that of the genuine users. Similarly, in voting schemes the illegitimate users make a number of fake profiles to increase the votings in the form of likes, views etc. or to avoid being classified as spam during voting. Even the advanced techniques such as Honeypots[87]proposed to detect the spammers fail to attract anomalous users in most of the situations.
Recently, an unsupervised statistical anomaly detection technique known as Principle component analysis (PCA) was used by Viswanath et al.[88]to detect the anomalous behavior in individuals. Unlabeled Facebook data set was used and a number of fake and compromised users were identified. The criteria for normal and anomalous distributions were judged by observing the ‘like’ activities of the users, for example, by studying the pages ‘liked’ by a user, number of posts/pages liked at a particular time period. The motivation for imple-mentation of this technique was the increase in purchase of fake Facebook likes, fake reviews for reviewing websites, fol-lowers on Twitter etc. Apart from these, a significant contribu-tion made by them was the deteccontribu-tion of click spams highly prevalent nowadays in ads. Either the users are unintentionally made to click on the spam links which seem to be genuine or some sort of malware hacks a person’s account and clicks ‘likes’, posts comments or reviews without the knowledge of user. By experiments it was inferred that most of the clicks on such sites were done by anomalous users.
Xiao et al. used the profile information of a user to detect fake accounts in online social networks using certain super-vised machine learning techniques for feature extraction and
cluster building [89]. The proposed technique is a faster and efficient way to identify fake accounts as it only uses the attri-butes entered by a user during registration i.e. profile creation. The employed technique is a first in its form to detect the clus-ters of fake accounts usually created by a single user on a par-ticular social network, thereby superseding the existing techniques which only work and make deduction for a single account. The system was found to restrict around 2,50,000 fake accounts.
4.2. Structure based techniques
Structure based methods work on the basic principle of using structural properties to check the characteristics of normal and anomalous users. A particular graph metric is figured out for different nodes or structures and the nodes showing different values than other users are considered as anomalous. The properties or metrics used may range from the simple proper-ties such as number of nodes, edges to highly complex central-ity measures. Just like supervised learning, here also a predefined normal pattern is already known and any deviation from that known pattern depicts the anomalous behavior.
The structural properties have been used by most of the researchers working in social network domain to define a num-ber of new approaches for identifying anomalies in online social networks. As an example, Link mining, used by Getoor and Diehl[90]studies the structural properties of the networks to predict different behaviors of individuals in social networks. For instance, a normal tendency shows that consumers, whose friends spend a lot, spend a lot themselves. The concept of link analysis is applicable for both homogeneous and heteroge-neous networks, but in the concerned work the graphical struc-ture of heterogeneous networks with different types of nodes or edges is given more focus. By analyzing the association between different nodes it is usually found that the linked objects often have a set of correlated attributes. In other words, connectivity of two users can be checked by examining the common properties as what is usually observed is that the objects sharing some sort of common features are often found to be linked with each other. Getoor and Diehl[90]covered eight link mining tasks with their respective algorithms and grouped the defined tasks under three categories, namely object-related, link-related and graph-related. Most of the structure based link prediction methods show poor perfor-mance because of the involvement of prediction of future rela-tionships likely to occur [91]. Earlier also a number of advanced tasks such as anomalous link discovery (ALD) were proposed which involved only the prediction of anomalous relationships rather than all the involved relationships[92]. It was seen that almost every prediction model performed quite well for ALD.
In social networks, link prediction is highly useful for detecting friendship links between different users as such tech-niques are a good way to examine connected, missing and cor-rupted links [93]. Therefore, they easily help to analyze the dynamics and prediction of future link behaviors. These tech-niques help to identify dynamic unlabeled anomalies by pre-dicting future events and analyzing previous network behavior which is a prerequisite for dynamic anomalies.
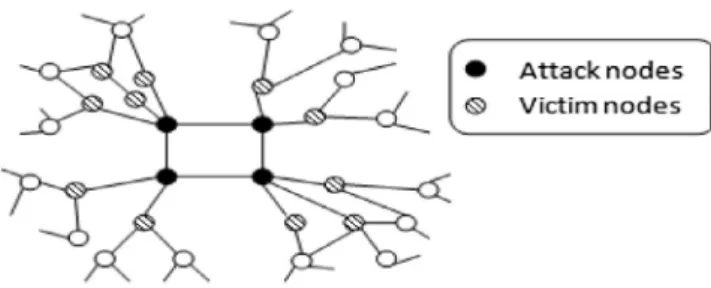
Shrivastava et al. [17] proposed a generic approach for detection of attacks, more specifically mentioned as Random
Link Attacks (RLAs). The basic motive behind such an attack resembles that of the Sybil attacks as it also makes use of mul-tiple fake profiles and their use to communicate with a number of random users. These attacks are quite prominent in email spams, viral marketing etc. with a fact that the victims are cho-sen randomly with each one having the equal probability to be a victim. This helps to analyze and detect the attacks efficiently as for an attacker, structure of a set of random nodes in its neighborhood will be quite different from that of a good node. A set of two properties namely, a clustering test and a neigh-borhood independent test are conducted on the suspicious nodes which after creating groups mark them as anomalous. Two heuristic algorithms GREEDY and TRWALK algorithm were proposed to detect the attackers.
Many already existing node-based and egonet-based fea-tures were studied recursively by Henderson et al.,[94]. Some aggregate values were calculated on the already existing char-acteristics. Neighborhood information was retrieved using both node and egonet-based features and behavioral informa-tion was extracted using recursive features.
Akoglu et al.[6]utilized another structure based approach in which a number of pattern and law discoveries were used by to detect different types of anomalies in social network graph. To spot some strange nodes especially in weighted graphs an Oddball algorithm was proposed in which a number of new rules (power laws) were discovered to detect the deviation from the known normal behavior. A set of features were grouped into certain set of carefully chosen pairs and anomalous behav-ior was analyzed by examining the group structure. Groups were formed where the patterns of normal behavior (power laws) were observed and the points deviated from discovered patterns were flagged out to be considered as anomalous. A number of anomalous relationships were observed namely Near Stars orNear Cliques, Heavy Vicinities and Dominant Edges.
A number of researchers used this Oddball algorithm to propose various new approaches and examine the relationship between different graph metrics. For example, Hassanzadeh et al.[95] explored various new social network metrics and used the power laws defined in Oddball algorithm to analyze the relationship among them, thereby detecting the anomalous relationships between different users. Among the different metrics used it was seen that the relationship between number of edges and average betweenness centrality of a user’s direct neighborhood helped to better predict the anomalous nodes.
Similarly, Rezaei et al.[96] used the same approach and analyzed the number of nodes and edges behavior to predict Near Star/Clique behavior in Twitter data set.
Both the works followed a five step process as follows: Determination of the anomaly detection graph metrics. Computation of fitting curve.
Calculation of the anomaly score. Labeling of nodes for further evaluation. Computation of the final threshold score.
4.3. Spectral anomaly detection techniques
Spectral anomaly detection techniques help in detecting anomalies using some spectral characteristics in the spectral