Title:
The application of methods of social network analysis in bibliometrics
and webometrics Measures and tools
Author: Anna Małgorzata Kamińska
Citation style:
Kamińska Anna Małgorzata
. (2018). The application of
methods of social network analysis in bibliometrics and webometrics
Measures and tools. “Nowa Biblioteka” (Nr 2 (2018), s. 29-46)
Anna Małgorzata Kamińska
Department of Library Studies
Institute of Library and Information Science University of Silesia in Katowice
e-mail: [email protected]
The application of methods of social
network analysis in bibliometrics and webometrics
Measures and tools
Abstract: The author describes in the article the use of social network analysis (SNA) methods in the field of bibliometrics and webometrics. Although the begin-nings of the application of these methods in various fields took place several years ago, their adoption in bibliometrics and webometrics still has not achieved popularity. While in foreign publications attempts have been made to use SNA methods, e.g. for the analysis of co-authorship networks, the results of Polish national bibliometric studies boil down mainly to tabular forms.
The first part of the article briefly introduces the reader to the world of SNA issues. Next, the author proposes possible interpretations of SNA measures in biblio-metric applications. The article concludes with an example of the practical application of selected SNA measures used for data from the national bibliographic database, CYTBIN. The proposed visualizations make it possible to discover relationships in the data analysed which would be difficult, if not impossible, to be noticed in a traditional tabular forms.
Keywords: Bibliometrics. CYTBIN. Gephi. Measures. Tools. Social networks. SNA
Introduction
A person widely believed to be the creator of the indexing database systems is Eugene Garfield, who in the article published in “Science” in 1955, proposed to build citation indexes for science as a tool, among others, for the evaluation of scientific journals. The first Science Citation GICID 71.0000.1500.0677
Index (SCI) was published in 1963 and covered 102 thousand articles that had been published in 1961 in 613 selected magazines (Garfield, 1964). Almost half a century later, Larry Page and Sergey Brin, the
developers of the popular and being continuously improved PageRank algorithm used by the Google web search engine, proposed a method for ranking websites that enabled presenting search results in order of their relevance to the query. As they admit, they were inspired by conversa-tions of their parents, who, being scientists, often talked about citaconversa-tions of research work. More information about the PageRank algorithm and other search engine mechanisms can be found in the paper by Amy N.
Langville and Carl D. Meyer (Langville, Meyer, 2012).
Regardless of whether the analysed objects will be articles, authors, citations, websites providing links to other websites, or other infor-mation referring to people, their artefacts and relationships between them, general principles of perceiving the mechanisms that govern such network structures and analysing phenomena occurring in them are similar. These observations have resulted in the emergence of the term ‘social network analysis’ (SNA). This wider view, along with the rapid development of information technology, has led to the development of a separate field within which methods for analysing phenomena occur-ring in the aforementioned networks are being developed (Newman,
2001, Taşkın, Düzyol, 2012).
It is worth noting here that history goes, in a sense, in circles – the
methods derived from the concept of analysing citations among scien-tific articles go back onto the ground of the issues of informatology, including bibliometrics. However, despite the fact that studies show
(Sosińska-Kalata, 2013) that bibliometrics and related areas account for as much as 17% of all the scientific research into information, the inter -est in the practical employment of SNA methods in these fields may be
noticed primarily in foreign scientific works – such as in the publica -tion by Angel A. Juan, Thanasis Daradoumis, Meritxell Roca, Scott E. Grasman and Javier Faulin (Juan, Daradoumis, Roca, Grasman, Faulin,
2012). Therefore, having gained some experience in the application of
SNA methods in the field of bibliometrics while carrying out her own bibliometric research, the author shares her knowledge in this paper.
The first part of the article comprises the basic concepts and terms used in the field of social network analysis. Selected elementary exam-ples illustrate how some particular measures work, and thus reveal the differences between the traditionally used bibliometric methods and the approach described. Next, proposals for the interpretation of selected measures in the field of bibliometrics have been presented. These
pro-posals should be treated as a starting point for further detailed research and one’s own reflections. In order to facilitate making first steps in this field of study by interested researchers, the article ends with the introduction to one of the publicly available tools designed for network structure analyses. It is based on a practical example of simple analy-ses carried out on the basis of data from the CYTBIN bibliographic database.
It should be clearly emphasized that the use of any SNA methods is conditioned by an appropriate structure of bibliographic data, which on a logical level will allow the representation of information in the form of a graph, on the paths of which traversing will be possible. More about graphical representations of bibliographic data may be found in
a different study by the author (Kaminska, 2018b), whereas a detailed
account of the method that enables collecting data in a system facili-tating the creation of such graphs, is provided in a publication entitled
‘ProBIT – The Prospective Method of Creating the Traversable Citation
Index versus Contemporary Issues in Information Space Organization
in Traditional Bibliographic Databases‘ (Kamińska, 2017c).
Selected basic measures of SNA
An inseparable element of the social network analysis is the calcula-tion of certain measures that are defined by specific, precise mathemati-cal formulas. Since it is a dynamimathemati-cally developing branch of science, it is difficult to present a single publication covering the entire issue, however a sufficient introduction may be found, among others, in the
paper by Marc Newman (Newman, 2010). It is worth noting that for car -rying out research work, it is not necessary to have detailed knowledge of the theory of SNA measures, as algorithms provided by a specific tool, and, in most cases, implemented by specialists of SNA methods are the most frequently used. What is needed, however, is knowledge and competence for interpreting the results obtained for individual measures.
Certain measures are calculated separately for each vertex or each edge of the graph, and their values may be interpreted as the level of the importance of a given vertex or edge in relation to the function that is being measured. Other measures, however, calculated for the whole graph, help to classify the nature of the connection network for a given community and, for example, may indicate whether a given network is dense, or easy to be broken / disrupted by eliminating its particular nodes, etc. Some measures are defined/established only for the simplest
undirected graphs, while others are generalized in the case of directed and weighted graphs.
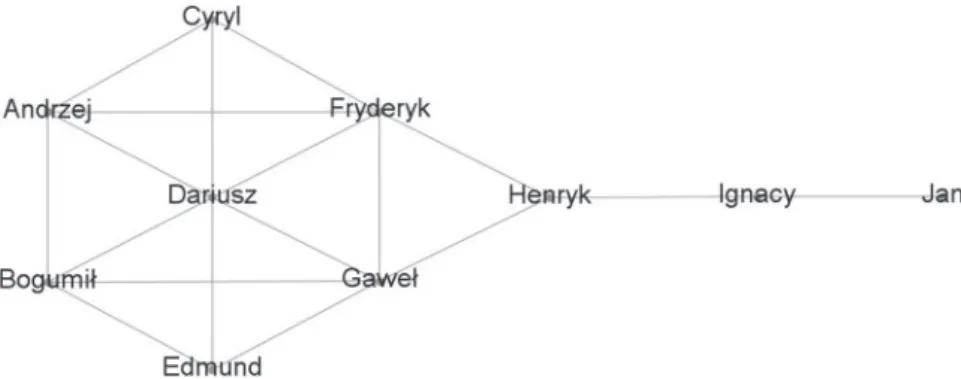
To illustrate how the basic, selected measures function, the graph presented in the figure (Figure 1) has been used. It is an undirected and unweighted graph.
Figure 1. An example of a graph illustrating the functioning of basic SNA measures
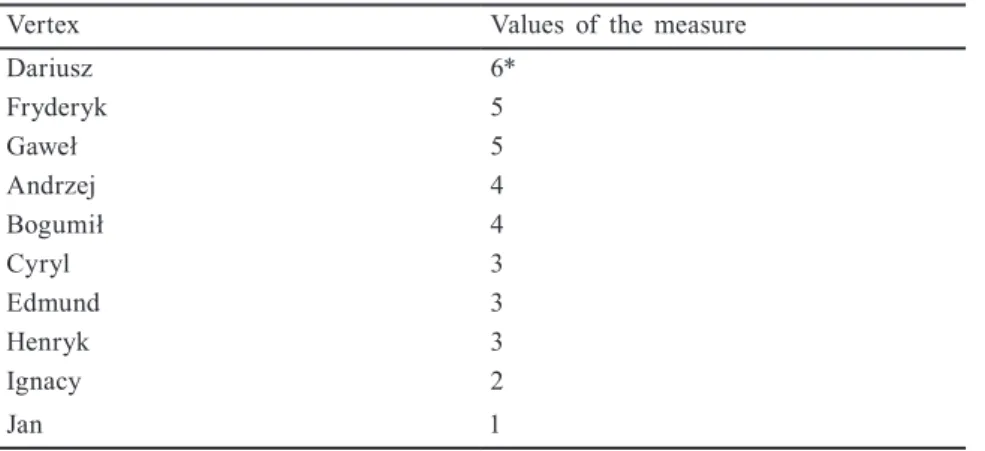
Source: The author’s own study inspired by https:/nauczanki.wordpress.com/tag/centrality/. The simplest example of a measure calculated individually for each vertex is the so-called degree of the vertex, whose value is equal to the number of edges converging in it. In the case of directed graphs, it is the indegree and the outdegree of the vertex. In the case of a di-rected graph of citations between articles, the vertexes with the highest indegree constitute interesting elements of this structure, since they are the most frequently cited articles. The vertexes having the largest outdegree are those that have the most extensive references. In the case of directed weighted graphs, the degree of a vertex can be calculated not as the number of the edges, but as the sum of the weights of the edges coming into or going out of a given vertex. The values of the measure calculated for an exemplary graph have been presented in the table (Table 1).
The basic measure described above is historically the first of the whole family of measures defined as centrality measures.
Another important measure is Closeness centrality, which describes the average distance between a considered given vertex and the rest of all the remaining ones, calculated according to the shortest paths. This measure may then determine how easy it is for a given individual entity to contact with all the others. The values of the measure calculated for
Table 1. Degree of vertexes
Vertex Values of the measure
Dariusz 6* Fryderyk 5 Gaweł 5 Andrzej 4 Bogumił 4 Cyryl 3 Edmund 3 Henryk 3 Ignacy 2 Jan 1
* It is apparent that the value of this example results from the number of the close neighbours, that is Andrzej, Bogumił, Cyryl, Edmund, Gaweł and Fryderyk.
Source: The author’s own study1.
Table 2. Closeness centrality
Vertex Value of the measure Fryderyk 0.6428571428571428* Gaweł 0.6428571428571428 Dariusz 0.6 Henryk 0.6 Andrzej 0.5294117647058824 Bogumił 0.5294117647058824 Cyryl 0.5 Edmund 0.5 Ignacy 0.42857142857142855 Jan 0.3103448275862069
* Fryderyk has direct and indirect connections/links with the nine neighbours; the number of the shortest paths leading to them are as follows: Andrzej (1), Bogumił (2), Cyryl (1), Dariusz (1), Edmund (2), Gaweł (1), Henryk (1), Ignacy (2), Jan (3). The value of the measure is cal -culated as a quotient of the number of the neighbours and the total number of the shortest paths leading to the neighbours, and is 0.642857. The minor deviation in the values in the table results probably from the manner of implementing the calculation algorithm and numerical imprecision of arithmetic calculations with the employment of the floating-point representation of the numbers.
Source: The author’s own study2.
1 The values of the measure have been calculated using the Gephi v.0.8.2 appli
-cation.
2 The values of the measure have been calculated using the Gephi v.0.8.2 appli
The measure of Betweenness centrality is calculated as the number of the shortest paths between each pair of the network nodes going through a given node. Thus, a node with a high value of this measure acts as a great information relay in the transmission of information on the network. In the case of a graph of article citations, a high value of this measure may indicate that a given article constitutes a bridge in the transmission of knowledge between science fields or between geographi-cally remote centres of science. The values of the measure calculated for an exemplary graph have been shown in the table (Table 3).
Table 3. Betweenness centrality
Label Value of the measure Henryk 0.3888888888888889 Fryderyk 0.2314814814814815 Gaweł 0.2314814814814815 Ignacy 0.2222222222222222 Dariusz 0.10185185185185183 Andrzej 0.023148148148148147 Bogumił 0.023148148148148147 Cyryl 0.0* Edmund 0.0 Jan 0.0
* To illustrate how this measure for individual nodes of the graph has been calculated it be would necessary to present arduous calculations on a matrix representation of this graph; how-ever, even at a glance at the structure, zero values for Cyryl, Edmund and Jan may be easily accounted for– each of the remaining nodes may communicate with any other mode without their participation, i.e. through shorter paths.
Source: The author’s own study3.
Eigenvector centrality, Katz centrality and the PageRank mentioned in the introduction are other popular measures.
An example of a measure calculated for the entire graph may be graph density. This measure demonstrates how close the graph is to being complete, that is, in such a way that each pair of vertexes has its
own edge. The value of this measure for the presented example is 0.44.
3 The values of the measure have been calculated using the Gephi v.0.8.2 appli
-cation.
4 The value of the measure, which has been calculated using the Gephi v.0.8.2
application, is the quotient of the number of graph arcs and the total number of the lines that might link all the vertexes thus forming the so-called complete graph. In
Possibilities of the interpretation of SNA measures
on the ground of bibliometrics and webometrics
Having already defined graph structures (Kamińska, 2018b) and
having acquired elementary knowledge about algorithms of SNA meas-ures and possible interpretation of their results in general, one can try to interpret them on the ground of bibliographic data.
In graphs that depict bibliographic data we usually deal with two types of relationships (types of edges), i.e. citing (related both to arti-cles and authors) and cooperation between authors (co-authorship). The former type of relationship is a directed relation, whereas the latter one is undirected, therefore in the case of measures calculated differently for directed and undirected graphs, both versions should be applied accordingly.
When it comes to the analysis of vertex degrees for citation graphs, the most interesting ones seem to be those whose value calculated for indegree edges is the highest. They reveal potential candidates who make a significant contribution to the development of a given field. However, this measure should not be interpreted uncritically, because the number of citations depends not only on the author’s contribution to the development of science, but also on such factors as the number of scientists cooperating with a given author, the popularity of the discipline in a given research centre, etc. Therefore, while taking into account the vertex degree, the impact of the paper should be consid-ered and the most important articles / authors should be rewarded. And thus, the more important vertexes point to a given vertex, the more importance should be attached to it. Such circumstances are taken into account within more advanced measures, such as PageRank. It might be interesting to find vertexes whose degree is high, but the value result-ing from the PageRank measure is low. In this case it might indicate potential candidates who did not have the most significant contribution to the development of science, but who were active on social or politi-cal grounds. While analysing the number of outgoing edges, it may be
noticed which vertexes have the most extensive references – this may
indicate that the knowledge is extensive and up-to-date, but in combi-nation with the PageRank measure, it may indicate whether someone had a lot of knowledge and shared it on scientific ground, or was rather active in the organizational and didactic field. In the case of the coopera-tion graph, it is also possible to assess whether the cooperating clusters of people constituted a strong group, or the groups were numerous but their knowledge on the merits was poorer, and the large number
ob-tained resulted from current trends prevailing in a given scholar centre or from other factors.
The measure of Betweenness centrality calculated for the citation graph may either indicate potential vertexes that act as bridges between various larger groups, which may indicate the interdisciplinary nature of the author’s article or interests, or it may point to the emergence of a new domain and to its ‘attracting’ smaller sub-domains that previ-ously belonged to other disciplines or research areas, etc. In the case of the cooperation graph, this measure may also suggest the interdis-ciplinary character of a given author, and also, for example, his/her multilingualism, which facilitates his/her communication with different science centres.
The measure of Closeness centrality may indicate how close a given vertex representing the author or article is to the mainstream of the field.
Interesting conclusions may be arrived at through the analysis of the Modularity measure, which is meant to isolate so-called clusters from the graph, which are a set of particularly strongly related nodes that represent candidates for an independent subgraph. The existence of such clusters may point to clear boundaries between subdomains of a given field, but also to increased interactions resulting merely from e.g. geographical proximity of cooperating authors.
In order to find out how closely the scientists have cooperated with
one selected author, the measure of Erdős number, very up-to-date and
popular in scientific environments, may be implemented. It describes the ‘distance of cooperation’, and it may be obtained by those who are co-authors of an article with someone who has already acquired it. The
author from whom the distance is measured is given the value k = 0.
Each co-author is given a number of k + 1, where k is the lowest value among all the co-authors of a given article.
It should be noted that the above considerations define, in a sense, the testing ground for studies, and may constitute a starting point for making hypotheses at the beginning of the analysis process. They should not be treated as universal, since each data set is characterized by a dif-ferent specificity resulting from a specific field of science, historical and cultural conditions, etc.
Selected software tools for conducting research by using
SNA methods
A selection of software that supports the analysis of graph structures is an important decision that determines both the potential of the analy-ses carried out and the possibilities of visualizing their results. Due to the dynamic development of the field of social network analysis, there is a whole range of relevant tools on the market, among which Graphviz5, Cytoscape6 and Gephi7, at the very least, deserve attention. Each of
them is a free tool, distributed according to the open source licence, and each of them has its advantages and disadvantages. In addition to analytical capabilities, an important feature is the „user-friendliness” of the graphic al interface, which boils down to the simplicity and intuitive-ness of the operations, and indirectly to the possibilities of presenting the results of the analyses. The above-mentioned conditions have been decisive about choosing the Gephi platform as one of the tools for car-rying out a certain stage of research using the SNA measures and as a basic tool for visualizing the results of these tests. This solution is relatively new and well suited for both ‘manual exploration’ of graphs through examining the graph structure, and for tabular presentation of vertexes and edges, as well as for performing advanced SNA analyses by means of many built-in algorithms. The tool has a modular architec-ture and it is possible to expand its capabilities by installing dedicated plug-ins that perform visualization, analytical and other functions. The possibilities of visualizing the results of analyses are significant and enable to define the size of nodes and edges, colours, their signatures or location depending on the value of attributes coming from the source system, as well as on the measures calculated. However, this tool is not devoid of certain flaws in its ‘beta phase’ (the version used for the analyses carried out in the article are only preproduction versions), which sometimes causes uncontrolled crushing of the program or logical inconsistency of certain functions. However, it should be stated that in the final evaluation, the tool turned out to be very sufficient.
5 For more information on Graphviz, please visit http://www.graphviz.org/.
6 For more information on Cytoscape, please visit http://www.cytoscape.org/. 7 For more information on Gephi, please visit http://www.gephi.org/.
A practical example of the implementation
of the SNA measure
This chapter presents examples of adopting some SNA measures for the purpose of analysing the data made publicly available from the bibliographic database of CYTBIN. According to its developers8,
CYTBIN is a bibliographic database comprising articles from selected national magazines in the field of library science and scientific infor-mation. These are:
1) Bibliotekarz (Librarian),
2) Praktyka i Teoria Informacji Naukowej i Technicznej (Practice and Theory of Scientific and Technical Information),
3) Przegląd Biblioteczny (Library Review), 4) Roczniki Biblioteczne (Library Yearbooks),
5) Zagadnienia Informacji Naukowej (Issues in Information Science –
Information Studies).
The bibliographic descriptions of the registered documents are ex-tended to include information about cited publications that is placed in the references and / or in the bibliographical footnotes.
It should be stressed here that the presented numerical data, which are the values of selected metrics, cannot be interpreted in absolute terms, and that they may be used mainly as an illustration of the appli-cation of these metrics and a comparison of the values obtained. This is due to the fragmentary representation of the field by the contents of the
analysed database – both in terms of a subset of collected material that
does not take into account e.g. monographs, and a quantitative subset of collected information about listed magazines, e.g. articles published in selected years. The presented analyses focus on the perspective of citations among articles, about which the information was collected from the CYTBIN database. The data have not been limited either to a specific time interval or to a specific journal. It is also worth noting that the data made available in this database are collected in a tradi-tional architecture, which means that records concerning cited sources and citing sources constitute separate entities. This results in the fact that in the case where the citing entity is also an entity cited by another citing entity, the information about this citing entity is stored in two separate places in the database. This makes it difficult to traverse the
8 Information about the CYTBIN database may be found at http://www1.bg.us.
citation paths, which, in turn, restricts enjoying the maximum benefits of using certain SNA measures.
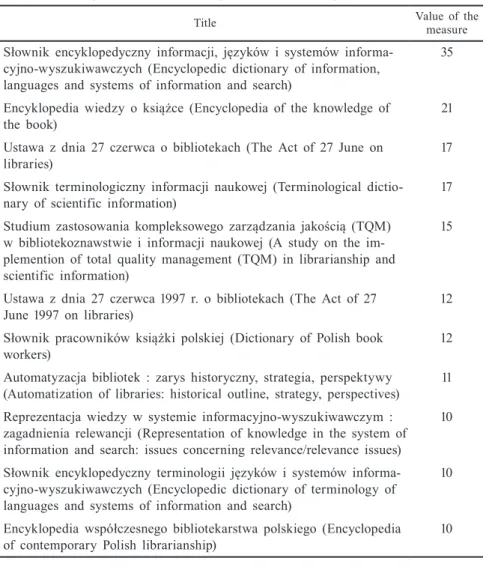
One of the simplest and historically first measures of SNA central-ity is the degree of the vertex. The graph of citations among articles is a directed and unweighted one, therefore what should be employed in this case is the version of the degree measure developed exactly for this type of graph. Since the edge of the citation is pointed from the citing article to the cited one, the indegree of the vertex shows the total number of citations of the given article. The highest values for the data
collected in the database are presented in Table 4. Table 4. The highest values of the degree of the incoming knot
Title Value of the measure
Słownik encyklopedyczny informacji, języków i systemów informa
-cyjno-wyszukiwawczych (Encyclopedic dictionary of information, languages and systems of information and search)
35 Encyklopedia wiedzy o książce (Encyclopedia of the knowledge of
the book) 21
Ustawa z dnia 27 czerwca o bibliotekach (The Act of 27 June on
libraries) 17
Słownik terminologiczny informacji naukowej (Terminological dictio
-nary of scientific information) 17
Studium zastosowania kompleksowego zarządzania jakością (TQM)
w bibliotekoznawstwie i informacji naukowej (A study on the
im-plemention of total quality management (TQM) in librarianship and
scientific information)
15
Ustawa z dnia 27 czerwca 1997 r. o bibliotekach (The Act of 27
June 1997 on libraries) 12
Słownik pracowników książki polskiej (Dictionary of Polish book
workers) 12
Automatyzacja bibliotek : zarys historyczny, strategia, perspektywy
(Automatization of libraries: historical outline, strategy, perspectives) 11 Reprezentacja wiedzy w systemie informacyjno-wyszukiwawczym :
zagadnienia relewancji (Representation of knowledge in the system of information and search: issues concerning relevance/relevance issues)
10
Słownik encyklopedyczny terminologii języków i systemów informa
-cyjno-wyszukiwawczych (Encyclopedic dictionary of terminology of languages and systems of information and search)
10 Encyklopedia współczesnego bibliotekarstwa polskiego (Encyclopedia
The PageRank measure was calculated in the same way, and Table 5 presents the highest calculated values in a descending order. In the case of the evaluation of scientists, currently there is an opinion that the total number of citations of their work is not an indicator that is sufficiently representative for assessing their contribution to the field, so here, in an analogous manner, the statement may be made that the total number of citations of a given article (which does not reflect ‘the quality / the significance’ of quoting articles) might be too simple an indicator for the evaluation of a specific article. Although the two tables clearly show the titles that appear regularly, their ranking (the order in the list sorted in accordance with the acquired value for each measure) is different. In each of the tables, it can also be seen that some titles do not appear in the other one.
Table 5. The highest PageRank values
Title Value of the measure
Ustawa z dnia 27 czerwca o bibliotekach (The Act of 27 June on
libraries) 2,00E-04
Słownik encyklopedyczny informacji, języków i systemów informa
-cyjno-wyszukiwawczych (Encyclopedic dictionary of information, languages and systems of information and search)
1,81E-04
Język haseł przedmiotowych KABA: zasady tworzenia słownictwa
(The language of subject entries KABA: principles of creating voca-bulary)
1,74E-04
Bomba megabitowa (Megabyte bomb) 1,50E-04 Leksykon biznesu : [słownik angielsko-polski, ponad 2300 terminów]
(Lexicon of business: [English-Polish dictionary, over 2300 entries]) 1,40E-04
Zaprogramować informatyzację (Programming computerization) 1,36E-04
Słownik terminologiczny informacji naukowej (Terminological dictio
-nary of scientific information) 1,28E-04
Studium zastosowania kompleksowego zarządzania jakością (TQM)
w bibliotekoznawstwie i informacji naukowej (A study on the
imple-mentation of total quality management (TQM) in librarianship and
scientific information)
1,27E-04
Polskie towarzystwa naukowe od XV wieku : wykaz (Polish
Promocja w strategii marketingowej biblioteki (Promotion in the
library marketing strategy) 1,21E-04
Zakup oraz wykorzystanie książek zagranicznych w bibliotekach aka
-demickich w Polsce (Purchase and use of foreign books in academic libraries in Poland)
1,18E-04
Source: The author’s own study.
Let us try to analyse the nearest surroundings of the considered
bib-liographic entities presented in Figure 2. The size of the vertex reflects
its degree, whereas the darkened area shows the value of the PageRank measure (the darker the vertex the greater its value of the measure is). As it may be noticed, these values are often correlated, however there are also cases that show otherwise. For example, ‘Encyklopedia wiedzy
o książce …’ or ‘Słownik pracowników książki …’ have a great indegree
of the vertex, but a relatively low PageRank measure.
Figure 2. Comparison of the indegree of the vertex with the PageRank value
This is because the measure also takes into account ‘deeper depend-encies’ that are greater than those resulting merely from the immedi-ate surroundings of a particular vertex. It may be observed here that the sets of citing and cited vertexes (a clockwise curve is an outgoing edge, while an incoming one is counter-clockwise) that constitute the ‘autonomous islands’ are ‘less credible’ for this measure than the items cited by the entities from the centre of the graph. On the other hand, the strength of the impact of the entities citing a lot of different entities is relatively smaller (in relation to a single cited vertex) than of the entity that cites fewer entities. In addition, this measure takes into account the ‘significance’ of the citing entity based on his/her non-immediate surroundings. Another issue here is the fact which has been revealed, in a way, by chance that in the database there are two records that represent
the same entity (Ustawa z dnia 27 czerwca 1997 …). The entity should
have been deduplicated, which might, of course, change the result of the ranking. More about the methods of deduplication of bibliographic records based on the similarity of the strings of characters, has been
presented in a separate study by the author (Kamińska, 2017b).
The presented example is only the simplest and basic implementation of SNA measures in the field of bibliometrics. What is a great benefit of using SNA methods for bibliometric analysis is various possibilities of visualizing analysis results, which does not only give evidence of their graphical attractiveness and perceivability, but most of all of their being facilitative for drawing conclusions about the closeness and the nature of cooperation between individual scientists. These visualiza-tions, due to printing limitavisualiza-tions, would be difficult to present within this article, but examples of them are presented, for example, in works strictly devoted to the visualization of the field of bibliometrics and the
creation of ‘maps of science’ (Kamińska, 2018a), (Kamińska, 2017a),
and in a study concerning bibliometrical analyses carried out basing on
the national bibliographic database CYTBIN (Kamińska, 2017d)9. Since the methods of social network analysis constitute a very dynamically developing branch, the verification of newly created methods in terms of their applicability in the field of bibliometrics may be an important and interesting subject of research.
9 The visualization results are also published online: https://doi.org/10.5281/zeno
Summary
This article presents an elementary introduction to the issues of the methods of social network analysis, whose use in the field of bibliometrics and webometrics may open up new opportunities for undertaking more advanced research into the development of scientific disciplines, creating visualizations of this development using ‘maps of science’, or evaluation of scientific papers and their authors. It is worth noting that scientometrics, in a sense, has already turned to-wards social networks due to altmetric analyses, which, however, usu-ally consist in the employment of very basic computational methods for scientific activity that is most often recorded on dedicated online portals. Both on discussion forums and in scientific publications, one may find discussions about the differences in the interpretation of the number of downloads, shares or views of articles by a given author. However, it seems that in scientific research, as in many other areas (e.g. banking), the transfer of ‘the hub’ of a scientific activity to the Internet occurs in an evolutionary manner. Therefore we can witness development / adaptation of mechanisms that can make such measure-ments more reliable by ensuring, at the appropriate level of the au-thorization of users, the non-repudiation of their activity or protection against ‘internet robots’ that might inflate altmetric measurements. In this article, the author presents the possibility of reversing the paradigm and turning towards social networks not through analysing internet activities, but by resorting to more advanced methods of the social behaviour analysis that are used for traditional bibliometric re-search material. At the same time, she tries to inspire other rere-search- research-ers to undertake further research in the field of:
– building their own analytical environments facilitating the
implemen-tation of more advanced bibliometric and webometric tests;
– the possibility of using individual SNA measures in the field of
information technology, in particular bibliometrics and webometrics; – the interpretation of results obtained using individual SNA measures; – the development of new measures intended for the field of
bibliome-trics and webomebibliome-trics.
Just as in the case of traditional methods, it is necessary to realize here that the numerical results of the conducted analyses should not be treated in absolute terms, and that they should only be a source of fur-ther research, investigations and hypotheses, which, after having taken into account other (perhaps less measurable) circumstances, such as the political system of a given country, the pace of economic development,
and the specificity of individual fields of science, may form the basis for drawing more credible conclusions.
Bibliography
Al U., Taşkin Z., Düzyol, G. (2012). Use of Social Network Analysis in Bi -bliometric Researches. In: Information on E-motion. Proceedings.
BOB-CATSSS 2012, 20th International Conference on Information Science,
23–25 January, (s. 40–44). Amsterdam: Bock + Herchen Verlag.
Garfield, E. (1964). Science Citation Index – A New Dimension in Indexing.
Science, 144(3619), 649–654.
Juan, A.A., Daradoumis, T., Roca, M., Grasman, S.E., Faulin, J. (2012).
Collaborative and Distributed E-Research. Innovations in Technologies, Strategies and Applications. Hershey, PA: IGI Global.
Kamińska, A.M. (2017a). Od druków źródłowych po mapy nauki. Bibliogra -ficzna baza danych GRUBA [From Printed Sources to the Maps of Science.
The GRUBA Bibliographic Database]. In: M. Kowalska (ed.), V. Osińska
(ed.), Wizualizacja informacji w humanistyce [Information Visualisation in Humanities]. Toruń: Wydawnictwo Uniwersytetu Mikołaja Kopernika, 17–36.
Kamińska, A.M. (2017b). Miary podobieństw łańcuchów znakowych a dedu
-plikacja rekordów w bibliograficznych bazach danych [String Similarity Metrics and Deduplication of Records in Bibliographic Databases].
Prze-gląd Biblioteczny [The Library Review], 85(4), 477–495.
Kamińska, A.M. (2017c). ProBIT – prospektywna metoda tworzenia tra
-wersowalnych indeksów cytowań a współczesne problemy organizacji
przestrzeni informacji w tradycyjnych bibliograficznych bazach danych
[ProBIT – The Prospective Method of Creating the Traversable Citation
Index versus Contemporary Issues in Information Space Organization in
Traditional Bibliographic Databases]. Zagadnienia Informacji Naukowej [Issues in Information Science], 55(1), 66–92.
Kamińska, A.M. (2017d). Wizualizacje wybranych wskaźników bibliometrycz
-nych na przykładzie bibliograficznej bazy da-nych CYTBIN [Visualizations
of Selected Bibliometric Indicators on the Example of the Bibliographic
Database CYTBIN]. Toruńskie Studia Bibliologiczne [The Bibliological Studies of Torun], 10(2), 163–187.
Kamińska, A.M. (2018a). Visualizations of the GRUBA bibliographic database:
From printed sources to the maps of science. In: V. Osinska, G. Osinski (eds.), Information Visualization Techniques in the Social Sciences and
Humanities. Hershey, PA: IGI Global, 151–174. DOI: 10.4018/978-1-5225-4990-1.ch009
Kamińska, A.M. (2018b). Zastosowanie struktur grafowych do analiz bibliome -trycznych i webome-trycznych. Modele i metody. Nowa Biblioteka. Usługi, Technologie Informacyjne i Media [New Library. Services, Information Technologies and Media], 2(29), 47–63.
Langville, A.N., Meyer C.D. (2012). Google’s PageRank and Beyond: The Science of Search Engine Ranking. Princeton: Princeton University Press.
Newman, M. (2010). Networks. An introduction. Oxford: Oxford University Press.
Newman, M. (2001). The structure of scientific collaboration networks.
Pro-ceedings of the National Academy of Sciences of the United States of
America, 98(2), 404–409.
Sosińska-Kalata, B. (2013). Obszary badań współczesnej informatologii (nauki o informacji) [Research Domains in Contemporary Information Science].
Zagadnienia Informacji Naukowej [Issues in Information Science], 51(2), 9–42.
Tekst w wersji poprawionej wpłynął do redakcji 21 stycznia 2018r.
Anna Małgorzata Kamińska
Zakład Bibliotekoznawstwa
Instytut Bibliotekoznawstwa i Informacji Naukowej
Uniwersytet Śląski w Katowicach
e-mail: [email protected]
Zastosowanie metod analizy sieci społecznościowych w bibliometrii i webometrii
Miary i narzędzia
Abstrakt: W artykule autorka opisuje zastosowanie metod analizy sieci społecznoś
-ciowych (SNA) w dziedzinie bibliometrii i webometrii. Mimo że metody te zaczęto
stosować w różnych dziedzinach kilka lat temu, w przypadku bibliometrii i webo
-metrii nadal nie są one szeroko stosowane. W przypadku publikacji zagranicznych
podjęto próby zastosowania metod SNA, np. do analizy sieci współautorstwa, nato
-miast wyniki studiów polskiej narodowej bibliometrii sprowadzają się głównie do
form tabelarycznych.
Pierwsza część artykułu stanowi zwięzłą prezentację świata zagadnień związa
SNA w odniesieniu do zastosowań bibliometrycznych. Artykuł wieńczy przykład
praktycznego zastosowania wybranych metod pomiaru SNA w odniesieniu do bazy
danych narodowej bibliografii CYTBIN. Wizualizacje, jakie zaproponowano, umoż
-liwiają odkrycie związków reprezentowanych przez analizowane dane, które w tra
-dycyjnych tabelarycznych ujęciach z trudem można by zobaczyć (jeśli w ogóle).
Słowa kluczowe: Bibliometria. CYTBIN. Gephi. Metody pomiary. Narzędzia. Sieci społecznościowe. SNA