1
The effect of superannuation tax incentives on salary
sacrifice participation
Jun Feng
School of Economics, UNSW
ARC Centre of Excellence in Population Ageing Research, UNSW
j.feng@unsw.edu.au
Abstract
In this paper, we examine choices in voluntary superannuation contributions. In particular, we focus on salary sacrifice which could attract a tax benefit of up to 30 percentage points. This paper aims to evaluate how effective the tax incentives are in stimulating salary sacrifice participation. Using a regression discontinuity (RD) framework, we measure the response of contributors to different levels of tax concessions on salary sacrifice contributions. Results indicate that current tax incentives have a limited effect, if any, on the decision to make salary sacrifice arrangements, which is contrary to similar studies using US data. It is likely that this result is due to the complexity of the incentive schemes and competing demands for long term savings. The results provide some support for decision of the Australian government to increase the mandatory retirement saving rate from 9 to 12%.
Keywords
Retirement saving, tax incentives to save, superannuation, salary sacrifice
2
I. Introduction
With the ageing of the population, countries took various strategies to improve adequacy of retirement income by mandating compulsory savings or relying heavily on employer sponsored programs and counting on employees to top up the savings contingent on their awareness and ability to save. While mandatory systems have achieved a remarkable coverage among employees in the countries implemented, voluntary private pension schemes are less attractive to employees (Antolin & Whitehouse 2009).
The question of how to design fair and effective saving programs that increase voluntary contributions has been a challenge for many countries that are facing ageing issues. One of the common key features of voluntary private pension schemes is the use of tax incentives to encourage participation and increase the level of contributions. In the US, major tax reforms were made in the 1980s to provide incentives and regulate contributions to retirement saving account such as 401(k) and (Roth) IRA. These reforms generated substantial movements in participation in IRAs following the extension of the program in 1982 (Poterba, Venti et al. 1995) and cutback in 1986 (Power & Rider 2002).
In Australia, a number of incentives have been introduced over the years to encourage voluntary superannuation contributions (on top of the overall tax preferred nature of superannuation savings for most income earners). Unlike responses in US, the incentives were met with less enthusiasm. The participation rate in voluntary contributions in Australia decreased slightly over the past decade (ABS 1994-1995; 2001; 2009). This trend suggests a re-examination of the effectiveness of the tax incentives.
Despite the heated debate on the tax reforms among politicians and academics’ enthusiasm in evaluating the benefit of such reforms (e.g. Kusko, Poterba et al. 1994; Papke & Poterba 1995), the answer is far from conclusive. Although economic theory on taxation and savings predicts a strong positive response to tax incentives in participation (Bernheim 2002), empirical literature on the US system has shown mixed results from huge increase in participation to no significant effect based on US system. With limited experience and literature outside US and substantial differences in public pension system and tax regimes, it is hard to draw conclusions from the US
3
experience for the Australian superannuation system. Thus an evaluation of the current tax incentives is necessary and could itself contribute to the international literature in the area of use of tax concessions to stimulate private retirement savings. Given the low level of participation in voluntary contributions, especially salary sacrifice, we focus on the question of how much tax concession has lifted participation. We start with a brief introduction of the superannuation system in Australia, a survey on existing evidence on the effectiveness of tax incentives and a brief discussion on the potential problems in the analysis. In section IV, we detail evaluation strategy and establish a theoretical bench mark. The regression discontinuity results are presented in the next section and compared in section 0 with results using difference in difference and matching methods. Section VII concludes.
II. The Australian superannuation system
The current superannuation system, evolved from occupational superannuation, first expended accessibility to all the working population in 1992. The superannuation system itself is a complex multi-layer system (see Figure 1). On the first layer is the Superannuation Guarantee, a mandatory employer contribution related to individual earnings. Employers are required to make prescribed superannuation contributions (minimum 9% of the wage and salary) on behalf of their employees to a complying superannuation or pay a superannuation contribution surcharge (sum of superannuation guarantee liability, interest, administrative cost).
Figure 1 Relationship of terms for superannuation contributions
Employer contributions Employee contributions
Government contributions
Superannuation guarantee (SG)
Salary sacrifice (pre-tax contributions) Post-tax personal contributions Government co-contributions Spouse contributions
Concessional contributions Non-concessional contributions
On the second layer is the voluntary contributions aimed to top up retirement savings. Employees can make contributions to their own superannuation account or to other family member’s superannuation account (e.g. partners) through different vehicles
4
such as salary sacrifice, personal contributions and spouse contributions. These contributions are subject to various tax treatments, bounded by different contribution, age, or income limits.
In this paper, we focus on one type of voluntary superannuation contribution: salary sacrifice. A salary sacrifice arrangement is where employees agree contractually to give up part of the remuneration that they would otherwise receive as salary or wages, in return for their employer providing contributions to a complying superannuation fund of the same amount. Salary sacrifice contributions attract tax concession when contributions1 up to concessional contributions cap are made2(see Table 1). Instead of paying marginal income tax rate, contributions are taxed at a flat rate of 15%. This rate is equivalent to the tax rate of the second income bracket in 2011/12. For excess concessional contributions, however, they are taxed at 46.5% which is equivalent to the tax rate (including Medicare levy) of the highest income bracket. While some employers may provide incentives for salary sacrifice (e.g. provide matching to salary sacrifice), some may not provide salary sacrifice option at all.
Table 1 Tax rates on income, salary sacrifice contributions and benefits from superannuation (2011/12) Tax Thresholds Marginal Income Tax Rate Tax on Salary Sacrifice Contributionsa Tax on withdraw Preservation Ageb to 60 yo Above 60 yo $1-$6,000 0% 15% 15% tax credit on benefit 0% $6,001-$37,000 15% $37,001-$80,000 30% $80,001-$180,000 37% $180,001+ 45% a. Below the concessional limit
b. Preservation age is 55 in 2011/12 Source: Australian Tax Office
In addition to tax concessions on salary sacrifice, when one reaches preservation age (55yo in 2011/12) and is still working, the individual can further reduce the effective tax rate paid on salary sacrifice by making transition to retirement pension (TTR)
1
The total of employer superannuation contributions and salary sacrifice 2
5
arrangement. This arrangement allows them to supplement their income with a non-commutable income stream providing incentives for employees to stay at work. As the income stream from TTR arrangement provides 15% tax credit, by salary sacrificing the same amount into superannuation, it would reduce the effective tax rate to zero on salary sacrifice contributions while maintaining the same income leve. In this paper, we explore these unique features of Australian superannuation system in the evaluation of effectiveness of tax incentives.
III. Literature review
Policies that aimed at increasing national savings have always been in the centre of the debate. Much of the literature has focused on the US systems introduced in the 1980s. While a great effort is made in measuring the effect of various features of 401(k)s, less attention is focused on the participation and contribution in IRAs of which tax deferral is the main feature and relevant to our focus of study.
Within the limited evidence on IRA decisions, academics found some influence on the contributor status, however, fail to agree on the magnitude of the effect of tax deferral. Collins and Wyckoff (1988) used individual perception of their marginal tax rate to examine the joint decision on tax deferred composition plan (TDCD) and IRA. They estimated the elasticity of savings in IRA (TDCD) participation to be 0.24 (0.13) and concluded that an individual’s perception of their marginal tax rate has limited impact on both type of savings. In other studies, Long (1988) based on O'Neil and Thompson (1987)’s work confirmed a significant increase in the number of IRA contributors when marginal tax rates increase after controlling for individual income. Venti and Wise (1988) also examined IRA participation and contributions. They introduced a model that jointly estimates participation and contributions taking into account the IRA contribution limit. The estimation showed no effect on the contribution rate but a substantial rise in the probability to participate.
Despite differences in econometric models and measures of independent variables in the literature, the coefficient on the marginal tax rate in the estimation models may suffer from a positive bias as it is hard to disentangle the effects of the tax benefit and the income effect in cross-sectional data sets. This issue has been addressed by using multiple year data and exploring tax reforms and contribution limit change (Eaton 2002; Power & Rider 2002). With a similar strategy, by utilizing the introduction of
6
new retirement saving products or changes in contribution limits, tax effects on participation decisions in tax-exempt saving vehicles in the UK (Attanasio, Banks et al. 2004; Disney, Emmerson et al. 2010) and Registered Retirement or Home Ownership Saving Plans in Canada (Engelhardt 1996; Milligan 2003) have been evaluated.
While evidence from outside the US suggests a substantial increase in participation after product introduction or a change in the contribution limit, differences remain in the results for American population. Power and Rider (2002) concentrated on the self-employed and measure the change in the tax price of Keogh/SEP contributions. In their no-wage income sample, they found a significant tax influence where the semi-elasticity is 0.25, similar to that estimated by Collins and Wyckoff (1988). Estimates on their full sample, however, are not significant. Eaton (2002) employed a panel dataset and looked at three aspects of the tax effect: the change in the tax price of contributions, the change in gross income, and the change in taxable income. As a result they disentangled the effect of the tax incentives from the effect of income increase. Eaton concludes that there is no effect on the change in tax price, a small influence from the change in gross income and a substantial impact from the change in taxable income, suggesting that the true effect of the tax incentive is not significantly different from zero.
One of the difficulties in measuring the effect of the tax incentives of IRAs or its equivalents in these countries is that most are tax deferred saving accounts. Participants lack the knowledge of the exact discount of tax rate they could benefit by contributing to such savings vehicles. Heterogeneity lies in the fact that the tax benefits are due to both the individual’s current marginal tax rate and the marginal tax rate at the time of withdrawal. And the latter one is unknown at the time of contribution.
Evidence from other long term products that are promoted with tax incentives and have a clear tax benefit suggests that the tax incentive effect is minimal if any. Jappelli and Pistaferri (2003) looked at the life insurance market in Italy where tax incentives changed for different income groups over the years. They found a lack of response to the changes both in the decision of invest and the amount invested. Courtemanche and He (2009) measured a 25% (3.3%) increase in long-term care
7
insurance take up for eligible (all) individuals in the US following tax reforms in 1996. They argue that it would not, however, expand the market substantially given the low initial coverage, despite the relative high response among eligible individuals.
Although the empirical results are broadly in line with the theory, the differences in the magnitude of impact on various long term investments are worth further examination given the large public expenditure in the support of these schemes. In this study, we address the issues raised in the previous literature by taking advantage of the unique design of the Australian superannuation and exploring response to tax incentives using a regression discontinuity design. We hope to provide further evidence in the discussion of the use of tax incentives to promote long term investment for retirement purpose.
IV. Data and Empirical Strategy Identification strategy
We focus on one type of superannuation contribution, known in Australian as salary sacrifice, in which an employee forgone part of one’s salary in exchange for an employer contributing the same amount into one’s superannuation accounts. The unique feature of salary sacrifice for our purposes is the differential tax concession on the amount of contribution salary sacrificed.
Figure 2 Marginal Tax Rate on income and salary sacrifice (FY2009-10)
0% 10% 20% 30% 40% 50% 0 6000 35000 80000 180000 Marignal Tax Rates Annual Income
Marginal Income Tax Rate Contribution Tax Rate Contribution Tax Rate (with TTR)
8
Figure 2 shows the marginal tax rates on different income levels and tax rates on salary sacrifice contributions. If not salary sacrificed, employees are subject to tax rates of 30%, 38% and 45% on income between $35,000 and $80,000, $80,000 and $180,000, and above $180,000 respectively in financial year 2009/10. If salary is sacrificed, on the other hand, the contribution is only taxed at 15%. Furthermore, should the employee reach age 55 and make transition to retirement pension (TTR) arrangement, the effective tax rate on the salary sacrifice contribution is reduced to 0%.
It is straight forward to show that higher marginal tax rates or a lower tax rates on employer superannuation contributions should unambiguously increase the probability of making salary sacrifice contributions. Facing their annual personal income, individuals simply have to choose between (1) paying taxes at their marginal tax rate and having access to the money immediately or (2) salary sacrificing part of their income and reducing their tax liabilities. All individuals whose utility of saving more now exceeds the utility of spending now will choose to salary sacrifice, while those who are still better off on flexibility of the fund will choose not to. However, since the salary sacrificed contributions is no longer part of taxable income, the amount of salary sacrifice could alter one’s marginal tax rate; hence change the benefit for the last dollar of salary sacrifice contribution. Thus it is only accurate to measure the effect on tax incentives at the extensive margin (first dollar) rather than to the intensive marginal (amount conditional on participation). Given the low participation rate in salary sacrifice in Australia, an examination of extensive margin is more important.
Benchmark case
It is useful to ground the analysis by discussing some benchmark cases. Consider the theoretical life cycle model with recognition of different saving channels (superannuation and other saving vehicles) specified as below:
1 1 1 0 max , subject to 1 1 1 , 0 T s o T U C A r r A Y C A A A
(1)9
Whereis the discount rate,C,Yare consumption and income respectively. is the proportion of savings made to superannuation. r rs, o
rs ro
are after tax rates of return for superannuation and other savings respectively.The optimization results indicate that 1. This suggests that individuals should put all their savings in superannuation given the rate of return is better than other savings. Under this condition, the Euler equation governing an individual’s intertemporal consumption decision suggests that with an increase in the rate of return for superannuation savings, the consumption should be adjusted upwards for all the periods. Superannuation savings, however, would depend on the stronger of income effect and substitution effect.
In the case of salary sacrifice into superannuation, the prediction from this model is unclear. While the higher concession for high marginal tax rate income earners suggests a positive influence on salary sacrifice decisions, an individual could choose not to participate either because the income effect is larger than the substitution effect or that the compulsory employer contributions have already satisfied the needs for retirement savings. Hence, the effect of tax incentives is ambiguous.
Data and addressing limitations
The primary data set employed in this analysis is from Household Income and Labour Dynamic in Australia (HILDA) wave 10. It is the first time since the Simpler Super reforms of 2007 that HILDA has collected information about salary sacrifice into superannuation for the financial year. The HILDA data is complemented with repeated cross sectional data from the Survey of Income and Housing (SIH) to perform robustness checks by exploring variations in marginal tax rates over several years.
For all data sets used the selection criteria share common features. We focus our analysis on individuals who are aged 25 to 65 and are employed at the time of the study3. We further restrict the sample to individuals who do not have any business
3
For HILDA, it is restricted to individuals who are employed any time of last financial year. For SIH, it is restricted to individuals who are employed at the reference period (usually two weeks before the interview) as the data sets do not provide detailed information on past employment.
10
income since being a business owner means that one has an option to make employer contributions through his own business which has the same tax treatment as salary sacrifice.
In the analysis, we measure the effect of the tax incentive on the participation in salary sacrifice of superannuation contributions using a regression discontinuity design. This measure address two issues that previous literature have neglected: 1) the benefits to contributors are homogeneous for people in the same marginal tax rate bracket as the contributions are taxed up front at the same tax rate; 2) it disentangles the effect of the tax concession and effect of income increase through the use of regression discontinuity design.
However, there exist a few limitations that caution the interpretation of the results. The results from the regression discontinuity design rely heavily on the assumption of continuity of the forcing variable – that is annual taxable income (including salary sacrifice into superannuation)4 or age at the end of financial year (if considering the transition to retirement pension case).
It may be argued that annual taxable income can be manipulated to fit into the marginal tax rate threshold thus rendering the regression discontinuity design invalid. One way to reduce taxable income is to salary sacrifice for other items. Thus, if annual taxable income is manipulated, we should see a lower proportion of individuals who make salary sacrifice into superannuation among those who made salary sacrifice in other items. A simple tabulation from HILDA data, however, shows that while 24.37% made salary sacrifice in superannuation among those who salary sacrificed anything, only 8.88% only salary sacrificed in superannuation. In addition, the salary sacrifice decision is usually made before the end of financial year. Given uncertainty in year-end bonuses and financial market outcome, individuals do not have total control of their annual taxable income to be able to manipulate it to their desired level.
Another concern is that we may be creating a sample selectivity problem by only looking at employed individuals. In particular, the regression discontinuity design may not be valid if the decision to continue working is itself influenced by the
4
11
transition to retirement scheme. We formally test for the presence of such manipulation in regression discontinuity design by performing the McCrary (2008) test on the whole HILDA sample using local linear regression with a triangular kernel. The results on the retirement status show no evidence of a discontinuity at age 55 (p -value=0.529) with a 5 year bandwidth and triangular kernel. Hence, we cannot reject the null that the density of age is the same just below and just above the discontinuity point for the employed individuals. The above arguments point toward the conclusion that it is unlikely that the assumptions of regression discontinuity design are violated. Another limitation lies in the lack of some key information. HILDA does not collect information on deductions and exemption from assessable income. Thus we follow the same procedure as suggested in HILDA manual (Wilkins 2009; Summerfield, Dunn et al. 2011) by imputing the taxable income (including salary sacrifice in superannuation) after deduction by taking off percentage of income for relevant income intervals it falls. This may create a positive bias if those who have more deductions than imputed are the ones who are more likely to salary sacrifice.
The other piece of information that is missing is whether the employers actually offer salary sacrifice. It is not compulsory for employers to provide the option of salary sacrifice and offering salary sacrifice may increase corporate tax or other expenses, hence not all employers offer such an option. Unfortunately, there is no aggregate or micro-level data to compare with HILDA to tell if it is voluntary or involuntary that employees do not salary sacrifice. Thus the results in this analysis should be interpreted as the effect of the whole employee population rather than the treatment effect conditional on being offered the option to salary sacrifice.
Specifications
Our main empirical approach exploits the discontinuity in the maximum tax concessions attributed to salary sacrifice in superannuation at different income levels or age. Consider the regression model:
0 1
i i i
12
Where Y is an indicator of whether an employee made any salary sacrifice, x is the forcing variable (which could be income or age), and Treat is a treatment dummy that captures higher tax concessions. The treatment dummy is defined as:
0 if threshold { 1 if threshold i x Treat x (3)
The key identification assumption that underlies the regression discontinuity design is that
is a smooth (continuous) function. As discussed in the earlier section it is reasonable to assume that there is no discontinuity in the income or age variables, which implies that different tax concessions are the only source of discontinuity in salary sacrifice decisions around the thresholds.1
is the measure of the effect of tax concession on salary sacrifice decision. It is obtained by estimating the discontinuity in the empirical regression function at the point where the treatment variable switches from 0 to 1. As the tax concessions are a deterministic function of the forcing variable (income or age), we have a sharp regression discontinuity design.
The estimated treatment effect depends on how the smooth function
is estimated. As in any non-parametric estimation problem, there is a trade-off between efficiency and bias. We balance this trade-off by estimating a number of polynomial specifications for
. These include standard linear, quadratic and cubic functions, and linear and quadratic splines to account for differences in the influence of income increase on either side of the threshold. We also perform a robustness check varying the bandwidth to investigate whether the estimation is consistent with different levels of trade-offs. Another concern with non-parametric estimation is which kernel is used in the estimation, with different importance attached to the individuals around threshold. Thus, we report results with both a rectangle and triangle kernel.The binary nature of the outcome variable and our estimation strategy indicate that heteroskedasticity may be present. Thus we also estimate regression discontinuity Equation (2) on an aggregated level where income is aggregated at $1,000 intervals, age is measured in discrete age and Yis the participation rate within the interval. The estimates should be consistent if the only source of error in the model is the sampling
13
error. Following a similar procedure as used in Lemieux and Milligan (2008), we apply a goodness-of-fit test:
2 2 n k GOF X V
where2 is the sum of squared residuals and V is the sampling variance.Although it is not testable that people close to the discontinuity are similar, given the discussion in the previous section, there is no reason to believe that people around $35,000 and $80,000 or age at 54 and 55 are systematically different. Hence, the regression discontinuity estimates in the analysis measure the effect of tax concessions on salary sacrifice participation.
V. Regression discontinuity estimates Discontinuity at marginal tax rate thresholds
We now formally exploit discontinuity at the marginal tax rate threshold. Since the tax rate on salary sacrificed contributions is 15%, we focus on marginal tax rate jumps from 15% to 30% and from 30% to 38%. It can be expected that the effect at the second jump to be lower than the first, as the benefit is not as large.
We ignored the jump at 38% to 45% because of the small sample size and that individuals in the relevant income band are likely to have reached their concession contribution limit with only employer contributions. In 2009-10, the concessional contribution cap is at $25,000, with an individual’s salary as high as $180,000 (the threshold), the concessional cap would be reached if one’s employer makes a 14% employer contribution. This rate is not uncommon among high income earners.
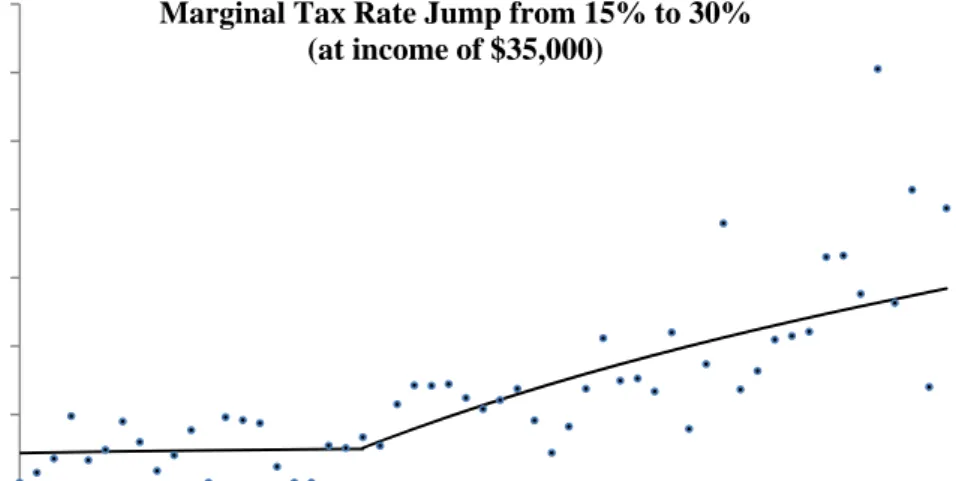
We first present some summary statistics before discussing the regression discontinuity estimates. Figure 3 shows the participation rate in salary sacrifice by income intervals at the two marginal tax rate jumps. The upper graph in Figure 3 suggests that the participation is stable when income is below $35,000 and gradually climbs as income increases. However, there is no observable jump at the threshold ($35,000). Compared to the upper figure, the lower graph exhibits a consistent pattern. The linear spline at either side of the threshold ($80,000) shows a rise in participation rate under the influence of an increase in income. But there is no obvious jump in participation and the linear spline suggests that there is a small decline at the threshold.
14
Despite this fall, both graphs suggest that the tax concessions have limited effects, if any, on participation in salary sacrifice.
Figure 3 Participation rate of salary sacrifice by income intervals (per $1,000)
Turning to the regression discontinuity estimation results, Table 2 presents the estimated effects of the tax concessions on salary sacrifice participation at two marginal tax rate jump points. Both individual and aggregated (by $1,000 interval) results are reported. The first two columns report the treatment effect for the lower threshold. At the individual level, all linear specification suggest that there is a small but insignificant increase in participation, which is equivalent to a semi-elasticity of 0.09-0.18, comparable to that of Power and Rider (2002) and Collins and Wyckoff (1988). The estimates, however, are smaller when more flexible models are used.
0% 5% 10% 15% 20% 25% 30% 35% 15 20 25 30 35 40 45 50 55 60 65 Income in Thousands
Marginal Tax Rate Jump from 15% to 30% (at income of $35,000) 0% 10% 20% 30% 40% 50% 60% 40 50 60 70 80 90 100 110 120 Income in Thousands
Marginal Tax Rate Jump from 30% to 38% (at income of $80,000)
15
None of the estimates are significant suggesting that the impact of the tax concessions is limited. The estimates at the aggregated level are of the same magnitude. Despite the estimate being positive and significant at the 10% level in the quadratic spline model, all other five models return insignificant estimates.
Table 2 RD estimates of the effect of tax concession on salary sacrifice participation
Marginal Tax Rate Jump 15% to 30% 30% to 38% Individual Levela Aggregated Levelb,c Individual Level Aggregated Level Linear 0.027 0.006 -0.035 -0.017 (0.023) (0.016) (0.049) (0.030) Quadratic 0.029 -0.009 -0.023 -0.021 (0.022) (0.012) (0.049) (0.037) Cubic -0.002 0.017 -0.080 -0.038 (0.031) (0.010) (0.066) (0.039) Linear spline 0.028 -0.004 -0.024 -0.016 (0.022) (0.011) (0.049) (0.034) Quadratic spline -0.008 0.024* -0.092 -0.014 (0.035) (0.014) (0.075) (0.050) Linear spline 0.013 0.004 -0.050 -0.021 (Triangle Kernel) (0.025) (0.009) (0.054) (0.034)
Standard errors in parentheses: * p<0.1 ** p<0.05 *** p<0.01 Income is logged in RD estimation
Rectangle Kernel is used where not indicated a. Bandwidth of logged income is 0.2
b. Income from $15,000 to $69,999 or $40,000 to $129,999 are included with $1,000 intervals c. The inverse of sampling variance is used as logged income cell weights, all goodness-of-fit tests have p-value=1.000
The last two columns show the regression discontinuity estimates for the marginal tax rate jump from 30% to 38%. As expected, the estimates are smaller than that at the jump from 15% to 30% on all specifications. In addition, the estimates are all negative, reflecting the small dip on the lower graph of Figure 3. Comparing estimates on individual and aggregated levels, they are much smaller (closer to zero) at the aggregated level than at the individual level. This, together with the fact that all the estimates are insignificant, suggests that the treatment effect at this marginal tax rate jump is also very limited.
The goodness-of-fit tests that all specifications at the aggregated level fit the data very well at both thresholds (p-value=1.00). As estimates at the individual and aggregated level yield remarkably similar results, we will focus on individual level estimates when performing robustness checks. Table 2 results have shown that the estimation
16
results are very robust to the choice of functional form for the regression equations. In Table 3, we present the regression discontinuity estimates at various bandwidths using linear spline specification with a triangle kernel. Such measure captures better the spirit of regression discontinuity by allowing only the observations that are increasingly closer to the threshold to be in the sample. The triangle kernel further emphasizes this point by assigning weights according to the distance to the threshold. The estimates in Table 3 show that the results are robust to the income window used in the estimation. The treatment effect varied from 0.013 to 0.030 at the jump from 15% to 30% and -0.065 to -0.032 at the jump from 30% to 38%, but are almost always statistically insignificant.
Table 3 Linear spline (triangle kernel) RD estimates with different bandwidth
Bandwidth (logged income)
Marginal Tax Rate Jump 15% to 30% 30% to 38% 0.1 0.013 (0.037) -0.065 (0.079) 0.2 0.013 (0.025) -0.050 (0.054) 0.3 0.028 (0.021) -0.034 (0.045) 0.4 0.030* (0.018) -0.037 (0.039) 0.5 0.027 (0.016) -0.034 (0.035) 0.6 0.024 (0.015) -0.032 (0.034) Standard errors in parentheses: * p<0.1 ** p<0.05 *** p<0.01
Using various specifications and different income windows and examining the tax concession effect on both marginal tax rate jump points, the results consistently and in most cases show insignificant estimates. Hence, we can conclude that there is a limited, if any, effect of the tax concessions on the decision to make salary sacrifice contributions into superannuation.
Discontinuity at the eligibility age for transition to retirement pension
Aside from different tax benefits due to various marginal tax rates individuals face, there is potentially another tax benefit employees could exploit if they’ve reached preservation age (55 years old for this analysis). By combining salary sacrifice contributions and transition to retirement pension (TTR) income, one could retain the same amount of income and reduce the effective tax rate on salary sacrifice contributions to 0%. In this section, we exploit this age eligibility criteria to examine the impact of tax concessions on salary sacrifice participation.
17
Among the individuals in the sample, we exclude those who earned less than $6,000 taxable income in 2009/10, as their marginal tax rate is zero. Figure 4 shows the participation rate by age. A rising trend can be easily seen between ages 25 and 55, and the participation rate declines gradually after age 55. This pattern is consistent with life-cycle theory which suggests a hump shape age-saving path. The linear smooth lines indicate that there appears to be a noticeable increase in the participation rate in salary sacrifice at the age 55 when individuals still working are eligible for TTR arrangements, suggesting a positive impact of further tax concessions.
Figure 4 Participation rate in salary sacrifice by age
The regression discontinuity estimates in Table 4 confirm such observations. As in the prior analysis of marginal tax rate differences, we look at both the individual and aggregated level where participations at each age are regressed. A number of specifications for age are presented in the results. At the individual level, all but one specification returns a positive estimate ranging from 0.023 to 0.042, implying a semi-elasticity of 0.15 to 0.26, which is of the same magnitude as previous studies (Power & Rider 2002). None of the estimates, however, are significant at the 10% level. One concern is that age is shown to be closely correlated with income levels which have a high influence on salary sacrifice participation. To exclude such influences, we control for logged income in estimating the treatment effect. Reported in the second column of Table 4, the results show a consistent positive but mostly insignificant effect. Though the estimates are significant in the linear models, the estimates are smaller than the first column when more flexible functional forms are
0% 5% 10% 15% 20% 25% 30% 35% 25 27 29 31 33 35 37 39 41 43 45 47 49 51 53 55 57 59 61 63 65 Age
18
introduced. We further look at aggregated level. The estimates are uniformly larger than at individual level, however, only in the linear spline model are the estimates significant. This pattern confirms earlier findings that tax concessions have a limited effect on salary sacrifice participation.
Table 4 RD estimates of the effect of tax concessions on salary sacrifice participation
Specification for age Individual Level Individual Level Aggregated Levela
Linear 0.026 (0.021) 0.042** (0.020) 0.057 (0.038)
Quadratic 0.023 (0.028) 0.011 (0.027) 0.029 (0.041)
Cubic 0.036 (0.032) 0.025 (0.030) 0.047 (0.038)
Linear spline 0.042 (0.027) 0.046* (0.026) 0.084** (0.040) Quadratic spline -0.012 (0.034) -0.018 (0.032) 0.015 (0.040) Linear spline (triangle kernel) 0.032 (0.027) 0.029 (0.026) 0.065 (0.040)
Covariatesb No Yes -
Note:
Standard errors in parentheses: * p<0.1 ** p<0.05 *** p<0.01 All ages (25-65) are included in the analysis
Rectangle Kernel is used where not indicated
a. The inverse of sampling variance is used as age cell weights, all goodness-of-fit tests have p-value=1.000
b. Covariates included are: gender dummy, marital status dummy and logged income Table 5 Linear spline (triangle kernel) RD estimates with different bandwidth
Bandwidth (age) ±30 0.029 (0.026) ±20 0.017 (0.027) ±10 -0.003 (0.033) ±5 -0.078 (0.049) ±4 -0.082 (0.060) ±3 -0.121 (0.084)
Standard errors in parentheses: * p<0.1 ** p<0.05 *** p<0.01 Covariates are controlled
To further examine the robustness of the conclusion that the tax concessions have a limited effect, we test the results with various age bands. The specification used is the linear spline with triangle kernel and results are reported in Table 5. The first row reproduces the results of the second column in Table 4. Narrowing down the age bands saw a decreasing trend in the treatment effect. The estimates become negative when the age band is narrowed down to 10 years. It is worth noting that the eldest included in the sample are 65 years olds and the eligible age for a transition to retirement pension is 55. The estimates with age band less than 10 years represent a balanced sample where equal number of ages is included. All of the estimates in the balanced samples are negative but insignificant. This indicates that the effect of the
19
tax concessions is smaller than observed in Table 4, but further confirms that there is only a limited, if any, impact.
Exploring marginal tax rate differences and tax deductions for transition to retirement pension, both regression discontinuity estimates show a statistically insignificant effect of the tax concessions although some of the estimates suggest a semi-elasticity around 0.20. This result is most close to the findings by Collins and Wyckoff (1988) who conclude that tax incentives have only a limited influence on participation.
Falsification tests
In this section, we present a falsification experiment to provide further evidence on the robustness of the findings. One good feature of the superannuation system is that it not only has compulsory employer contribution and a salary sacrifice component, but also allows individuals to make after-tax personal contributions. These contributions do not attract tax concessions, but the tax on investment return is only 15%. It is this design that grants us a natural falsification experiment. The mechanism behind the decision to make salary sacrifice and personal contributions are essentially the same, except that salary sacrifice contributions attract additional tax concessions. The regression discontinuity estimates should not show significant effects on personal contribution decisions.
Unfortunately, HILDA does not collect information on personal contribution decisions. Instead we use current personal contribution participation5 status as a proxy to their past financial year personal contribution behaviour. It has been shown that participation in retirement saving plans exhibit persistence (Shuey & O'Rand 2006; Enis 2010). We further restrict our sample by excluding individuals who are not currently employed, to rule out an abrupt change in financial status and to align their current and past participation status more closely.
The falsification test results are presented in Table 6. We perform falsification test on three cases: two marginal tax rate jump points and transition to retirement eligibility age. The results correspond to individual level estimates in the relevant tables (Table
5
In HILDA, they do not distinguish salary sacrifice and after tax contributions when this question is asked. Thus it is possible that some people reported making personal contributions only made salary sacrifice arrangements.
20
2-5). None of the estimates are significant, indicating that no effect is exhibited on personal contribution decisions. The most striking difference is the estimate for the marginal tax rate jump from 15% to 30%. The effects on salary sacrifice are small but mostly positive, but those on personal contributions are negative and extremely small in some specifications. The absence of significant estimates suggests that the regression discontinuity estimates presented in the above sections are valid estimates. Table 6 Falsification test: tax concession effect on personal contribution participation
MTRa jump Age eligibilityb From 15% to 30% From 30% to 38% Linear -0.009 (0.055) -0.031 (0.059) 0.011 (0.027) Quadratic -0.005 (0.055) -0.029 (0.059) 0.011 (0.038) Cubic -0.023 (0.076) -0.038 (0.078) 0.049 (0.041) Linear spline -0.006 (0.055) -0.030 (0.059) 0.058 (0.035) Quadratic spline -0.027 (0.088) -0.048 (0.088) -0.009 (0.045) Linear spline (triangle kernel) -0.015 (0.063) -0.038 (0.063) 0.040 (0.035) Standard errors in parentheses: * p<0.1 ** p<0.05 *** p<0.01
a. Logged income are used and bandwidth is 0.2
b. All ages (25-65) are included, covariates are controlled
VI. Comparing regression discontinuity and other estimation results
To further examine the robustness of the regression discontinuity results, we compare these results with estimates that exploit changes in marginal tax rates over the years. Marginal tax rates for the highest two tax brackets have been reduced over the past decade (see Table 7). We employ the last three SIH surveys to identify changes in salary sacrifice participation over the years and to explore the effect of the reduced tax concessions on participation. From Table 7, it is easy to see the pattern of participation change over the years which increased substantially from 2005/06 to 2007/08 and lowered slightly from 2007/08 to 2009/10. Such a pattern is consistent for all the tax brackets, however, the change in the participation rate is more pronounced in the higher tax brackets.
In the attempt to measure the change of participation and identify the effect due to the reduced tax concessions, we compare participation rates on the two consecutive SIH surveys. Samples are restricted to 25 to 64 years olds who are employed and do not have business income. We use perceived marginal tax rates rather than the actual marginal tax rate in the estimation, since SIH only collects estimated current year
21
income items which are used to calculate individual tax brackets. A potential bias could rise when individuals who underestimate their income are more conservative and are more inclined to save for retirement, hence the effects are underestimated. Table 7 Marginal Tax Rate and participation rate for 2005/06-2009/10
2005-06 2007-08 2009-10 Tax Bracket Tax Rate Participation Rate Tax Rate Participation Rate Tax Rate Participation Rate 0 0% 0.00% 0% 0.89% 0% 0.85% 1 15% 0.81% 15% 2.49% 15% 2.26% 2 30% 5.07% 30% 9.18% 30% 8.35% 3 42% 14.45% 40% 22.49% 38% 20.52% 4 47% 18.42% 45% 34.70% 45% 27.98% Overall 7.09% 11.27% 9.71%
Table 8 Estimates of treatment effect by different methods
05/06-07/08 07/08-09/10
Tax Bracketa Diff DID Matchingb Diff DID Matching
0 -0.000 -0.025 -0.026 -0.011 0.004 0.005 (0.000) (0.016) (0.017) (0.012) (0.018) (0.016) 1 0.011** -0.025*** -0.035*** -0.005 -0.004 -0.000 (0.006) (0.009) (0.010) (0.006) (0.009) (0.009) 2 0.031*** -0.010 (0.007) (0.006) 3 0.064*** 0.043** 0.062*** -0.013 -0.010 -0.018 (0.021) (0.017) (0.024) (0.016) (0.017) (0.019) 4 0.148*** 0.110*** 0.113** 0.015 -0.051 -0.029 (0.043) (0.037) (0.053) (0.048) (0.044) (0.052) Overall 0.042*** 0.048*** -0.011** -0.012* (0.006) (0.007) (0.005) (0.006)
Standard errors in parentheses: * p<0.1 ** p<0.05 *** p<0.01
All demographic, job attributes, housing characteristics and income information are controlled a. Base: Second tax bracket
b. pscore range used in estimation: 0.3-0.7 (05/06-07/08), 0.4-0.8 (07/08-09/10)
Due to the repeated cross sectional nature of the data, we employ a more traditional estimation strategy supplemented with a propensity score to achieve a more refined estimation. The results are reported in Table 8. All estimations control for individual’s demographic characteristics, job attributs, housing related information and various income items. The first three columns show the changes in participation for the 05/06 and 07/08 panel. Aside from the first tax bracket, all tax brackets exhibit a significant increase in the participation rate. As reflected in Table 7, the increase in participation rises with marginal tax rates. Using the marginal tax rate of 30% as a reference, the participation rates increase (decrease) substantially for higher (lower) tax brackets
22
even when the sample is restricted to more comparable observations. The last three columns present the estimation for the 07/08-09/10 period. Similar to the 05/06-07/08 period, the estimates reflect our observation from Table 7. There is a slight decrease in participation for all but the highest tax brackets. The changes, however, are all insignificant. Compared to changes for tax bracket two, there are no significant changes in salary sacrifice participation in all other tax brackets. The results remain consistent when the sample size is narrowed with the matching propensity score. The interpretation of the estimation is not straight forward. Estimators in the first column of each period represent the combined effects of time and reduced tax concession. If the time effect is the same for all brackets, then difference in difference (DID) estimators are valid estimators for the reduced tax concession. However, the less increments in participation for individuals at marginal tax rate 15% in period 05/06-07/08 suggests that the time effects vary by tax bracket for this period and the effect of reduced tax concessions could be masked by the large positive time effects. On the contrary, estimators in the period 07/08-09/10 indicate that the effect of the tax concessions is at least not significantly positive assuming similar patterns persist from the 05/06-07/08 period. Only tax bracket three had a reduced marginal tax rate in 07/08-09/10, hence only the estimator for this bracket could include the effect of the tax concessions. Assuming the absolute change in the participation rate increases with marginal tax rate as that in 05/06-07/08 period, the time effect should be between zero and the estimate of tax bracket four. The effect is positive if the time effect is smaller than -0.010 (-0.018) and otherwise negative. Since the estimate for tax bracket three is insignificant, this suggests that the effect of the tax concession is not significantly positive.
Although we are unable to use actual marginal tax rates or to disentangle the time effect from the effect of the tax concessions, the above discussion rules out a significant positive effect on salary sacrifice participation with reasonable assumptions. This conclusion is consistent with findings of the regression discontinuity analysis that the effect of tax concessions is limited, and further demonstrates the robustness of the results.
23
VII. Discussion and Conclusion
The ability to use various policy mechanisms to stimulate retirement saving is very important to the government as means to ensure elderly have a comfortable retirement life. The knowledge about the effectiveness of these policies is extremely valuable in the selection of ways to increase individual involvement in retirement savings. This paper evaluates whether tax concessions for salary sacrifice contributions have increased voluntary participation in retirement saving. Both regression discontinuity analysis and difference in difference estimation suggest that the effect of the tax concessions on the participation in salary sacrifice to superannuation is very small. However, this conclusion is not out of ordinary. Collins and Wyckoff (1988) and Chetty, Friedman et al. (2012) both examined effects of tax incentives under US context and also identified only a limited effect.
This paper offers feedback on government policy with evidence that looks beyond aggregated figures. The results provide some support for the Australian government’s decision to increase mandatory employer contribution rate in an effort to increase retirement savings. It also adds to international literature that examines how and whether tax policies can change individual behaviour in retirement savings.
Despite the lack of hard evidence on the potential obstacles to individual participation in voluntary superannuation contributions, we propose a few possible reasons that could explain this lack of responsiveness to tax incentives.
First, recent evidence shows that people have little knowledge about superannuation (Bateman, Eckert et al. 2012). There is a limited awareness among the working population of the ability to make salary sacrifice contributions and the associated tax implications. The participation rate of salary sacrifice for any purpose is around 15% of employees (ABS 2012). Though there is no official data on the percentage of employers that offer salary sacrifice, it is safe to believe that 15% is not far from participation rate among employees that are offered such options. In addition, for those who actually made salary sacrifice contributions, the tax benefits are not directly reflected in their pay slips. Similar ignorance of transition to retirement pension arrangements also exists among employees.
24
Second, there are competing demands for long term savings. The exemption of owner-occupier housing from the capital gains tax and from the Age Pension assets test encourages investment in residential property over savings in superannuation. It is a common practice that people use their earnings to pay their mortgage before saving for retirement. Given this practice, it is hard to set aside part of the salary to make salary sacrifice arrangements. Furthermore, the recent lower returns and high management costs compared to other investment opportunities and the illiquid feature of the savings make it less attractive.
Third, compared to US retirement saving policies, Australian superannuation system provides a mandatory saving mechanism to ensure that all employees have at least some savings for retirement. Many may see the mandatory employer contribution rate under the Superannuation Guarantee as ‘de facto’ advice and believe that they are already saving enough. Such beliefs, myopia and status quo bias studied in the literature (Bailey, Nofsinger et al. 2003) further exacerbate the issue and provide a barrier to individuals to explore the salary sacrifice option.
Further research could be directed at identifying and examining the main reasons behind the irresponsiveness of individuals to tax concessions and low participation rates in voluntary superannuation contributions. Such studies could facilitate the design of a more effective incentive scheme to generate greater savings for retirement.
Reference
ABS (1994-1995), Superannuation, Australia 1993, 1995, Cat. No. 6319.0, Australian Bureau of Statistics, Canberra.
ABS (2001), Superannuation: Coverage and Financial Characteristics, Australia Jun 2000, Cat. No. 6360.0, Australian Bureau of Statistics, Canberra.
ABS (2009), Employment Arrangements, Retirement and Superannuation, Australia Apr to Jul 2007 (Re-issue) Cat. No. 6361.0, Australian Bureau of Statistics, Canberra.
ABS (2012), Household Expenditure Survey and Survey of Income and Housing, Australia, 2009-10 (Second edition, CURF, RADL), Cat. No. 6540.0, Australian Bureau of Statistics, Canberra.
Antolin, P. & E. Whitehouse (2009), 'Filling the Pension Gap: Coverage and Value of Voluntary Retirement Savings', Social, Employment and Migration Working Paper, No. 69.
Attanasio, O., J. Banks, et al. (2004), 'Effectiveness of tax incentives to boost (retirement) saving: theoretical motivation and empirical evidence', OECD Economic Studies, 39.
25
Bailey, J. J., J. R. Nofsinger, et al. (2003), 'A Review of Major Influences on Employee Retirement Investment Decisions', Journal of Financial Services Research, 23(2), 149-165.
Bateman, H., C. Eckert, et al. (2012), 'Engagement: a partial solution to the annuity puzzle', Working paper.
Bernheim, B. D. (2002), Chapter 18 Taxation and saving, A. J. Auerbach & M. Feldstein, 3: 1173-1249.
Chetty, R., J. N. Friedman, et al. (2012), 'Active vs. Passive Decisions and Crowdout in Retirement Savings Accounts: Evidence from Denmark', National Bureau of Economic Research Working Paper Series, No. 18565.
Collins, J. H. & J. H. Wyckoff (1988), 'Estimates of tax-deferred retirement savings behavior', National Tax Journal, 41(4), 561-572.
Courtemanche, C. & D. He (2009), 'Tax incentives and the decision to purchase long-term care insurance', Journal of Public Economics, 93(1–2), 296-310.
Disney, R., C. Emmerson, et al. (2010), 'Tax Reform and Retirement Saving Incentives: Take-up of Stakeholder Pensions in the UK', Economica, 77(306), 213-233.
Eaton, D. H. (2002), 'The Impact of the Source of Changes in Marginal Tax Rates on Participation in Individual Retirement Accounts', The Journal of the American Taxation Association, 24(1), 46-59.
Engelhardt, G. V. (1996), 'Tax Subsidies and Household Saving: Evidence from Canada', The Quarterly Journal of Economics, 111(4), 1237-1268.
Enis, C. R. (2010), Savings and framing effects on participation in individual retirement accounts: More evidence from tax return data, 19: 29-64.
Jappelli, T. & L. Pistaferri (2003), 'Tax incentives and the demand for life insurance: evidence from Italy', Journal of Public Economics, 87(7–8), 1779-1799.
Kusko, A. L., J. M. Poterba, et al. (1994), 'Employee Decisions with Respect to 401(k) Plans: Evidence From Individual-Level Data', National Bureau of Economic Research Working Paper Series, No. 4635.
Lemieux, T. & K. Milligan (2008), 'Incentive effects of social assistance: A regression discontinuity approach', Journal of Econometrics, 142(2), 807-828. Long, J. E. (1988), 'Taxtion and IRA participation: re-examination and confirmation',
National Tax Journal, 41(4), 585.
McCrary, J. (2008), 'Manipulation of the running variable in the regression discontinuity design: A density test', Journal of Econometrics, 142(2), 698-714.
Milligan, K. (2003), 'How do contribution limits affect contributions to tax-preferred savings accounts?', Journal of Public Economics, 87(2), 253-281.
O'Neil, C. J. & G. R. Thompson (1987), 'Participation in Individual Retirement Accounts: An Empirical Investigation', National Tax Journal, 40(4), 617-624. Papke, L. E. & J. M. Poterba (1995), 'Survey evidence on employer match rates and
employee saving behavior in 401(k) plans', Economics Letters, 49(3), 313-317. Poterba, J. M., S. F. Venti, et al. (1995), 'Do 401(k) contributions crowd out other
personal saving?', Journal of Public Economics, 58(1), 1-32.
Power, L. & M. Rider (2002), 'The effect of tax-based savings incentives on the self-employed', Journal of Public Economics, 85(1), 33-52.
Shuey, K. M. & A. M. O'Rand (2006), 'Changing Demographics and New Pension Risks', Research on Aging, 28(3), 317-340.
Summerfield, M., R. Dunn, et al. (2011), 'HILDA User Manual - Release 10',
26
Venti, S. F. & D. A. Wise (1988), 'The Determinants of IRA Contributions and the Effect of Limit Changes', Pensions in the U.S. Economy, Z. Bodie, J. B. Shoven & D. A. Wise, University of Chicago Press.
Wilkins, R. (2009), 'Updates and Revisions to Estimates of Income Tax and Government Benefits', HILDA Project Technical Paper Series, No. 1/09.