The Strength of Hydrogen Bonds in Liquid Water and Around
Nonpolar Solutes
Kevin A. T. Silverstein,†A. D. J. Haymet,*,‡ and Ken A. Dill*,§
Contribution from the Department of Pharmaceutical Chemistry and Graduate Group in Biophysics, UniVersity of California, San Francisco, California 94143-1204, and Department of Chemistry, UniVersity of Houston, Houston, Texas 77204-5641
ReceiVed February 7, 2000
Abstract: The unusual properties of liquid water are usually attributed to hydrogen bonding. A longstanding question is whether the continuum of strengths of hydrogen bonds in water can be usefully simplified to two states: ‘intact’ and ‘broken’. We show that such a simplification is justified by two very different computational models of water. We then show that there is a unique value of the free energy (∆G), enthalpy (∆H), and
entropy (∆S) for breaking a hydrogen bond in pure water that gives quantitative agreement with both Raman
spectra and the known heat capacity of water: ∆G)480 cal mol-1,∆H)1.9 kcal mol-1, and∆S/k)2.4.
Breaking a water/water hydrogen bond in the first solvation shell around Argon, a nonpolar solute, leads to
∆G)620 cal mol-1,∆H)2.4 kcal mol-1and∆S/k)3.0. A prediction, not yet tested experimentally, is
that the hydrophobic heat capacity should decrease dramatically in supercooled water.
I. Introduction
Hydrogen bonding plays a key role in the properties of water. Hydrogen bonding contributes to the well-known volumetric anomalies of water: ice has lower density than liquid water, the isothermal compressibility goes through a minimum with temperature in the liquid range, and the density goes through a maximum in the liquid range. Hydrogen bonding also contrib-utes to unusual dynamic properties of water.1,2 Furthermore,
hydrogen bonding plays an important role in the “hydrophobic effect”,3which is the unusual temperature dependence of the
solvation of nonpolar solutes in water (nonpolar solvation in-volves a large negative entropy typically around room temper-ature and involves a large positive heat capacity). Recent prog-ress has been made explaining some aspects of hydrophobic phenomena4 over a large range of solute length scales5,6 and
temperatures.7,8Yet, despite the importance of hydrogen bonds
between water molecules in liquid water and around nonpolar solutes, their strengths have not yet been determined unambigu-ously by experiments.
The problem is that there has been no definitive way to distinguish a fully “intact” hydrogen bond in liquid water from a fully “broken” one.9,10 In the coldest liquid water, not all
hydrogen bonds are intact, and at the boiling point, not all hydrogen bonds are broken. So there are no reference spectral signatures of liquid water that unambiguously identify the presence or absence of a hydrogen bond. Estimates vary widely,9-20from 7%15to 60%9for the fraction f of hydrogen
bonds that are broken at 0°C. (The range is wider still in 18 older estimates compiled by Falk and Ford.)21It is even more
difficult to distinguish intact from broken H-bonds around nonpolar solutes because such solutes are usually quite in-soluble,22,23and experimental signal/noise ratios are small.
A deeper conceptual problem is whether hydrogen bonding can be meaningfully simplified into two categories, “intact” and “broken”.24 Early evidence for two states came from the
spectroscopic experiments of Walrafen,25,26 which show an
* To whom correspondence should be addressed.
†Graduate Group in Biophysics, UCSF. Present address: Computational
Biology Centers, Academic Health Center, University of Minnesota, Box 43 Mayo Bldg, 420 Delaware St., SE Minneapolis, MN 55455-0312.
‡University of Houston.
§Department of Pharmaceutical Chemistry, UCSF.
(1) Luzar, A.; Chandler, D. Phys. ReV. Lett. 1996, 76, 928-931. (2) Starr, F. W.; Nielsen, J. K.; Stanley, H. E. Phys. ReV. Lett. 1999, 82,
2294-2297.
(3) Blokzijl, W.; Engberts, J. B. F. N. Angew. Chem., Int. Ed. Engl. 1993,
32, 1545-1579.
(4) Kolomeisky, A. B.; Widom, B. Faraday Discuss. 1999, 112, 81 -89.
(5) Lum, K.; Chandler, D.; Weeks, J. D. J. Phys. Chem. B 1999, 103, 4570-4577.
(6) Southall, N. T.; Dill, K. A. J. Phys. Chem. B 2000, 104, 1326 -1331.
(7) Silverstein, K. A. T.; Haymet, A. D. J.; Dill, K. A. J. Chem. Phys.
1999, 111, 8000-8009.
(8) Silverstein, K. A. T.; Haymet, A. D. J.; Dill, K. A. J. Am. Chem.
Soc. 1998, 120, 3166-3175.
(9) Hare, D. E.; Sorensen, C. M. J. Chem. Phys. 1990, 93, 25-33. (10) Hare, D. E.; Sorensen, C. M. J. Chem. Phys. 1990, 93, 6954-6960. (11) Muller, N.; Reiter, R. C. J. Chem. Phys. 1965, 42, 3265-3269. (12) Muller, N. J. Chem. Phys. 1965, 43, 2555-2556.
(13) Hindman, J. C. J. Chem. Phys. 1966, 44, 4582-4592. (14) Luck, W. A. P. Discuss. Faraday Soc. 1967, 43, 115-147. (15) Walrafen, G. E. Water. In Water, a ComprehensiVe Treatise; Plenum
Press: New York, 1972; Vol. 1, Chapter 5.
(16) D’Arrigo, G.; Maisano, G.; Mallamace, F.; Migliardo, P.; Wander-lingh, F. J. Chem. Phys. 1981, 75, 4262-4270.
(17) Walrafen, G. E.; Hokmabadi, M. S.; Yang, W.-H. J. Chem. Phys.
1986, 85, 6964-6969.
(18) Walrafen, G. E.; Fisher, M. R.; Hokmabadi, M. S.; Yang, W.-H. J.
Chem. Phys. 1986, 85, 6970-6982.
(19) Walrafen, G. E.; Chu, Y. C. J. Phys. Chem. 1991, 95, 8909-8921. (20) Lamanna, R.; Delmelle, M.; Cannistraro, S. Phys. ReV. E 1994, 49,
2841-2850.
(21) Falk, M.; Ford, T. A. Can. J. Chem. 1966, 44, 1699. (22) Pollack, G. L. Science 1991, 251, 1323-1330.
(23) Arthur, J. W.; Haymet, A. D. J. J. Chem. Phys. 1999, 110, 5873 -5883.
(24) Eisenberg, D.; Kauzmann, W. The structure and properties of water; Oxford University Press: Oxford, 1969.
(25) Walrafen, G. E. J. Chem. Phys. 1967, 47, 114-126. (26) Walrafen, G. E. J. Chem. Phys. 1968, 48, 244-251.
8037
J. Am. Chem. Soc. 2000, 122, 8037 8041
10.1021/ja000459t CCC: $19.00 © 2000 American Chemical Society Published on Web 08/06/2000
isosbestic point in Raman spectra. More recently, other experi-mental methods have revealed isosbestic points across tempara-tures and pressures.27-29An alternative is a continuum view,30-32
which holds that hydrogen bonds in water undergo continuous distortion, but not breakage, upon heating. In support of the continuum view, other recent experiments10,33 over a broader
temperature range show some variation in the intersection points of various spectral curves, implying at the least that categories such as “intact” and “broken” represent distributions, not single configurations.
Here we show that two different models predict that water hydrogen bonding divides into two clearly distinguishable distributions that may be labeled “intact” and “broken”, or “strong” and “weak”. We then use a two-state model originated by Norbert Muller34to determine the free energy, enthalpy, and
entropy of hydrogen bonds in liquid water and around nonpolar solutes. We describe a procedure that yields the strength of a water-water hydrogen bond, and its temperature dependence, uniquely: these are the only values that are currently consistent with both the spectroscopic data and the measured heat capacities of water.
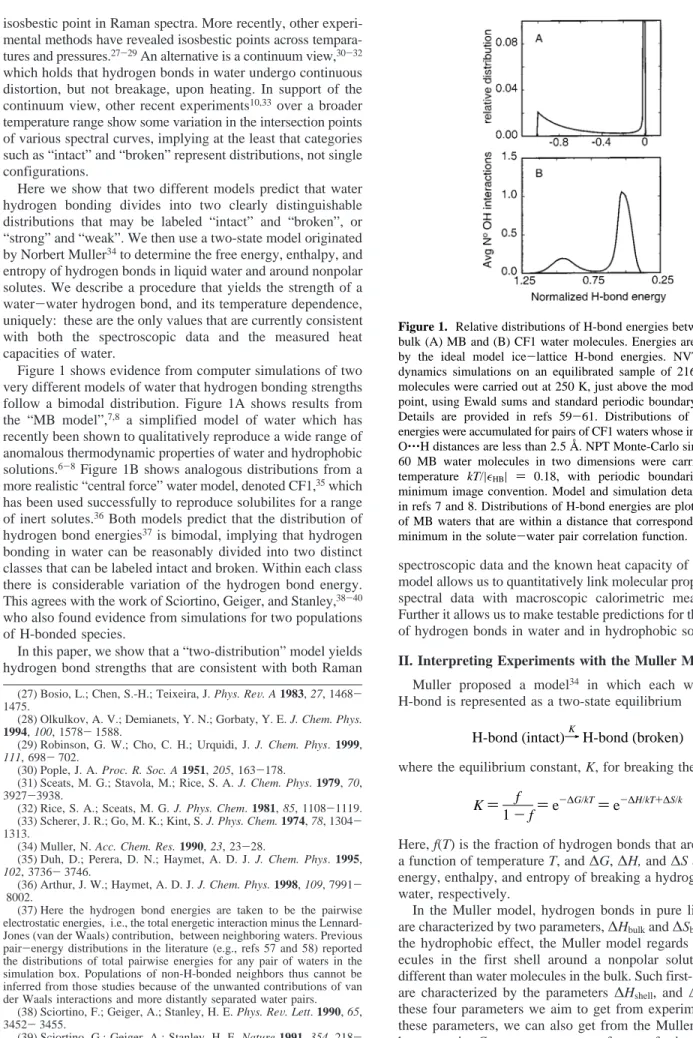
Figure 1 shows evidence from computer simulations of two very different models of water that hydrogen bonding strengths follow a bimodal distribution. Figure 1A shows results from the “MB model”,7,8 a simplified model of water which has
recently been shown to qualitatively reproduce a wide range of anomalous thermodynamic properties of water and hydrophobic solutions.6-8Figure 1B shows analogous distributions from a
more realistic “central force” water model, denoted CF1,35which
has been used successfully to reproduce solubilites for a range of inert solutes.36Both models predict that the distribution of
hydrogen bond energies37is bimodal, implying that hydrogen
bonding in water can be reasonably divided into two distinct classes that can be labeled intact and broken. Within each class there is considerable variation of the hydrogen bond energy. This agrees with the work of Sciortino, Geiger, and Stanley,38-40
who also found evidence from simulations for two populations of H-bonded species.
In this paper, we show that a “two-distribution” model yields hydrogen bond strengths that are consistent with both Raman
spectroscopic data and the known heat capacity of water. This model allows us to quantitatively link molecular properties from spectral data with macroscopic calorimetric measurements. Further it allows us to make testable predictions for the strengths of hydrogen bonds in water and in hydrophobic solutions. II. Interpreting Experiments with the Muller Model
Muller proposed a model34 in which each water-water
H-bond is represented as a two-state equilibrium
where the equilibrium constant, K, for breaking the H-bond is
Here, f(T) is the fraction of hydrogen bonds that are broken as a function of temperature T, and∆G,∆H, and∆S are the free
energy, enthalpy, and entropy of breaking a hydrogen bond in water, respectively.
In the Muller model, hydrogen bonds in pure liquid water are characterized by two parameters,∆Hbulkand∆Sbulk. To treat the hydrophobic effect, the Muller model regards water mol-ecules in the first shell around a nonpolar solute as being different than water molecules in the bulk. Such first-shell waters are characterized by the parameters ∆Hshell, and∆Sshell. It is these four parameters we aim to get from experiments. From these parameters, we can also get from the Muller model the heat capacity C at constant pressure for transferring a nonpolar solute into water, which is one of the main fingerprints of the hydrophobic effect. The Muller model assumes that the heat (27) Bosio, L.; Chen, S.-H.; Teixeira, J. Phys. ReV. A 1983, 27, 1468
-1475.
(28) Olkulkov, A. V.; Demianets, Y. N.; Gorbaty, Y. E. J. Chem. Phys.
1994, 100, 1578-1588.
(29) Robinson, G. W.; Cho, C. H.; Urquidi, J. J. Chem. Phys. 1999,
111, 698-702.
(30) Pople, J. A. Proc. R. Soc. A 1951, 205, 163-178.
(31) Sceats, M. G.; Stavola, M.; Rice, S. A. J. Chem. Phys. 1979, 70, 3927-3938.
(32) Rice, S. A.; Sceats, M. G. J. Phys. Chem. 1981, 85, 1108-1119. (33) Scherer, J. R.; Go, M. K.; Kint, S. J. Phys. Chem. 1974, 78, 1304 -1313.
(34) Muller, N. Acc. Chem. Res. 1990, 23, 23-28.
(35) Duh, D.; Perera, D. N.; Haymet, A. D. J. J. Chem. Phys. 1995,
102, 3736-3746.
(36) Arthur, J. W.; Haymet, A. D. J. J. Chem. Phys. 1998, 109, 7991 -8002.
(37) Here the hydrogen bond energies are taken to be the pairwise electrostatic energies, i.e., the total energetic interaction minus the Lennard-Jones (van der Waals) contribution, between neighboring waters. Previous pair-energy distributions in the literature (e.g., refs 57 and 58) reported the distributions of total pairwise energies for any pair of waters in the simulation box. Populations of non-H-bonded neighbors thus cannot be inferred from those studies because of the unwanted contributions of van der Waals interactions and more distantly separated water pairs.
(38) Sciortino, F.; Geiger, A.; Stanley, H. E. Phys. ReV. Lett. 1990, 65,
3452-3455.
(39) Sciortino, G.; Geiger, A.; Stanley, H. E. Nature 1991, 354, 218 -221.
(40) Sciortino, F.; Geiger, A.; Stanley, H. E. J. Chem. Phys. 1992, 96, 3857-3865.
Figure 1. Relative distributions of H-bond energies between pairs of bulk (A) MB and (B) CF1 water molecules. Energies are normalized by the ideal model ice-lattice H-bond energies. NVT molecular dynamics simulations on an equilibrated sample of 216 CF1 water molecules were carried out at 250 K, just above the model’s freezing point, using Ewald sums and standard periodic boundary conditions. Details are provided in refs 59-61. Distributions of electrostatic energies were accumulated for pairs of CF1 waters whose intermolecular O‚‚‚H distances are less than 2.5 Å. NPT Monte-Carlo simulations on 60 MB water molecules in two dimensions were carried out at a temperature kT/|HB| ) 0.18, with periodic boundaries, and the
minimum image convention. Model and simulation details are given in refs 7 and 8. Distributions of H-bond energies are plotted for pairs of MB waters that are within a distance that corresponds to the first minimum in the solute-water pair correlation function.
H-bond (intact)98K H-bond (broken) (1)
K) f
1-f)e
-∆G/kT)
e-∆H/kT+∆S/k (2)
capacity of transfer results mainly from a change in hydrogen bonding, so
where n is the number of water hydrogens in the first shell of a solute (obtained from the size and shape of the solute), and
Cshell and Cbulk are the heat capacity of the shell and bulk
H-bonds, respectively. For either bulk or shell waters, the two-state model gives41
In the past, these parameters have been obtained as fol-lows.34,42∆Hbulkand∆Sbulkwere determined using the difference
in ∆C between steam and liquid water, combined with the
estimate of Pauling43that f
bulk)0.15 at 0°C.∆Hshelland∆Sshell
were obtained by fits to the hydration enthalpy, entropy, and heat capacities of nonpolar transfer experiments. But we find that such parametrizations are inconsistent with the spectroscopic data.
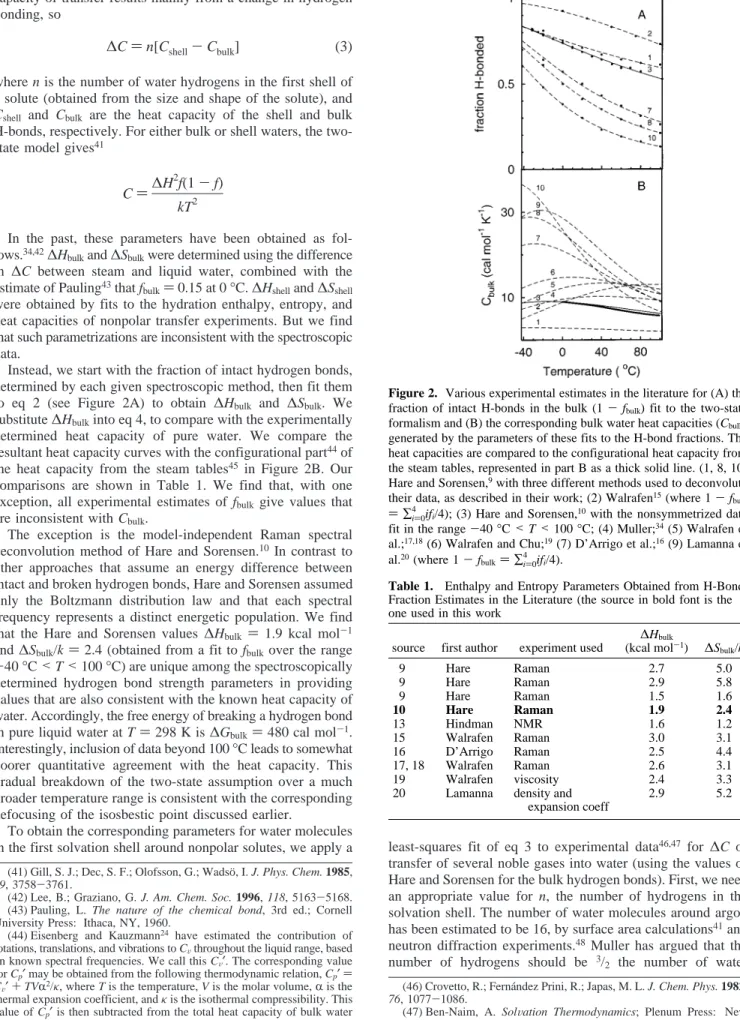
Instead, we start with the fraction of intact hydrogen bonds, determined by each given spectroscopic method, then fit them to eq 2 (see Figure 2A) to obtain ∆Hbulk and ∆Sbulk. We substitute∆Hbulkinto eq 4, to compare with the experimentally determined heat capacity of pure water. We compare the resultant heat capacity curves with the configurational part44of
the heat capacity from the steam tables45 in Figure 2B. Our
comparisons are shown in Table 1. We find that, with one exception, all experimental estimates of fbulk give values that
are inconsistent with Cbulk.
The exception is the model-independent Raman spectral deconvolution method of Hare and Sorensen.10In contrast to
other approaches that assume an energy difference between intact and broken hydrogen bonds, Hare and Sorensen assumed only the Boltzmann distribution law and that each spectral frequency represents a distinct energetic population. We find that the Hare and Sorensen values ∆Hbulk ) 1.9 kcal mol-1
and∆Sbulk/k)2.4 (obtained from a fit to fbulkover the range -40°C<T<100°C) are unique among the spectroscopically
determined hydrogen bond strength parameters in providing values that are also consistent with the known heat capacity of water. Accordingly, the free energy of breaking a hydrogen bond in pure liquid water at T)298 K is∆Gbulk)480 cal mol-1.
Interestingly, inclusion of data beyond 100°C leads to somewhat poorer quantitative agreement with the heat capacity. This gradual breakdown of the two-state assumption over a much broader temperature range is consistent with the corresponding defocusing of the isosbestic point discussed earlier.
To obtain the corresponding parameters for water molecules
in the first solvation shell around nonpolar solutes, we apply a least-squares fit of eq 3 to experimental data46,47 for∆C of
transfer of several noble gases into water (using the values of Hare and Sorensen for the bulk hydrogen bonds). First, we need an appropriate value for n, the number of hydrogens in the solvation shell. The number of water molecules around argon has been estimated to be 16, by surface area calculations41and
neutron diffraction experiments.48Muller has argued that the
number of hydrogens should be 3/
2 the number of water
(41) Gill, S. J.; Dec, S. F.; Olofsson, G.; Wadso¨, I. J. Phys. Chem. 1985,
89, 3758-3761.
(42) Lee, B.; Graziano, G. J. Am. Chem. Soc. 1996, 118, 5163-5168. (43) Pauling, L. The nature of the chemical bond, 3rd ed.; Cornell University Press: Ithaca, NY, 1960.
(44) Eisenberg and Kauzmann24 have estimated the contribution of
rotations, translations, and vibrations to CVthroughout the liquid range, based on known spectral frequencies. We call this CV′. The corresponding value for Cp′may be obtained from the following thermodynamic relation, Cp′)
CV′+TVR2/κ, where T is the temperature, V is the molar volume,Ris the
thermal expansion coefficient, andκis the isothermal compressibility. This value of Cp′is then subtracted from the total heat capacity of bulk water from the steam tables to obtain the configurational part of the heat capacity. (45) Haar, L.; Gallagher, J. S.; Kell, G. S. NBS/NRC Steam Tables; Hemisphere Publishing: Washington, DC, 1984.
(46) Crovetto, R.; Ferna´ndez Prini, R.; Japas, M. L. J. Chem. Phys. 1982,
76, 1077-1086.
(47) Ben-Naim, A. SolVation Thermodynamics; Plenum Press: New
York, 1987.
(48) Broadbent, R. D.; Neilson, G. W. J. Chem. Phys. 1994, 100, 7543 -7547. ∆C)n[Cshell-Cbulk] (3) C)∆H 2 f(1-f) kT2
Figure 2. Various experimental estimates in the literature for (A) the fraction of intact H-bonds in the bulk (1-fbulk) fit to the two-state
formalism and (B) the corresponding bulk water heat capacities (Cbulk)
generated by the parameters of these fits to the H-bond fractions. The heat capacities are compared to the configurational heat capacity from the steam tables, represented in part B as a thick solid line. (1, 8, 10) Hare and Sorensen,9with three different methods used to deconvolute
their data, as described in their work; (2) Walrafen15(where 1-f bulk )∑
i)0 4
ifi/4); (3) Hare and Sorensen,10with the nonsymmetrized data
fit in the range-40°C<T<100°C; (4) Muller;34(5) Walrafen et
al.;17,18(6) Walrafen and Chu;19(7) D’Arrigo et al.;16(9) Lamanna et
al.20(where 1-f
bulk)∑i4)0ifi/4).
Table 1. Enthalpy and Entropy Parameters Obtained from H-Bond Fraction Estimates in the Literature (the source in bold font is the one used in this work
source first author experiment used
∆Hbulk
(kcal mol-1) ∆Sbulk/k
9 Hare Raman 2.7 5.0 9 Hare Raman 2.9 5.8 9 Hare Raman 1.5 1.6 10 Hare Raman 1.9 2.4 13 Hindman NMR 1.6 1.2 15 Walrafen Raman 3.0 3.1 16 D’Arrigo Raman 2.5 4.4 17, 18 Walrafen Raman 2.6 3.1 19 Walrafen viscosity 2.4 3.3 20 Lamanna density and
expansion coeff
molecules in the solvation shell (i.e., 24 in this case). To summarize his argument, in an ideal arrangement where waters completely avoid wasting hydrogen bonds, they would straddle the solute. Three of the four tetrahedral coordination sites of each water molecule would surround the solute, and the remaining site would point out into the solution. The factor of
3/
2 arises in this ideal configuration since the hydrogens
associated with each water’s 3 coordination sites are shared by pairs of water molecules in the shell. However, real solvation shells are more disordered. Many molecules will have two sites pointing out into the solvent. So, the number of hydrogens will be less than this upper limit, but more than the number of waters. In Table 2 we demonstrate that the fitting of eq 3 for argon to obtain the shell parameters is not highly dependent on the choice of n. We use n)20, halfway between the two limits, for argon in our further discussion. Similarly, based on the known numbers of solvating waters,41 we use n) 16, 21, and 24 for neon,
krypton, and xenon, respectively.
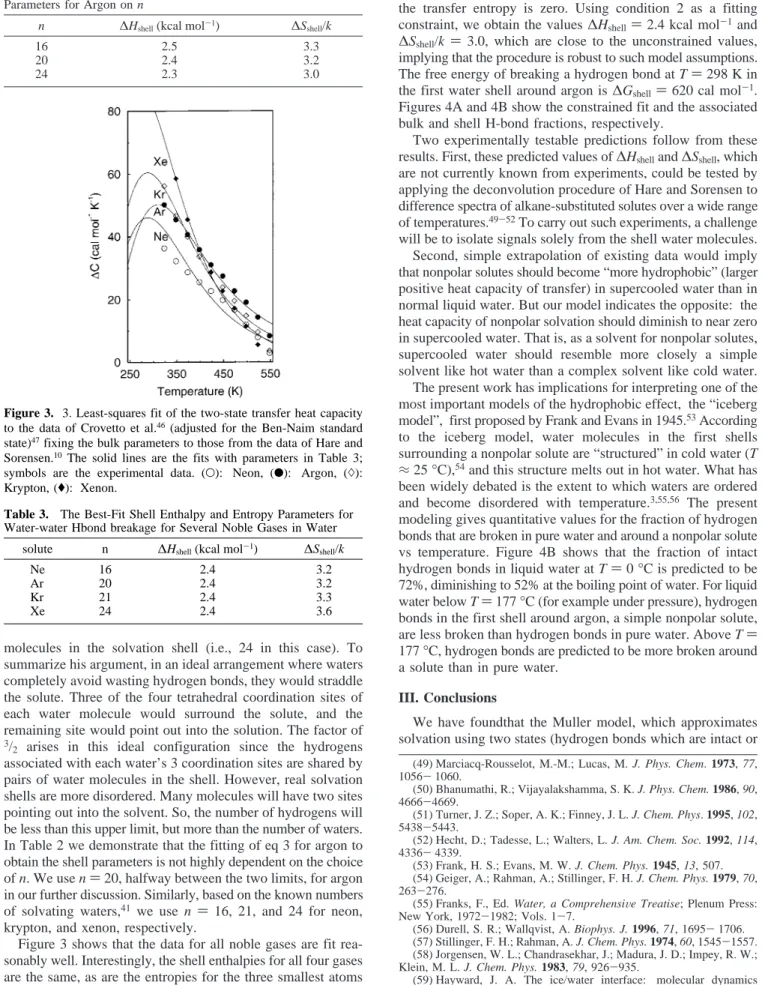
Figure 3 shows that the data for all noble gases are fit rea-sonably well. Interestingly, the shell enthalpies for all four gases are the same, as are the entropies for the three smallest atoms (see Table 3). The shell entropy is slightly larger for xenon.
Equation 3 fits the transfer data well, particularly for argon. However, MB model studies7suggest that (1) a two-state model
should not fit the data well at very low or high temperatures
and (2) fbulkand fshellshould cross at TS, the temperature at which the transfer entropy is zero. Using condition 2 as a fitting constraint, we obtain the values∆Hshell)2.4 kcal mol-1and ∆Sshell/k )3.0, which are close to the unconstrained values, implying that the procedure is robust to such model assumptions. The free energy of breaking a hydrogen bond at T)298 K in the first water shell around argon is∆Gshell )620 cal mol-1.
Figures 4A and 4B show the constrained fit and the associated bulk and shell H-bond fractions, respectively.
Two experimentally testable predictions follow from these results. First, these predicted values of∆Hshelland∆Sshell, which are not currently known from experiments, could be tested by applying the deconvolution procedure of Hare and Sorensen to difference spectra of alkane-substituted solutes over a wide range of temperatures.49-52To carry out such experiments, a challenge
will be to isolate signals solely from the shell water molecules. Second, simple extrapolation of existing data would imply that nonpolar solutes should become “more hydrophobic” (larger positive heat capacity of transfer) in supercooled water than in normal liquid water. But our model indicates the opposite: the heat capacity of nonpolar solvation should diminish to near zero in supercooled water. That is, as a solvent for nonpolar solutes, supercooled water should resemble more closely a simple solvent like hot water than a complex solvent like cold water. The present work has implications for interpreting one of the most important models of the hydrophobic effect, the “iceberg model”, first proposed by Frank and Evans in 1945.53According
to the iceberg model, water molecules in the first shells surrounding a nonpolar solute are “structured” in cold water (T
≈25°C),54and this structure melts out in hot water. What has
been widely debated is the extent to which waters are ordered and become disordered with temperature.3,55,56 The present
modeling gives quantitative values for the fraction of hydrogen bonds that are broken in pure water and around a nonpolar solute vs temperature. Figure 4B shows that the fraction of intact hydrogen bonds in liquid water at T)0°C is predicted to be 72%, diminishing to 52% at the boiling point of water. For liquid water below T)177°C (for example under pressure), hydrogen bonds in the first shell around argon, a simple nonpolar solute, are less broken than hydrogen bonds in pure water. Above T) 177°C, hydrogen bonds are predicted to be more broken around a solute than in pure water.
III. Conclusions
We have foundthat the Muller model, which approximates solvation using two states (hydrogen bonds which are intact or (49) Marciacq-Rousselot, M.-M.; Lucas, M. J. Phys. Chem. 1973, 77, 1056-1060.
(50) Bhanumathi, R.; Vijayalakshamma, S. K. J. Phys. Chem. 1986, 90, 4666-4669.
(51) Turner, J. Z.; Soper, A. K.; Finney, J. L. J. Chem. Phys. 1995, 102, 5438-5443.
(52) Hecht, D.; Tadesse, L.; Walters, L. J. Am. Chem. Soc. 1992, 114, 4336-4339.
(53) Frank, H. S.; Evans, M. W. J. Chem. Phys. 1945, 13, 507. (54) Geiger, A.; Rahman, A.; Stillinger, F. H. J. Chem. Phys. 1979, 70, 263-276.
(55) Franks, F., Ed. Water, a ComprehensiVe Treatise; Plenum Press:
New York, 1972-1982; Vols. 1-7.
(56) Durell, S. R.; Wallqvist, A. Biophys. J. 1996, 71, 1695-1706. (57) Stillinger, F. H.; Rahman, A. J. Chem. Phys. 1974, 60, 1545-1557. (58) Jorgensen, W. L.; Chandrasekhar, J.; Madura, J. D.; Impey, R. W.; Klein, M. L. J. Chem. Phys. 1983, 79, 926-935.
(59) Hayward, J. A. The ice/water interface: molecular dynamics simulations of the basal, prism,{202h1}, and{21h1h0}interfaces; Thesis, University of Sydney, 1999.
(60) Hayward, J. A.; Haymet, A. D. J. J. Chem. Phys. Submitted. (61) Hayward, J. A.; Haymet, A. D. J. Phys. Chem. Chem. Phys.
(Faraday) Submitted.
Table 2. Dependence of the Best-Fit Shell Enthalpy and Entropy Parameters for Argon on n
n ∆Hshell(kcal mol-1) ∆Sshell/k
16 2.5 3.3
20 2.4 3.2
24 2.3 3.0
Figure 3. 3. Least-squares fit of the two-state transfer heat capacity to the data of Crovetto et al.46(adjusted for the Ben-Naim standard
state)47fixing the bulk parameters to those from the data of Hare and
Sorensen.10The solid lines are the fits with parameters in Table 3;
symbols are the experimental data. (O): Neon, (b): Argon, ()):
Krypton, ((): Xenon.
Table 3. The Best-Fit Shell Enthalpy and Entropy Parameters for Water-water Hbond breakage for Several Noble Gases in Water
solute n ∆Hshell(kcal mol-1) ∆Sshell/k
Ne 16 2.4 3.2
Ar 20 2.4 3.2
Kr 21 2.4 3.3
Xe 24 2.4 3.6
broken) in the bulk and solvation shell, accounts well for the thermodynamic temperature trends of hydrophobic transfers of inert solutes. The Muller model has as its primary parameters an enthalpy gap and relative degeneracy of states for both the hydration shell and the bulk.
For pure water, we have found that only the estimate of Hare and Sorensen10 is consistent with the experimental value for
the configurational heat capacity obtained from the steam tables. Their data suggest that breaking a hydrogen bond in bulk water costs approximately 1.9 kcal/mol, and results in an entropy change of ∆Sbulk/k ) 2.4. We have used the heat capacity transfer data of Crovetto et al.46,47to estimate the two
corre-sponding hydration shell parameters. Our predictions are∆Hshell )2.4 kcal/mol and∆Sshell/k)3.0, respectively, for the enthalpy
and entropy of breaking hydrogen bonds in the first-neighbor shell of argon, a nonpolar solute. The shell enthalpy is identical for other noble gases.
Acknowledgment. K.A.T.S. was supported by a U.S. National Science Foundation Graduate Research Fellowship and a UCSF Regent’s Fellowship. We thank the NIH for grant GM34993 for support. Some calculations in this paper were performed at the SydCom, the USyd/UTS Distributed Comput-ing Facility, supported by the Australian Research Council (ARC) (Grant No. A29530010), whom we gratefully acknowl-edge. In addition, we thank Michael Johnson for installing the program NONLIN locally, Jolanda Schreurs for artistic im-provements to the figures, Dave Hare and Chris Sorensen for providing us with their data, and reviewers for helpful comments. JA000459T
Figure 4. Least-squares fit of the two-state transfer heat capacity to the experimental data for Argon, comparing the best-fit curve (dashed line,∆Hshell)2.4 kcal mol-1and∆Sshell/k)3.2) with a fit having the fbulkand fshellcurves constrained to cross at 450 K (177°C) (solid line, ∆Hshell)2.4 kcal mol-1and∆Sshell/k)3.0). (B) fbulk(solid line) and fshell(dotted line) corresponding to the solid line in part A.