Super-enhancer-mediated RNA processing revealed by
integrative microRNA network analysis
Hiroshi I. Suzuki1, Richard A Young2,3, and Phillip A Sharp1,3,4,*
1David H. Koch Institute for Integrative Cancer Research, Massachusetts Institute of Technology,
Cambridge, MA 02139, USA
2Whitehead Institute for Biomedical Research, 9 Cambridge Center, Cambridge, MA 02142, USA
3Department of Biology, Massachusetts Institute of Technology, Cambridge, MA 02139, USA
Summary
Super-enhancers are an emerging sub-class of regulatory regions controlling cell identity and disease genes. However, their biological function and impact on miRNA networks are unclear. Here we report that super-enhancers drive the biogenesis of master miRNAs crucial for cell identity by enhancing both transcription and Drosha/DGCR8-mediated primary miRNA (pri-miRNA) processing. Super-enhancers, together with broad H3K4me3 domains, shape a tissue-specific and evolutionarily conserved atlas of miRNA expression and function. CRISPR/Cas9 genomics revealed that super-enhancer constituents act cooperatively and facilitate Drosha/ DGCR8 recruitment and pri-miRNA processing to boost cell-specific miRNA production. The BET-bromodomain inhibitor JQ1 preferentially inhibits super-enhancer-directed cotranscriptional pri-miRNA processing. Furthermore, super-enhancers are characterized by pervasive interaction with DGCR8/Drosha and DGCR8/Drosha-regulated mRNA stability control, suggesting unique RNA regulation at super-enhancers. Finally, super-enhancers mark multiple miRNAs associated with cancer hallmarks. This study presents principles underlying miRNA biology in health and disease and a unrecognized higher-order property of super-enhancers in RNA processing beyond transcription.
Keywords
microRNA; super-enhancer; broad H3K4me3 domain; Drosha; DGCR8; Brd4; cancer
*Corresponding author: Phillip A. Sharp, Koch Institute for Integrative Cancer Research, Massachusetts Institute of Technology, 500
Main St., 76-461A, Cambridge, MA 02139; Phone: 617-253-6421; FAX: 617-253-3867; [email protected]. 4Lead Contact
Author Contributions
H.I.S., R.A.Y., and P.A.S. conceived and designed the research. H.I.S. performed computational and experimental analyses. H.I.S., R.A.Y., and P.A.S. analyzed the data and wrote the manuscript.
Publisher's Disclaimer: This is a PDF file of an unedited manuscript that has been accepted for publication. As a service to our
customers we are providing this early version of the manuscript. The manuscript will undergo copyediting, typesetting, and review of
HHS Public Access
Author manuscript
Cell
. Author manuscript; available in PMC 2018 March 09.Published in final edited form as:
Cell. 2017 March 09; 168(6): 1000–1014.e15. doi:10.1016/j.cell.2017.02.015.
A
uthor Man
uscr
ipt
A
uthor Man
uscr
ipt
A
uthor Man
uscr
ipt
A
uthor Man
uscr
ipt
Introduction
Gene regulation by cell-type specific enhancers is fundamental to the organization of cell identity in development and dysregulation of cellular states in diverse diseases (Lee and Young, 2013). Super-enhancers (SEs) are a new class of regulatory regions that consist of multiple enhancer-like elements occupied by high densities of master transcription factors and Mediator complexes and bearing active chromatin marks such as H3K27Ac (Whyte et al., 2013). SEs are spatially closely associated with many protein-coding genes that play prominent roles in cell identity and confer exceptional responsiveness to signaling pathways (Hnisz et al., 2013; Hnisz et al., 2015). Considerable disease-associated genome sequence variation occurs in SEs (Hnisz et al., 2013). Furthermore, expression of SE-associated genes is preferentially affected by inhibitors of several transcriptional and chromatin factors such as Brd4 and CDK7 (Kwiatkowski et al., 2014; Loven et al., 2013). Although the SE concept is useful in identifying regulatory elements important for cell type specification and disease pathogenesis, there is a paucity of mechanistic data about their formation and functions except for a few recent studies (Hay et al., 2016; Hnisz et al., 2015; Shin et al., 2016). Thus, it is still unclear whether they exhibit higher-order properties beyond a simple and linear assembly of conventional enhancers and whether SEs solely regulate transcription or also affect subsequent RNA processing (Pott and Lieb, 2015).
In addition to transcriptional factors, microRNAs (miRNAs) constitutes another key layer of maintenance of cell-type-specific transcriptomes through Argonaute (Ago)-mediated posttranscriptional gene regulation. Several cell-type-specific miRNAs are crucial for normal development and disease pathogenesis (Park et al., 2010), and a small subset of miRNAs dominates the total miRNA pool in various cell types (Landgraf et al., 2007; Marson et al., 2008), suggesting these may function as master miRNAs. In addition, high-throughput assessment of miRNA function by miRNA sensor libraries (Mullokandov et al., 2012) and Ago2 crosslinking and immunoprecipitation (CLIP) experimental platforms (Bosson et al., 2014) have revealed that in many cell types, only a few of the most abundant miRNAs dominate posttranscriptional regulation by Ago proteins. These findings highlight unique quantitative attributes of miRNA networks, i.e. unprecedentedly high expression bias and cell-type specificity. Surprisingly, relationships between SEs and miRNAs have not been studied. We postulated that SEs could account for a signal for these attributes of miRNA networks.
In this report, we performed a meta-analysis of the relationship between SEs and miRNA networks and a comprehensive functional dissection of miRNA-related SEs in multiple cell types. By integratively analyzing the connectivity between SEs and miRNAs, miRNA function, tissue-specific miRNA expression, and evolutionary conservation of miRNA networks, SEs were found to be linked with a few highly abundant and tissue-specific miRNAs, designated as master miRNAs in parallel with master transcription factors, in normal cells. In addition, widespread alterations of neighbor SEs were observed for multiple miRNA genes associated with cancer. A network-based analysis of SE composition revealed that SEs and another chromatin signature, broad H3K4me3 domains, largely shape miRNA expression hierarchy. Importantly, our functional analyses of miRNA SEs showed that SE constituents act cooperatively and boost master miRNA production by facilitating
A
uthor Man
uscr
ipt
A
uthor Man
uscr
ipt
A
uthor Man
uscr
ipt
A
uthor Man
uscr
ipt
recruitment of Drosha/DGCR8 microprocessor and pri-miRNA processing. Genome-wide chromatin binding profiles of DGCR8 and Drosha revealed that SEs are pervasively bound by DGCR8 and that associated miRNA units show active chromatin recruitment of Drosha. Interestingly, treatment of cells with the Brd4 inhibitor JQ1, which compromises SE function, suppressed DGCR8/Drosha recruitment and chromatin-associated pri-miRNA processing. Thus SEs have a higher-order property in RNA processing beyond simple transcriptional activation.
Results
Super-enhancers mark cell-type-specific and abundant miRNAs
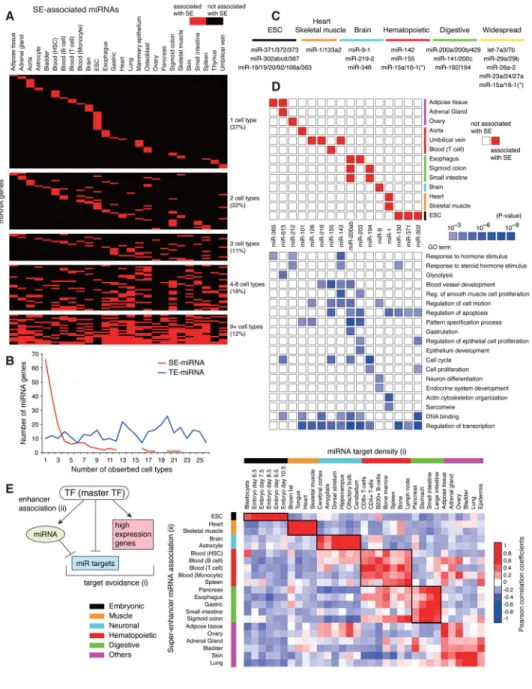
SEs regulate proximal active protein-coding genes within insulated genomic neighborhood regions (Dowen et al., 2014). Using the original definition of SEs in mouse embryonic stem cells (mESCs), defined by the occupancy of Oct4, Sox2, and Nanog master transcription factors (OSN) and Mediator (OSN-Med1 SEs) (Whyte et al., 2013), we assigned each to the most proximal promoter of genes including miRNA genes (Marson et al., 2008) (Figure 1A). Only a small subset of SEs and typical enhancers (TEs) was spatially closely associated with miRNA genes (Figure 1A and Table S1). Two ESC-specific clustered miRNA genes, miR-290-295 and miR-106a-363, important for embryonic development and mESC cell cycle progression, were identified as super-enhancer-associated miRNAs (SE-miRNAs) (Tiscornia and Izpisua Belmonte, 2010). SE-miRNAs and typical-enhancer-associated miRNAs (TE-miRNAs) dominated about 60% and 20%, respectively, of the total pool of Ago2-dependent miRNAs in endogenous Ago-null mESCs (TT-FHAgo2 cells), which express only epitope-tagged Ago2 in an inducible manner (Zamudio et al., 2014) (Figure 1B). In particular, one SE-miRNA gene, miR-290-295, dominated over 50% of the total miRNA pool. SE-miRNAs showed exceedingly high and cell-type-specific expression (Figures 1C and 1D). The Ago2 target pool identified by Ago2 CLIP analysis was also predominantly occupied with SE-miRNAs (Bosson et al., 2014) (Figure S1A). SE-miRNAs showed a high degree of Ago2-dependent target gene repression in TT-FHAgo2 cells (Figure S1B).
We next identified SE-miRNAs and TE-miRNAs in four differentiated cell types using SE classification defined by four master transcription factors in mouse progenitor B (Pro-B) cells (PU.1), myotubes (MyoD), T helper (Th) cells (T-bet), and macrophages (C/EBPα) (Whyte et al., 2013) (Table S1). Similar to mESCs, a small subset of enhancers was associated with miRNA genes (Figure S1C) and cardinal tissue-specific miRNAs were identified as SE-miRNAs (Figures 1E and S1D). These SE-miRNAs included various important cell-specific miRNAs: (1) Pro-B cells: miR-142, highly abundant in hematopoietic system, and miR-148a, important for plasma cell differentiation (Landgraf et al., 2007; Porstner et al., 2015); (2) Myotubes: miR-1/133a2, important for muscle and heart
development (Zhao et al., 2005); (3) Th cells: miR-142 and miR-210, associated with T cell differentiation (Wang et al., 2014b); and (4) Macrophages: miR-511, encoded within macrophage-specific mannose receptor (Mrc1) (Squadrito et al., 2012). SE-miRNAs were highly cell-type specific relative to TE-miRNAs (Figures 1F and S1E) and showed specific and high expression in the miRNA atlas (Figure S1F) (Kuchen et al., 2010; Landgraf et al.,
A
uthor Man
uscr
ipt
A
uthor Man
uscr
ipt
A
uthor Man
uscr
ipt
A
uthor Man
uscr
ipt
2007). In Pro-B and Th cells, overlapping SEs marked miR-142, leading to similar miRNA expression patterns in B and T cell lineages (Figure S1G). This suggests that a subset of miRNAs is driven by SEs bound by different transcriptional factors in different cell types. Collectively, these results strongly suggest that SEs are major drivers of the tissue-specific miRNome.
Super-enhancer-miRNA network and evolution
We characterized SE-miRNAs in diverse human cell types to investigate their role and conservation in health and disease. Since H3K27Ac-defined SEs (H3K27Ac SEs) largely overlap with OSN and Mediator-defined SEs (OSN-Med1 SEs) in mESCs (Hnisz et al., 2013), this histone mark is frequently used as a surrogate marker to identify SEs. Using H3K27Ac SEs, we generated a catalog of SE-miRNAs and TE-miRNAs across 26 tissue types and for 86 human cell and tissue samples including cancer cells (Table S2). These SE-miRNAs were largely type specific (Figures 2A and 2B). TE-SE-miRNAs were less type specific (Figure S2A). SE-miRNAs included many highly important human cell-specific miRNAs (Figures 2C and S2B–S2F): (1) ESC-cell-specific miRNAs: miR-371/372/373, miR-302abcd/367, and miR-106a-363; (2) muscle-specific miRNAs: miR-1/133a2; (3) neuron-specific miRNAs: miR-9, miR-219, and miR-346 (Wang et al., 2012); (4) hematopoietic-specific miRNA: miR-142 and inflammation-related miRNA: miR-155 (Kuchen et al., 2010); and (5) epithelial-specific miRNAs: miR-200a/200b/429, miR-141/200c, and miR-192/194. Interestingly, across a range of digestive organs, SEs marked miR-200a/b/429 and miR-141/200c, which play important roles in epithelial-mesenchymal transition (EMT) (Figure S2F). In addition, we observed widespread distribution of SEs around several tumor-suppressive miRNAs such as miR-15a/16-1 and let-7 miRNA families (let-7a3/7b) across diverse tissues (Figure S3), suggesting that H3K27Ac SEs mark many tissue-specific master miRNAs and additionally some tumor-suppressive miRNAs important for tissue homeostasis.
Gene Ontology analysis of experimentally validated target genes of SE-miRNAs showed that they are linked to biological processes characteristic to the respective cell and tissue types (Chou et al., 2015) (Figure 2D). As expected, SE-miRNAs were highly linked to transcription regulation, suggesting that SE-miRNAs dynamically crosstalk with master transcription factors (Figure 2D, bottom). Previous studies have shown a mutually exclusive expression pattern of miRNA and their targets in various tissues and selective avoidance of miRNA target sites in coexpressed genes (target avoidance phenomena) (Farh et al., 2005; Stark et al., 2005). Because SEs are highly associated with tissue-specific miRNAs, we further postulated that connection between SEs and miRNAs are positively associated with target avoidance phenomena. A correlation analysis between SE-miRNA connection and strength of depletion of target sites in genes coexpressed with miRNAs demonstrated a strong tissue-type-dependent positive correlation (Figure 2E). This suggests a co-evolution of factors controlling the transcriptome and SE-miRNAs in development.
Network-based understanding of super-enhancer composition
During SE-miRNA analysis, we compared the signals for Mediator and H3K27Ac used for SE discovery and found that these two marks capture slightly different miRNAs in mESCs
A
uthor Man
uscr
ipt
A
uthor Man
uscr
ipt
A
uthor Man
uscr
ipt
A
uthor Man
uscr
ipt
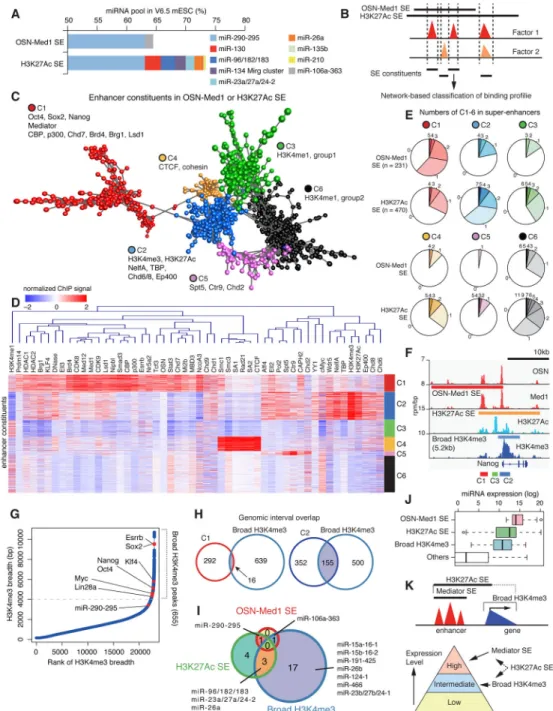
(Figure 3A). H3K27Ac SEs more broadly captured other miRNAs with intermediate expression levels, relative to OSN-Med1 SEs (Figure 3A). We next comprehensively and quantitatively compared chromatin immunoprecipitation (ChIP)-seq profiles of 64 transcription-related factors and histone marks for the promoter and enhancer regions of miRNA genes (Figures S4A–S4C) (Ang et al., 2011; Hnisz et al., 2013; Lin et al., 2011; Marson et al., 2008; Rahl et al., 2010; Schnetz et al., 2010; Whyte et al., 2013; Yue et al., 2014). In mESCs, the promoters for the top 10 highly expressed miRNA genes were bound more broadly by various transcriptional regulators relative to their enhancers, and the diversity of the binding pattern for enhancers was more skewed toward highly expressed miRNAs (Figures S4A–S4C), suggesting that promoter activation is less cell-type specific and that enhancer activity shapes a more biased miRNA expression pattern. H3K27Ac SEs marked miRNAs with a boarder pattern of promoter activation as compared to OSN-Med1 SEs (Figure S4D).
Based on these observations, we postulated that Mediator and H3K27Ac capture slightly different gene regulatory platforms. To test this hypothesis, we assembled all potential enhancer constituents included in OSN-Med1 and H3K27Ac SEs, quantitated the mESC ChIP-seq profiles of 64 transcription-related factors and histone marks for these constituents (Figure 3B and Table S3), and adopted coregulation analysis (CRA) toward network-based visualization (Figure 3C). The CRA identified several clusters with distinguishable binding patterns (clusters 1–6: C1–6) (Figure 3C). C1 enhancer constituents were densely bound by many transcription factors, Mediator, Brd4, p300, CBP, Chd7, Brg1, Lsd1, and cohesin loading factor Nipbl, indicating probable cores of SEs (Figure 3D). C2 constituents were characterized with high signals of H3K4me3, H3K27Ac, NelfA, TBP, and Wdr5, suggesting enhancer-like and transcription start site (TSS)-like signature (Figure 3D). Others included C4 characterized by CTCF and cohesin, C5 characterized by Spt5 and Ctr9, and C3/C6 with preferential enrichment of H3K4me1. We also analyzed recent ChIP-seq profiles for various chromatin remodelers and noted that C1 and C2 constituents show differential binding patterns of chromatin remodelers (Figure S4E) (de Dieuleveult et al., 2016). In addition, C1 constituents were associated with higher enhancer RNA (eRNA) production (data not shown).
C1 constituents were preferentially contained in OSN-Med1 SEs, but C2 and other
constituents were preferentially included in H3K27Ac SEs (Figure 3E). As shown in Figure 3F, H3K27Ac SEs tended to spread over the gene body and C2 constituents tended to overlap with broad H3K4me3 peaks around the TSS. Although we set the promoter exclusion zone to be 4 to 5kb in discovery of SEs according to the original definition, multiple H3K4me3 peaks were still broader than this exclusion zone, thus possibly overlapping with some SE regions. A broad H3K4me3 domain is another chromatin signature that has been recently described to link cell identity genes with the transcriptional consistency of these genes (Benayoun et al., 2014). We further compared C2 constituents and broad H3K4me3 domains. We identified 655 broad H3K4me3 peaks (> 4kb) in mESCs with standard ChIP-seq analysis approaches (Figure 3G and Table S4). Broad H3K4me3 domains were associated with many SE-marked cell identity genes such as Oct4, Sox2, Nanog, KLF4, and Esrrb and other important ES regulators such as Lin28a and Myc, which were not captured by OSN-Med1 SEs. C1 and other constituents rarely overlapped with
A
uthor Man
uscr
ipt
A
uthor Man
uscr
ipt
A
uthor Man
uscr
ipt
A
uthor Man
uscr
ipt
broad H3K4me3 peaks, however, C2 constituents showed large overlap with broad H3K4me3 domains (Figure 3H). Broad H3K4me3 domains marked several H3K27Ac SE-associated miRNAs, including miR-96/182/183, and other miRNAs with intermediate expression levels, such as miR-15a/16-1 and miR-26b (Figure 3I). Comparison of OSN-Med1 SEs, H3K27Ac SEs, and broad H3K4me3 domains showed that these entities delineate quantitative levels of major miRNAs in mESCs (Figure 3J). Therefore, from a pragmatic aspect, SE classification defined by Mediator or H3K27Ac show substantial overlap and have a simple composition, i.e. clusters of C1 Mediator-bound constituents, but also show heterogeneity in connection with broad H3K4me3 domains (Figure 3K). Their relationship to relative miRNA levels is summarized in Figure 3K.
CRISPR/Cas9 functional genomics of miRNA super-enhancers
Several recent reports have explored the contribution of the constituent enhancers of SEs to expression of mRNA transcripts, with varying results (Hay et al., 2016; Hnisz et al., 2015; Shin et al., 2016); it remains unclear whether multiple SE constituents have redundant or non-redundant functions in driving the expression of corresponding miRNAs. We performed a functional dissection of miRNA SEs in vivo by generating cell lines depleted of individual miRNA SE constituents (about 400–700 bp) in multiple cell types through a CRISPR/Cas9-based approach (Table S5). We analyzed three miRNA SEs: miR-290-295 SE in mESCs, miR-1 SE in myotubes, and miR-148a SE in Pro-B cells. Among 7 constituents of miR-290-295 SE (E1–E7, Figure 4A), deletion of individual elements except for E6 led to substantial decrease (ranging from 50% to 80%) in de novo production of mature miRNAs in TT-FHAgo2 mESC background without concomitant changes in other miRNA production (Figures 4B and S5A). A 5-fold reduction in expression upon deletion of one constituent of a group of six indicates cooperative interactions. As expected from a decrease in these miRNAs, these deletions also suppressed expression of Ago2-inducible gene Lin28a, a regulator of ES cells (Figure 4B). In the C2C12 cell line, a model for myotube
differentiation, SE was only observed for one of the two miR-1 genes (miR-1a-1/133a-2) and myotube differentiation strongly induced primary miRNAs of only this miRNA gene (Figure S5B). Deletion of all 4 constituents of miR-1 SE dramatically suppressed induction of miR-1 and miR-133 and myogenic differentiation markers such as Myogenin and muscle creatine kinase (MCK), phenocopying miR-1 knockdown phenotype (Chen et al., 2006) (Figures 4C–4D and S5C). Furthermore, in Pro-B cells, deletion of 4 out of 5 miR-148a SE constituents dynamically suppressed induction of miR-148a during differentiation and affected its downstream genes Bach2 and Blimp1 (Porstner et al., 2015) (Figures 4E and 4F). These data demonstrate that miRNA SEs actually drive corresponding cell-specific master miRNAs and affect their downstream pathways and also suggest that multiple SE constituents function in a cooperative rather than additive or redundant manner.
Super-enhancers boost pri-miRNA processing
miRNAs are generated through two steps of RNase III-dependent cleavage action: cleavage of primary miRNA transcript (pri-miRNA) to precursor miRNA (pre-miRNA) by Drosha/ DGCR8 microprocessor complex in nucleus and cleavage of pre-miRNA to miRNA duplex by Dicer in cytoplasm. We further analyzed the effects of SE deletions on efficiency of miRNA biogenesis. By comparing pri-miRNAs, pre-miRNAs, and mature miRNAs levels,
A
uthor Man
uscr
ipt
A
uthor Man
uscr
ipt
A
uthor Man
uscr
ipt
A
uthor Man
uscr
ipt
we found that deletion of several miR-290-295 SE constituents modestly (2 to 3 fold) suppressed pri-miRNA production and further attenuated the ratio of pre-miRNA and mature miRNA to pri-miRNA (2 to 3 fold) (Figure 4G). This trend was also observed for miR-1 SE in myotubes (Figure 4H). Interestingly, in Pro-B cells, the effects of deletions of SE constituents on pri-miRNAs were minor but the reductions in pri-miRNA processing were more pronounced (Figure 4I). These results suggest that SEs enhance pri-miRNA processing through an unknown process as well as transcriptional activation.
Association between super-enhancers and DGCR8/Drosha
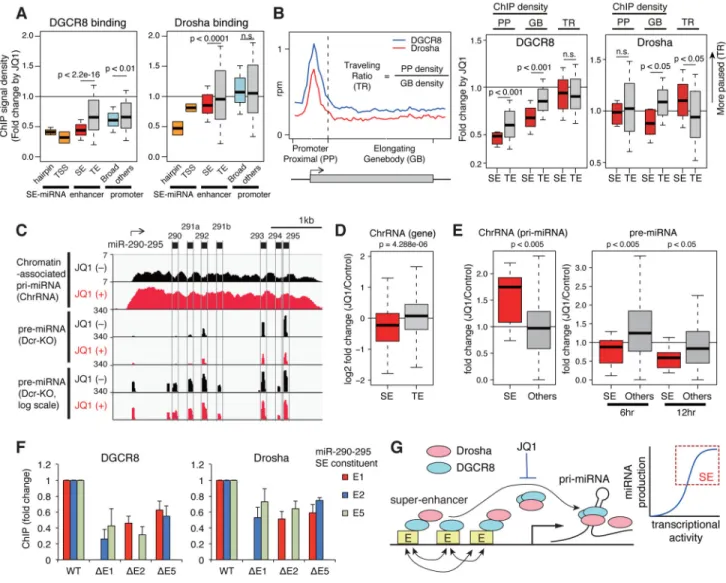
Drosha and DGCR8 are thought to be recruited cotranscriptionally and to cleave pri-miRNAs during transcription (Morlando et al., 2008; Nojima et al., 2015). Nuclear Drosha/ DGCR8-mediated pri-miRNA processing is regulated by interaction between Drosha/ DGCR8 and various transcription-related factors and RNA-binding proteins (Ha and Kim, 2014). ChIP analysis of DGCR8 and Drosha revealed that deletion of SE constituents attenuated recruitment of these two proteins to pri-miRNA loci in three cell types in accordance with the reduced efficiency of pri-miRNA processing (Figure 5A). Based on these data, we postulated that SEs provide an active platform for cotranscriptional pri-miRNA processing and verified this possibility by genome wide micrococcal nuclease (MNase) digestion-coupled ChIP-sequencing (X-ChIP-seq) for DGCR8 and Drosha (Skene and Henikoff, 2015). Among identified peaks (Figure S6A and Table S6), highly significant ChIP peaks of DGCR8 were observed for the TSS and hairpin (pre-miRNA) regions of SE-miRNAs, most SEs, and various promoter regions including broad H3K4me3 domains (Figures 5B–5C and S6B). Notably, a majority of SEs (87 %) including those associated with pluripotency genes Nanog, KLF4, Sox2, and Oct3/4 was pervasively bound by DGCR8 (Figures 5B and S6C). Drosha binding showed similar but more selected patterns for SEs (Figure 5B). Metagene plots showed enrichment of DGCR8 and Drosha in all SEs and associated TSSs (Figure 5D) but less enrichment for typical enhancers. According to classification of enhancer constituents in Figures 3B–D, we quantitated Drosha/DGCR8 binding in each constituent (Figure S6D) and found that DGCR8 ChIP profile strongly correlates with those of Mediator, Brd4, p300, and CBP, while Drosha overlaps but is biased by greater association with Pol II and Ell2 elongation factor (Figure 5E). In addition, we analyzed the relationship between Drosha/DGCR8 and mRNA stability for SE-associated genes. By analyzing degradome sequencing data (Deg-seq) in mESCs (Karginov et al., 2010), we identified multiple endonucleolytic cleavage sites, which are attenuated by Drosha depletion, for SE- and TE-associated genes (Figure 5F). The Deg-seq data identifies RNA with 5′ terminal phosphate in total cellular poly A-selected RNA. If RNA associated with SEs is processed by Drosha or Drosha-associated ribonucleases, the resulting RNA would have a terminal 5′ phosphate. Figure 5F shows that upon deletion of Drosha there is a decrease in Deg-seq reads in the substantial number of Deg-seq events in poly A RNAs from both SE- and TE-associated genes. By newly performing chromatin-associated RNA (ChrRNA) sequencing in wild-type and DGCR8 knockout mESCs, we found that,
specifically for SE-associated genes, these Drosha-enhanced Deg-seq events are associated with upregulation of chromatin-associated transcripts by DGCR8 depletion (Figure 5G). Further, RNAs from the SE-associated genes having Drosha-enhanced Deg-seq peaks have
A
uthor Man
uscr
ipt
A
uthor Man
uscr
ipt
A
uthor Man
uscr
ipt
A
uthor Man
uscr
ipt
shorter half-lives in the presence of Drosha (Figure 5G), suggesting a unexplored regulatory role of Drosha/DGCR8 in RNA stability of SE-associated genes.
Inhibition of super-enhancer-associated miRNA processing by JQ1
The BET bromodomain protein Brd4 densely occupies SEs and pharmacologic inhibition with the BET bromodomain inhibitor JQ1 leads to preferential loss of SE components and transcription activation relative to TEs, which are also occupied by Brd4, albeit at lower densities (Loven et al., 2013). We therefore quantitated the effects of JQ1 on DGCR8 and Drosha X-ChIP-seq profiles. We found that JQ1 most dramatically suppressed binding of DGCR8 to hairpin regions and TSSs of SE-miRNAs and further preferentially suppressed the binding of DGCR8 to SEs and broad H3K4me3 promoters relative to typical enhancers and promoters (Figure 6A). In contrast, selective depletion of Drosha was only observed for hairpin regions and TSSs of SE-miRNAs and SEs (Figure 6A). The loss of Brd4 leads to inhibition of RNA polymerase II pause release, and thus reduces transcriptional elongation (Loven et al., 2013). Analysis of gene body distribution of Drosha and DGCR8 revealed that distribution of Drosha into elongating gene body regions was suppressed by JQ1 for SE-associated genes, while DGCR8 was uniformly depleted across both the promoter and gene body regions (Figure 6B). This is consistent with similar ChIP-seq patterns for Drosha and Pol II (Figure 5E) and the previously reported Drosha and Pol II protein interaction (Gromak et al., 2013). To examine the direct consequences of JQ1 on miRNA processing, we
performed chromatin-associated RNA (ChrRNA) sequencing in wild-type mESCs and pre-miRNA sequencing in Dicer knockout mESCs where pre-pre-miRNAs cannot be processed and are accumulated (Figure 6C). JQ1 (500 nM) preferentially suppressed expression of
chromatin RNAs from SE-associated genes, consistent with previous findings of preferential transcription inhibition for SE-associated genes in cancer cells (Loven et al., 2013) (Figure 6D). In contrast, for SE-miRNAs, JQ1 upregulated pri-miRNAs and decreased pre-miRNAs, suggesting interference with pri-miRNA processing and subsequent pri-miRNA stabilization (Figure 6E). In addition, we found that deletions of SE constituents also attenuated
recruitment of DGCR8 and Drosha to other enhancer constituents (Figure 6F), indicating interdependency of SE constituents in miRNA processing. Collectively, these findings suggest an unanticipated and special contribution of SEs to chromatin recruitment of DGCR8/Drosha and pri-miRNA processing (Figure 6G), as discussed below. Super-enhancer-associated miRNAs in cancer
SEs associate with key oncogenes in multiple cancer types (Hnisz et al., 2013; Loven et al., 2013). We finally analyzed SE-miRNAs in 18 human cancer cells covering 9 cancer types and compared them to SE-miRNAs found in normal tissue (Figure 7A and Tables S2 and S7). The data revealed widespread changes in SE distribution around multiple cancer-related miRNAs: i.e. (1) SE loss in over 2 cancer types, (2) SE gain in over 2 cancer types, (3) complex pattern: gain or loss in multiple cancer types, (4) relatively specific loss, and (5) specific gain of SE around miRNA genes (Figure 7A). By analyzing a database for the experimentally verified oncogenic and tumor-suppressive miRNAs (Wang et al., 2014a), miRNAs with SE gain in cancer cells were biased toward miRNAs with oncogenic roles, and SE loss correlated with tumor-suppressive miRNAs (Figure 7B). These changes included SE loss for miR-9 in glioblastoma cells, which is brain-specific and decreases during
A
uthor Man
uscr
ipt
A
uthor Man
uscr
ipt
A
uthor Man
uscr
ipt
A
uthor Man
uscr
ipt
glioblastoma progression (Kim et al., 2011) (Figure S7A), and SE loss for miR-15a/16-1, a tumor suppressive miRNAs, observed in multiple cancer cells with hematopoietic
malignancies (Figure S7B).
Cancer is a complex disease characterized by a number of hallmark biological capabilities, including resistance to cell death, acquisition of invasive or metastatic potential, and induction of angiogenesis (Hanahan and Weinberg, 2011). Comprehensive Gene Ontology analysis of miRNA target genes (Wang et al., 2014a) showed that the target genes of well-studied cancer-related miRNAs with SE alterations are associated with the full spectrum of cancer hallmarks (Figures 7C and 7D). In addition, several miRNAs with SE alterations, that have been recently reported as cancer-related miRNAs, are also linked to wide aspects of cancer hallmarks (Figure S7C) (Suzuki et al., 2015).
We further investigated whether SE-miRNAs can be used as biomarkers. By analyzing the prognostic impacts of SE-miRNAs in the database of pancreatic cancer, colon cancer, and breast cancer derived from The Cancer Genome Atlas (TCGA), we found that miRNAs with SE gain, in pancreatic cancer cell, colon cancer cell, and basal-like breast cancer cell, have an increased prognostic value in these cancer types, relative to miRNAs with SE loss (Figure 7E). These miRNAs with SE gain tended to show an association with worse prognosis (Figure 7F), suggesting that upregulation of these miRNAs can contribute to progression of certain cancer types. We further used SE-miRNAs with increased individual prognostic values to generate a possible combined stratifier for survival analysis and observed that high score of the miRNA signature represents worse prognosis (Figure 7G). In pancreatic cancer, these prognostic miRNAs included miR-10a, miR-31, and miR-30a, that have not been well characterized in this cancer type, but documented to mediate tumor progression in other cancer types (Lund, 2010) (Figure S7D). Further, in pancreatic cancer cells, loss of SE for the EMT-related miRNA, miR-200a/200b/429, was also observed (Figure S7D), but had less statistical power. Taken together, this is strong evidence that changes in SEs are a major force in cancer progression and that quantification of miRNAs and associated SEs could be of prognostic value.
Discussion
SEs are a new class of gene regulatory platforms controlling cell identity and disease genes. We have integratively investigated the roles of SEs in miRNA networks and miRNA biogenesis. From multiple aspects including expression, function, and evolution, SE association is a central principle governing cell-specific miRNA networks. For example, the relationship with target avoidance suggests that SEs are part of a homeostatic system that controls hierarchy and centricity of cell-type-specific gene regulatory networks. From network-based analysis of SE composition, we also observed that SEs are frequently associated with broad H3K4me3 domains for cell identity genes and that broad H3K4me3 peaks are associated with miRNAs with intermediate expression levels, consistent with the association between broad H3K4me3 peaks and marginally high expression (Benayoun et al., 2014). Thus, broad H3K4me3 domains may be involved in gene networks in a more widespread manner than SEs.
A
uthor Man
uscr
ipt
A
uthor Man
uscr
ipt
A
uthor Man
uscr
ipt
A
uthor Man
uscr
ipt
Identification of SE-associated miRNAs in diverse human tissues in this study will hopefully provide a valuable resource to use them for diagnosis and manipulation of target cell populations in regenerative medicine and synthetic biology. The relationships between SEs and miRNAs in cancer further validate the critical role of changes in miRNA activity in this disease. Gain of SEs near oncogenic miRNAs in cancer correlates strongly with poor prognosis, suggesting that miRNA regulation contributes importantly to the malignant state and could be a prognostic marker in cancer. In most cases, the process generating these SEs during development of cancer have not been studied. It was recently reported that a somatic mutation of a noncoding intergenic element creates a SE upstream of the TAL1 oncogene in a subset of T-cell acute lymphoblastic leukemia (Mansour et al., 2014).
Chromatin regulators and transcriptional regulators such as Brd4 and CDK7 are emerging attractive targets in cancer therapy. These drugs preferentially inhibit the activity of SEs versus TEs, indicating that the former has a cooperative dependence on the targeted biochemical processes. SEs are known to be associated with key oncogenes and provide a molecular basis for cancer-specific effect of inhibition of Brd4 or CDK7 (Kwiatkowski et al., 2014; Loven et al., 2013). Our study demonstrated a novel effect of JQ1: inhibition of pri-miRNA processing for SE-miRNAs (see below). Considering that multiple miRNAs with SE gain in cancer cells are known to be oncogenic, suppress cell death, and promote
proliferation and metastatic spread, this novel activity of JQ1 may also partially justify the observed response of many cancers to inhibition by the above drugs.
Our functional studies of miRNA-associated SEs revealed several unique characteristics of SEs. Most recent SE functional studies have reported cooperativity between multiple enhancer constituents (Hnisz et al., 2015; Shin et al., 2016), while another report described only additive effects (Hay et al., 2016). Our results suggest that at least some miRNA SE constituents act combinatorially and interdependently to control their associated miRNAs. Further, our study unveiled a novel dimension of higher-order cooperativity of multiple enhancer elements: i.e. regulation of miRNA processing.
Detailed analysis of chromatin recruitment of DGCR8 and Drosha suggests a new model of SE-associated miRNA processing (Figure 6G). In this model, the constituents of SEs recruit these two co-factors for enhanced processing of pri-miRNAs to pre-miRNAs. Consistent with this, we found that SEs are preferentially bound by DGCR8 and Drosha independent of whether they are associated with miRNA genes. Considering a recent structure of Drosha/ DGCR8 complex (Kwon et al., 2016), recruitment of DGCR8 to SEs should initiate identification of RNA substrates including apical regions of pri-miRNAs and thus enhance the effectiveness of Drosha in recognition of pri-miRNA stem structures. Although DGCR8 recruitment typically spans the SE region, Drosha binding is more concentrated over the gene body perhaps to do simultaneous interactions with RNA. Thus, Drosha-mediated pri-miRNA recruitment and cleavage is probably partially coupled to Pol II elongation. This is consistent with the strong correlation of ChIP-seq signals for Drosha, Pol II, and Ell2. Importantly, both JQ1 treatment and deletion of single constituents of SEs reduced the association of DGCR8/Drosha with SE-miRNA loci and the efficiency of processing of pri-miRNAs to pre-pri-miRNAs. Both of these perturbations impact the cooperativity of SE
A
uthor Man
uscr
ipt
A
uthor Man
uscr
ipt
A
uthor Man
uscr
ipt
A
uthor Man
uscr
ipt
formation, suggesting that assembly of the SE and associated eRNAs may signal the recruitment of these factors. This may also be related to recent reports that both HP1BP3, a chromatin associate protein, and hnRNPA2B1, a nuclear RNA binding protein, bind DGCR8/Drosha and mediate chromatin recruitment and pri-miRNA binding, respectively (Alarcon et al., 2015; Liu et al., 2016). The association of SEs with DGCR8 and Drosha may have broader implications in processing of RNA precursors. Drosha-enhanced total cell mRNA degradation events have been identified with many SE-associated genes, and are also associated with DGCR8-dependent suppression of chromatin-associated SE-gene products. This correlates with a mRNA having a short half-life, a common feature of regulatory genes such as transcription factors. Thus there maybe a new miRNA-independent function of Drosha/DGCR8 in control of SE function which could be mediated by association with other mRNA stability regulators, given a recent report for an interaction between DGCR8 and exosome complexes (Macias et al., 2015). Drosha/DGCR8-mediated fine regulation of SE-associated transcripts may empower flexibility to a SE system by facilitating resolution of a master transcription factor network when shifting to other cell states. m6A mRNA
methylation of pluripotency genes has also been suggested to enhance rewiring of pluripotency network toward differentiation in ESC (Geula et al., 2015). Perhaps, higher-order cooperativity of SEs and association with RNA processing steps detailed here for miRNA genes will also be manifested in a range of cotranscriptional RNA processing events including RNA splicing and RNA modification. Further analysis of SEs may revise
conventional enhancer models and provide new molecular insights for transcriptional perturbation in cancer therapy.
STAR METHODS
CONTACT FOR REAGENT AND RESOURCE SHARING
Further information and requests for resources and reagents should be directed to and will be fulfilled by the Lead Contact, Phillip A. Sharp ([email protected]).
EXPERIMENTAL MODEL AND SUBJECT DETAILS
Cell culture—V6.5 mESCs, DGCR8 knockout mESCs, and Dicer knockout mESCs were cultured in Dulbecco’s Modified Eagle’s Medium (Thermo Scientific) supplemented with HEPES pH 7.0, 15% fetal bovine serum (FBS), 1000 U/ml leukemia inhibitory factor (Chemicon/Millipore), 0.1 mM l-glutamine, penicillin and streptomycin, and 0.11 mM β -mercaptoethanol. TT-FHAgo2 mESCs lack all endogenous Argonaute proteins (Ago1–4) and express only tagged Ago2 (FHAgo2) in a doxycycline-inducible manner (Zamudio et al., 2014). TT-FHAgo2 mESCs were maintained in standard mESC culture conditions with 0.1 μg/ml doxycycline (Dox, Sigma). In TT-FHAgo2 mESCs, FHAgo2 was induced by 48 hr Dox treatment (2.5 μg/ml) after 96 hr Dox starvation. C2C12 cell line was obtained from the American Type Culture Collection (ATCC) and grown under typical C2C12 myoblast conditions. Myotube formation of C2C12 cells was induced by 72 hr treatment of DMEM with 2 % horse serum (Thermo Scientific) and 1x selenium, transferrin, and insulin. 38B9 Pro-B cell line was maintained in RPMI1640 medium supplemented with 10% FBS and β -mercaptoethanol. 38B9 cells were stimulated with imatinib (Sigma, 1 μM) for 4 days. JQ1 was kindly provided by James Bradner, Dana Farber Cancer Institute.
A
uthor Man
uscr
ipt
A
uthor Man
uscr
ipt
A
uthor Man
uscr
ipt
A
uthor Man
uscr
ipt
METHOD DETAILS
CRISPR/Cas9 functional genomics—SE constituents (400–700 bp) were deleted in TT-FHAgo2 mESCs, C2C12 myoblasts, and 38B9 Pro-B cells using CRISPR/Cas9 system. In mESCs, three plasmids, pS001 containing CAG promoter and Cas9, modified from pX330, and two sgRNA vectors containing U6 promoter-sgRNA cassette and PGK-puroR or PGK-blastR (pGL3-U6-sg-PGK-PuroR and pGL3-U6-sg-PGK-blastR), were transfected into cells using Lipofectamine 2000. 1 day after transfection, cells were replated and 24 hrs later selected by puromycin (2 μg/ml) and Blasticidin S (5 μg/ml) for 3 days. Subsequently, puromycin and Blasticidin S were withdrawn to allow individual clones to grow up. Clones were picked and verified by PCR genotyping and sequencing. For deletion of enhancer constituents in myoblast and Pro-B cells, two Cas9 vectors (pS002 containing U6-sgRNA and CAG-Cas9-P2A-puroR and pS003 containing U6-sgRNA and CAG-Cas9-P2A-blastR) modified from pX330 were used. These vectors containing two sgRNAs were introduced into C2C12 and 38B9 cells using Lipofectamine 2000 and Nucleofector, respectively. After selection with puromycin (2 μg/ml) for 3–4 days, the remaining cells were isolated as clones and verified by PCR genotyping and sequencing. The sgRNA sequences and sequences of deleted regions are described in Table S5.
RNA expression analysis—qRT-PCR assays were performed for evaluation of the expression levels of genes and primary, precursor, and mature miRNAs, as previously described (Suzuki et al., 2009). Total RNA and small RNA fraction were extracted by miRNeasy Mini Kit (Qiagen). For detection of genes and primary miRNAs, total RNA was subjected to reverse transcription using random hexamers and SuperScript III First-Strand Synthesis System (Invitrogen) according to the manufacturer’s instructions. qRT-PCR was performed using PowerUp SYBR Green Master Mix (Thermo Scientific) and the 7500 Fast Real-Time PCR System (Applied Biosystems). Mature miRNAs were quantitated using total RNA, Mir-X™ miRNA qRT-PCR SYBR® Kit (Clontech), and the primers identical to sequences of mature miRNAs. For detection of pre-miRNAs, small RNA fraction was subjected to reverse transcription with miScript RT II kit (Qiagen) and HiFlex buffer and analyzed using miScript SYBR Green PCR kit and miScript Precursor assays (Qiagen). Results were normalized to GAPDH or U6. The primer sequences used are described in Table S5.
DGCR8/Drosha ChIP-qPCR and X-ChIP sequencing—ChIP-qPCR analysis was performed according to our previous report (Suzuki et al., 2009). MNase ChIP-seq (X-ChIP-seq) was performed as previously developed (Skene and Henikoff, 2015). Cells were treated with DMSO or JQ1 (500 nM) for 12 hrs before ChIP-seq analysis. Cells were crosslinked for 10 min at room temperature by the addition of one-sixth of the volume of 6 % formaldehyde solution (diluted from methanol-free formaldehyde (Thermo Scientific)) to the growth media followed by 5 min quenching with 250 mM glycine. Cells were washed twice with cold PBS, then the supernatant was aspirated and the cell pellet was flash frozen in liquid nitrogen. Frozen crosslinked cells were stored at −80 °C. Cell pellets were resuspended in ChIP Lysis buffer and ChIP Dilution buffer, treated with MNase for 30 min at 37 °C followed by quenching with EDTA and EGTA, and further sonicated for 10 cycles at 30 s each with BioRupter. MNase-digested and sonicated lysates were cleared, incubated
A
uthor Man
uscr
ipt
A
uthor Man
uscr
ipt
A
uthor Man
uscr
ipt
A
uthor Man
uscr
ipt
overnight at 4 °C with 10 μg DGCR8 or Drosha antibody, and further incubated with pre-washed Dynabeads Protein G (Thermo Scientific) for 2 hrs. Beads were pre-washed two times with sonication buffer, one time with sonication buffer with 500 mM NaCl, one time with LiCl wash buffer, and one time with TE with 50 mM NaCl. After resuspension in elution buffer and reversal of crosslink at 65 °C overnight, RNA and protein were digested using RNase A and Proteinase K, respectively, and DNA was purified with phenol chloroform extraction and ethanol precipitation. After end-repair and A-tailing, ChIP DNA or whole cell extract DNA (50 ng) were ligated to diluted Illumina Adaptor Oligos and size-selected by two step AMPure bead selection (0.9x and 1.8x). After 16 cycle amplification with Phusion HF DNA polymerase, libraries were size-selected with 1.8x AMPure beads and analyzed by Illumina HiSeq 2000 for 40 bases in single end read mode. Reads were aligned to the mouse genome build mm9 using bowtie 1.0.1 (Langmead et al., 2009). The following parameters were used: −n 2, −e 70, −m 1, −k 1, and −l 40. ChIP-seq peaks were called using MACS version 1.4.2. (model-based analysis of ChIP-seq) (Zhang et al., 2008) with a p value threshold of enrichment of 1 x 10⁻⁶. ChIP-seq read density was calculated as described in (Hnisz et al., 2013; Whyte et al., 2013).
Traveling ratio, Degradome sequencing, and mRNA half-life—Drosha/DGCR8 traveling ratio (TR) was calculated according to the previous report (Rahl et al., 2010) with minor modification. We calculated the TR by dividing the average read number in promoter-proximal H3K4me3 peaks including TSS by that on the gene body (H3K4me3 peak at TSS to 2 kb downstream of the end of gene) for DGCR8-bound or Drosha-bound genes. We analyzed Deg-seq data from (Karginov et al., 2010). We calculated Deg-seq read abundance at Deg-seq peaks in mESCs for Deg-seq libraries with/without Drosha depletion, and determined Deg-seq peaks, which read abundance decreased in Drosha-KO library, as Drosha-enhanced Deg-seq peaks. Genome-wide mRNA half-life data in mESCs was from (Sharova et al., 2009).
Chromatin-associated RNA sequencing—Cells were treated with DMSO or JQ1 (500 nM) for 12 hrs before fractionation. Cellular fractionation was performed according to the following procedures. Briefly, cells were trypsinized, washed with cold PBS, and
resuspended in cold lysis buffer (10 mM Tris pH 7.4; 150 mM NaCl; 0.15% NP-40; RNase inhibitor). After 5 min incubation on ice, the suspension was layered over 1 ml sucrose buffer (10 mM Tris pH 7.4; 150 mM NaCl; 24% sucrose) and centrifuged (5 min, 3500 g). After removal of supernatant, nuclei pellet was briefly rinsed with cold PBS, resuspended in 250 μl Glycerol buffer (20 mM Tris pH 7.4; 75 mM NaCl; 0.5 mM EDTA; 50% Glycerol), and mixed with 250 μl nuclear lysis buffer (10 mM Tris pH 7.4, 7.5 mM MgCl2, 0.2 mM EDTA, 0.3 M NaCl, 1 M Urea, 1% NP-40) by vortexing for 4 sec. After 2 min incubation on ice, samples were centrifuged for 2 min at full speed. The remaining chromatin pellet was rinsed with cold PBS and resuspended in QIAzol lysis agent. RNA was extracted using QIAshredder and miRNeasy Mini Kit (Qiagen). After removal of rRNA by Ribo-Zero rRNA removal kit (Illumina), DNA libraries were generated using TruSeq Stranded Total RNA LT Sample Prep Kit and analyzed by NextSeq. Reads were mapped to mm9 assembly and ChrRNA abundance at gene level was estimated using TopHat (version 2.0.12.) and Cufflinks (version 2.2.0.) (Trapnell et al., 2012). For quantification of pri-miRNAs, reads
A
uthor Man
uscr
ipt
A
uthor Man
uscr
ipt
A
uthor Man
uscr
ipt
A
uthor Man
uscr
ipt
were mapped to mm9 assembly with bowtie 1.0.1 (Langmead et al., 2009), allowing two mismatches, and quantitated as the numbers of reads that mapped to pre-miRNA and flanking 100 base pair regions in a reads per million scale.
Precursor miRNA sequencing—Cells were treated with DMSO or JQ1 (500 nM) for 6 or 12 hrs. Small RNA fraction from Dicer KO mESCs was extracted by miRNeasy Mini Kit (Qiagen). Small RNA fraction was subjected to library preparation using the NEBNext Small RNA Library Prep Set for Illumina (New England Biolabs) and analyzed by Illumina HiSeq 2000. Sequences from the Illumina HiSeq 2000 Sequencing system were processed for adaptor removal and size exclusion of sequences < 15 nt with Cutadapt. Filtered reads were mapped to mm9 assembly with bowtie 1.0.1 (Langmead et al., 2009), allowing two mismatches. Pre-miRNA expression levels were computed as the number of reads that mapped to pre-miRNA in miRBase v18..
Computational methods for super-enhancer-associated miRNAs in mESCs and mouse cell types
Super-enhancers in mouse cell types—Genomic coordinates of SEs and TEs in five mouse cell types (ESCs, Pro-B cells, myotubes, Th cells, and macrophages) were
downloaded from (Whyte et al., 2013). All analyses were carried out using RefSeq
(NCBI37/mm9) mouse gene annotations. ChIP-seq profiles were presented using a reads per million per base pair (rpm/bp) scale.
Assigning enhancers to miRNA genes—To assign each enhancer to a gene and a miRNA gene, we calculated the distances from the center of the enhancer to the TSS of each gene (NCBI37/mm9) and the center of promoter of each miRNA gene, which was
previously defined in a systematical manner (Marson et al., 2008). The enhancer was then assigned to the closest gene and the closest miRNA gene. To identify enhancer-associated miRNAs, we calculated the linkage score (S) between miRNA genes and enhancers by the following formula: S (b/a) = (Y−X) / (X+Y), where X and Y are the distances from the enhancer to the closest miRNA gene and the closest gene, respectively. In Figure 1A, parameters a and b correspond to (X+Y) / 21/2 and (Y−X) / 21/2, respectively. In Figure 1B, for each miRNA gene, only the closest enhancer was considered, and expression levels of the closest miRNAs from each enhancer in TT-FHAgo2 ESC cells were plotted versus the linkage score. Since we observed an increase of cumulative distribution curve around S value 0.2 for typical enhancers, we categorized miRNA genes with S value below 0.2 as enhancer-associated miRNAs.
Profiles of miRNA expression, Ago2-bound RNAs, and iCLIP in mESCs—We used our previous data of profiling of miRNA expression and Ago2-bound RNAs (Zamudio et al., 2014) and Ago2 iCLIP (Bosson et al., 2014) in TT-FHAgo2 cells. Expression levels of miRNAs in V6.5 mESCs (Figure 3A) were analyzed using the dataset in a previous report (Marson et al., 2008).
Calculating miRNA tissue-specificity scores—Tissue specificity scores for miRNAs based on miRNA expression status were calculated using miRNA expression atlas (Landgraf
A
uthor Man
uscr
ipt
A
uthor Man
uscr
ipt
A
uthor Man
uscr
ipt
A
uthor Man
uscr
ipt
et al., 2007) and the similar approach to evaluate information content as described in a previous report (Landgraf et al., 2007). Briefly, miRNA expression data was transformed into a matrix of normalized frequencies of miRNA expression across samples via first normalization in each tissue type and second normalization for each miRNA species. For each miRNA, specificity score (SPmiRNA) was calculated as follows: SPmiRNA = log2(number of tissue types) + ΣGt*log2(Gt), where Gt is normalized frequency of miRNA in the corresponding tissue type. miRNAs with high tissue specificity show high specificity scores.
Ago2-dependent target repression in TT-FHAgo2 cells—We analyzed the data of RNAseq in TT-FHAgo2 cells with/without doxycycline treatment (Bosson et al., 2014). Paired-end reads were mapped to mm9 assembly with the TopHat program (version 2.0.12.) using the mm9 GTF file. FPKM data was generated with Cufflinks (version 2.2.0.) (Trapnell et al., 2012) and analyzed after a maximum filter of FPKM > 1. Ago2-dependent target repression was assessed by the median change in expression of 8mer miRNA targets relative to non-miRNA target genes and Kolmogorov–Smirnov test between samples with/without doxycycline treatment.
Expression of SE-miRNAs and TE-miRNAs in diverse mouse tissues—In Figure S1F, we analyzed the miRNA expression data from (Kuchen et al., 2010) and (Landgraf et al., 2007).
Computational methods for super-enhancer-associated miRNAs in human samples Super-enhancers and SE-miRNAs in human samples—Genomic coordinates of SEs and TEs in 86 human samples were downloaded from (Hnisz et al., 2013). All analyses were carried out using RefSeq (GRCh37/hg19) human gene annotations. ChIP-seq profiles were presented using a reads per million per base pair (rpm/bp) scale. Enhancer-associated miRNAs were identified in the same approach as identification of mouse enhancer-associated miRNAs. Since H3K27Ac SEs tend to cover broader genomic regions, we calculated the distances from the center of the enhancer to the center of promoter of each miRNA gene (Marson et al., 2008) and the position of each miRNA hairpin and used for further assignment.
Correlation between SE-miRNAs and target avoidance—For each miRNA, SE-miRNA scores were calculated in the corresponding tissue type as follows: SE-SE-miRNA = (number of tissue types in which SE associates with the respective miRNA)/(total number of tissue types, i.e. 26). In the tissue types without association between SEs and miRNAs, SE-miRNA scores were set to 0. We performed cross-correlation analysis between the resultant SE-miRNA association matrix composed of SE-miRNA scores and target density map, which includes negative log10 p value for depletion of miRNA targets assessed by Kolmogorov–Smirnov test (Farh et al., 2005), and summarized Pearson correlation coefficients in Figure 2E.
SE-miRNAs in cancer—Distribution of SE-miRNAs was compared between each cancer cell line and the corresponding normal tissue. Gain and loss of SEs in one or more than one
A
uthor Man
uscr
ipt
A
uthor Man
uscr
ipt
A
uthor Man
uscr
ipt
A
uthor Man
uscr
ipt
cancer cell line were presented in Figure 7A. Functional assignment for tumor-suppressive miRNAs or oncogenic miRNAs was performed based on the description in OncomiRDB, which comprehensively curated the publications of cancer-related miRNAs (Wang et al., 2014a). Proportion of numbers of the reports describing tumor suppressive roles or
oncogenic roles of miRNAs in each group defined in Figure 7A was displayed in Figure 7B. Gene ontology and cancer hallmark analysis—A list of the experimentally validated human miRNA target interaction was downloaded from miRTarBase (Chou et al., 2015). For the target genes of miRNAs with human SEs (Figure 2D) and with SE gain or loss (Figures 7C and 7D), gene ontology (GO) analyses were performed using Database for Annotation, Visualization, and Integrated Discovery (DAVID; http://david.abcc.ncifcrf.gov). A threshold p value score of 10−3 was used. The following gene ontology categories were used as proxies for the characteristic cancer hallmark traits.
1. Evading Growth Suppressors: GO:0007049, Cell cycle; GO:0008283, Cell proliferation
2. Avoiding Immune Destruction: GO:0002682, Regulation of immune system process
3. Enabling Replicative Immortality: GO:0007568, Aging
4. Tumor-Promoting Inflammation: GO:0006954, Inflammatory response 5. Activating Invasion: GO:0034330, Cell junction organization
6. Inducing Angiogenesis: GO:0001525, Angiogenesis 7. Genome Instability: GO:0006281, DNA repair
8. Resisting Cell Death: GO:0012501, Programmed cell death; GO:0010941, Regulation of cell death
9. Deregulating Cellular Energetics: GO:0006091, Generation of precursor metabolites and energy
10. Sustaining proliferative signaling: GO:0007173, Epidermal growth factor receptor signaling pathway; GO:0048008, Platelet-derived growth factor receptor signaling pathway
For miRNAs which have been recently reported as cancer-related miRNAs and were not captured by GO analysis, association between these miRNAs and cancer hallmark traits is shown in Figure S7C according to the miRNA function described in OncomiRDB and literature search (Suzuki et al., 2015; Wang et al., 2014a).
TCGA data analysis—TCGA data analysis was performed for pancreatic
adenocarcinoma (PAAD), colon adenocarcinoma (COAD), and breast cancer (BRCA). For these tumor types, miRNA expression data and clinical data were downloaded from The Cancer Genome Atlas (TCGA) Data Portal (https://tcga-data.nci.nih.gov/tcga/) in October of 2015. For all miRNAs, regression coefficients and p values were estimated using a univariate Cox regression model. In breast cancer, we used the data of SE-miRNAs in luminal and
A
uthor Man
uscr
ipt
A
uthor Man
uscr
ipt
A
uthor Man
uscr
ipt
A
uthor Man
uscr
ipt
basal-like types. Comparison of p values and coefficients was performed with Wilcoxon signed rank sum test (Figures 7E and 7F). Stratifier models (Figure 7G) were generated using miRNAs showing p < 0.05 (PAAD and BRCA) or p < 0.1 (COAD). Risk scores were calculated by a combination of the expression levels of selected miRNAs weighted by their respective Cox regression coefficients according to a previous report (Lossos et al., 2004) by the following formula: “risk score” = Σ (regression coefficient) x (expression value of each prognostic miRNA). Survival analysis was performed using the survival package of R. P values were calculated using two-tailed log-rank test.
ChIP-seq profiling and coregulation analysis
Identifying ChIP-seq enriched regions—Mouse and human sequencing reads were aligned to the mouse genome build mm9 and the human genome build hg19, respectively, using bowtie 1.0.1 (Langmead et al., 2009). The following parameters were used: -n 2, -e 70, -m 1, -k 1, and -l, set to the read length of the data being aligned. ChIP-seq peaks were called using MACS version 1.4.2. (Zhang et al., 2008) with parameters -p 1e-9, –keep-dup = auto, -w –S –space = 50, and -g mm (or hs).
ChIP-seq read density analysis—ChIP-seq read density was calculated as described in (Hnisz et al., 2013; Whyte et al., 2013). Briefly, ChIP-seq reads aligning to the region were extended by 200bp and the density of reads per base pair (bp) was calculated. This density was normalized to the millions of mapped reads contributing to the density, measured in reads per million per base pair (rpm/bp).
ChIP-seq profiling for miRNA promoters and enhancers—ChIP-seq density was calculated for promoters of each miRNA gene (Marson et al., 2008) and putative enhancer regions (promoter +/− 20kb) (Figures S4A–C). Representative connections between transcriptional regulators and miRNAs were visualized using Cytoscape (Figure S4D). Identifying H3K27Ac super-enhancers in mESCs—Enhancers were stitched and SEs were identified using ROSE (https://bitbucket.org/young_computation/rose), as described in (Loven et al., 2013; Whyte et al., 2013). ROSE was run with a stitching distance of 12,500 bp and a TSS exclusion zone size of 2,500 bp, excluding 5,000bp around TSS.
Coregulation analysis—For coregulation analysis, summits of MACS peaks for ChIP-seq of 64 factors were first assembled, extended by 300bp, and then merged. ChIP-ChIP-seq densities for the enhancer constituents included in OSN-Med1 SEs and H3K27Ac SEs were analyzed by coregulation analysis (CRA). After background subtraction and factor-based normalization, CRA was performed using Pearson correlation coefficients (cutoff 0.75) for ChIP-seq density data and BioLayout Express3D (Theocharidis et al., 2009). The merged ChIP-seq profiles of Oct4, Sox2, and Nanog (OSN) were also analyzed.
Identifying broad H3K4me3 domains—According to a previous report (Benayoun et al., 2014), broad H3K4me3 peaks were called in mESCs using the MACS2 version 2.0.10 (Feng et al., 2012) with default settings, adding the “–broad option”. Peaks were assigned to the closest gene. Peaks longer than 4kb were called as broad H3K4me3 domains.
A
uthor Man
uscr
ipt
A
uthor Man
uscr
ipt
A
uthor Man
uscr
ipt
A
uthor Man
uscr
ipt
QUANTIFICATION AND STATISTICAL ANALYSIS
In Figures 5 and 6, statistical significance was evaluated with Wilcoxon signed rank sum test. In TCGA data analysis (Figure 7), comparison of p values and coefficients in Cox regression model was performed with Wilcoxon signed rank sum test. Survival analysis was performed using the survival package of R. P values were calculated using two-tailed log-rank test.
DATA AND SOFTWARE AVAILABILITY
Data Resources—The accession number for the data for ChIP sequencing, ChrRNA sequencing, and pre-miRNA sequencing reported in this paper is NCBI GEO: GSE89826.
Supplementary Material
Refer to Web version on PubMed Central for supplementary material.
Acknowledgments
We thank S. Dubbury, A. Chiu, C.K. JnBaptiste, B.J. Abraham, and members of Sharp laboratories for discussions and assistance and S. Levine and the staff of the BioMicro Center at MIT for sequencing support. H.I.S. is supported by JSPS Postdoctoral Fellowship for Research Abroad and Uehara Memorial Foundation. The results here are in part based upon data generated by the TCGA Research Network: https://cancergenome.nih.gov/. R.A.Y. is a founder and P.A.S. is a board member of Syros Pharmaceuticals, which is developing SE directed agents, none of which were used in the study. This research has been supported by United States Public Health Service grant R01-CA133404 (to P.A.S.) from the NIH and partially by Koch Institute Support (core) grant P30-CA14051 from the NCI.
References
Alarcon CR, Goodarzi H, Lee H, Liu XH, Tavazoie S, Tavazoie SF. HNRNPA2B1 Is a Mediator of m(6)A-Dependent Nuclear RNA Processing Events. Cell. 2015; 162:1299–1308. [PubMed: 26321680]
Ang YS, Tsai SY, Lee DF, Monk J, Su J, Ratnakumar K, Ding J, Ge Y, Darr H, Chang B, et al. Wdr5 mediates self-renewal and reprogramming via the embryonic stem cell core transcriptional network. Cell. 2011; 145:183–197. [PubMed: 21477851]
Benayoun BA, Pollina EA, Ucar D, Mahmoudi S, Karra K, Wong ED, Devarajan K, Daugherty AC, Kundaje AB, Mancini E, et al. H3K4me3 breadth is linked to cell identity and transcriptional consistency. Cell. 2014; 158:673–688. [PubMed: 25083876]
Bosson AD, Zamudio JR, Sharp PA. Endogenous miRNA and target concentrations determine susceptibility to potential ceRNA competition. Mol Cell. 2014; 56:347–359. [PubMed: 25449132] Chen JF, Mandel EM, Thomson JM, Wu Q, Callis TE, Hammond SM, Conlon FL, Wang DZ. The role
of microRNA-1 and microRNA-133 in skeletal muscle proliferation and differentiation. Nat Genet. 2006; 38:228–233. [PubMed: 16380711]
Chou CH, Chang NW, Shrestha S, Hsu SD, Lin YL, Lee WH, Yang CD, Hong HC, Wei TY, Tu SJ, et al. miRTarBase 2016: updates to the experimentally validated miRNA-target interactions database. Nucleic Acids Res. 2015
de Dieuleveult M, Yen K, Hmitou I, Depaux A, Boussouar F, Bou Dargham D, Jounier S,
Humbertclaude H, Ribierre F, Baulard C, et al. Genome-wide nucleosome specificity and function of chromatin remodellers in ES cells. Nature. 2016; 530:113–116. [PubMed: 26814966]
Dowen JM, Fan ZP, Hnisz D, Ren G, Abraham BJ, Zhang LN, Weintraub AS, Schuijers J, Lee TI, Zhao K, et al. Control of cell identity genes occurs in insulated neighborhoods in mammalian chromosomes. Cell. 2014; 159:374–387. [PubMed: 25303531]
A
uthor Man
uscr
ipt
A
uthor Man
uscr
ipt
A
uthor Man
uscr
ipt
A
uthor Man
uscr
ipt
Farh KK, Grimson A, Jan C, Lewis BP, Johnston WK, Lim LP, Burge CB, Bartel DP. The widespread impact of mammalian MicroRNAs on mRNA repression and evolution. Science. 2005; 310:1817– 1821. [PubMed: 16308420]
Feng J, Liu T, Qin B, Zhang Y, Liu XS. Identifying ChIP-seq enrichment using MACS. Nat Protoc. 2012; 7:1728–1740. [PubMed: 22936215]
Geula S, Moshitch-Moshkovitz S, Dominissini D, Mansour AA, Kol N, Salmon-Divon M, Hershkovitz V, Peer E, Mor N, Manor YS, et al. Stem cells. m6A mRNA methylation facilitates resolution of naive pluripotency toward differentiation. Science. 2015; 347:1002–1006. [PubMed: 25569111] Gromak N, Dienstbier M, Macias S, Plass M, Eyras E, Caceres JF, Proudfoot NJ. Drosha regulates
gene expression independently of RNA cleavage function. Cell Rep. 2013; 5:1499–1510. [PubMed: 24360955]
Ha M, Kim VN. Regulation of microRNA biogenesis. Nat Rev Mol Cell Biol. 2014; 15:509–524. [PubMed: 25027649]
Hanahan D, Weinberg RA. Hallmarks of cancer: the next generation. Cell. 2011; 144:646–674. [PubMed: 21376230]
Hay D, Hughes JR, Babbs C, Davies JO, Graham BJ, Hanssen LL, Kassouf MT, Oudelaar AM, Sharpe JA, Suciu MC, et al. Genetic dissection of the alpha-globin super-enhancer in vivo. Nat Genet. 2016; 48:895–903. [PubMed: 27376235]
Hnisz D, Abraham BJ, Lee TI, Lau A, Saint-Andre V, Sigova AA, Hoke HA, Young RA. Super-enhancers in the control of cell identity and disease. Cell. 2013; 155:934–947. [PubMed: 24119843]
Hnisz D, Schuijers J, Lin CY, Weintraub AS, Abraham BJ, Lee TI, Bradner JE, Young RA. Convergence of developmental and oncogenic signaling pathways at transcriptional super-enhancers. Mol Cell. 2015; 58:362–370. [PubMed: 25801169]
Karginov FV, Cheloufi S, Chong MM, Stark A, Smith AD, Hannon GJ. Diverse endonucleolytic cleavage sites in the mammalian transcriptome depend upon microRNAs, Drosha, and additional nucleases. Mol Cell. 2010; 38:781–788. [PubMed: 20620951]
Kim TM, Huang W, Park R, Park PJ, Johnson MD. A developmental taxonomy of glioblastoma defined and maintained by MicroRNAs. Cancer Res. 2011; 71:3387–3399. [PubMed: 21385897] Kuchen S, Resch W, Yamane A, Kuo N, Li Z, Chakraborty T, Wei L, Laurence A, Yasuda T, Peng S, et
al. Regulation of microRNA expression and abundance during lymphopoiesis. Immunity. 2010; 32:828–839. [PubMed: 20605486]
Kwiatkowski N, Zhang T, Rahl PB, Abraham BJ, Reddy J, Ficarro SB, Dastur A, Amzallag A, Ramaswamy S, Tesar B, et al. Targeting transcription regulation in cancer with a covalent CDK7 inhibitor. Nature. 2014; 511:616–620. [PubMed: 25043025]
Kwon SC, Nguyen TA, Choi YG, Jo MH, Hohng S, Kim VN, Woo JS. Structure of Human DROSHA. Cell. 2016; 164:81–90. [PubMed: 26748718]
Landgraf P, Rusu M, Sheridan R, Sewer A, Iovino N, Aravin A, Pfeffer S, Rice A, Kamphorst AO, Landthaler M, et al. A mammalian microRNA expression atlas based on small RNA library sequencing. Cell. 2007; 129:1401–1414. [PubMed: 17604727]
Langmead B, Trapnell C, Pop M, Salzberg SL. Ultrafast and memory-efficient alignment of short DNA sequences to the human genome. Genome Biol. 2009; 10:R25. [PubMed: 19261174] Lee TI, Young RA. Transcriptional regulation and its misregulation in disease. Cell. 2013; 152:1237–
1251. [PubMed: 23498934]
Lin C, Garrett AS, De Kumar B, Smith ER, Gogol M, Seidel C, Krumlauf R, Shilatifard A. Dynamic transcriptional events in embryonic stem cells mediated by the super elongation complex (SEC). Genes Dev. 2011; 25:1486–1498. [PubMed: 21764852]
Liu H, Liang C, Kollipara RK, Matsui M, Ke X, Jeong BC, Wang Z, Yoo KS, Yadav GP, Kinch LN, et al. HP1BP3, a Chromatin Retention Factor for Co-transcriptional MicroRNA Processing. Mol Cell. 2016; 63:420–432. [PubMed: 27425409]
Lossos IS, Czerwinski DK, Alizadeh AA, Wechser MA, Tibshirani R, Botstein D, Levy R. Prediction of survival in diffuse large-B-cell lymphoma based on the expression of six genes. N Engl J Med. 2004; 350:1828–1837. [PubMed: 15115829]
A
uthor Man
uscr
ipt
A
uthor Man
uscr
ipt
A
uthor Man
uscr
ipt
A
uthor Man
uscr
ipt
Loven J, Hoke HA, Lin CY, Lau A, Orlando DA, Vakoc CR, Bradner JE, Lee TI, Young RA. Selective inhibition of tumor oncogenes by disruption of super-enhancers. Cell. 2013; 153:320–334. [PubMed: 23582323]
Lund AH. miR-10 in development and cancer. Cell Death Differ. 2010; 17:209–214. [PubMed: 19461655]
Macias S, Cordiner RA, Gautier P, Plass M, Caceres JF. DGCR8 Acts as an Adaptor for the Exosome Complex to Degrade Double-Stranded Structured RNAs. Mol Cell. 2015; 60:873–885. [PubMed: 26687677]
Mansour MR, Abraham BJ, Anders L, Berezovskaya A, Gutierrez A, Durbin AD, Etchin J, Lawton L, Sallan SE, Silverman LB, et al. Oncogene regulation. An oncogenic super-enhancer formed through somatic mutation of a noncoding intergenic element. Science. 2014; 346:1373–1377. [PubMed: 25394790]
Marson A, Levine SS, Cole MF, Frampton GM, Brambrink T, Johnstone S, Guenther MG, Johnston WK, Wernig M, Newman J, et al. Connecting microRNA genes to the core transcriptional regulatory circuitry of embryonic stem cells. Cell. 2008; 134:521–533. [PubMed: 18692474] Morlando M, Ballarino M, Gromak N, Pagano F, Bozzoni I, Proudfoot NJ. Primary microRNA
transcripts are processed co-transcriptionally. Nat Struct Mol Biol. 2008; 15:902–909. [PubMed: 19172742]
Mullokandov G, Baccarini A, Ruzo A, Jayaprakash AD, Tung N, Israelow B, Evans MJ,
Sachidanandam R, Brown BD. High-throughput assessment of microRNA activity and function using microRNA sensor and decoy libraries. Nat Methods. 2012; 9:840–846. [PubMed: 22751203] Nojima T, Gomes T, Grosso AR, Kimura H, Dye MJ, Dhir S, Carmo-Fonseca M, Proudfoot NJ.
Mammalian NET-Seq Reveals Genome-wide Nascent Transcription Coupled to RNA Processing. Cell. 2015; 161:526–540. [PubMed: 25910207]
Park CY, Choi YS, McManus MT. Analysis of microRNA knockouts in mice. Hum Mol Genet. 2010; 19:R169–175. [PubMed: 20805106]
Porstner M, Winkelmann R, Daum P, Schmid J, Pracht K, Corte-Real J, Schreiber S, Haftmann C, Brandl A, Mashreghi MF, et al. miR-148a promotes plasma cell differentiation and targets the germinal center transcription factors Mitf and Bach2. Eur J Immunol. 2015; 45:1206–1215. [PubMed: 25678371]
Pott S, Lieb JD. What are super-enhancers? Nat Genet. 2015; 47:8–12. [PubMed: 25547603] Rahl PB, Lin CY, Seila AC, Flynn RA, McCuine S, Burge CB, Sharp PA, Young RA. c-Myc regulates
transcriptional pause release. Cell. 2010; 141:432–445. [PubMed: 20434984]
Schnetz MP, Handoko L, Akhtar-Zaidi B, Bartels CF, Pereira CF, Fisher AG, Adams DJ, Flicek P, Crawford GE, Laframboise T, et al. CHD7 targets active gene enhancer elements to modulate ES cell-specific gene expression. PLoS Genet. 2010; 6:e1001023. [PubMed: 20657823]
Sharova LV, Sharov AA, Nedorezov T, Piao Y, Shaik N, Ko MS. Database for mRNA half-life of 19977 genes obtained by DNA microarray analysis of pluripotent and differentiating mouse embryonic stem cells. DNA Res. 2009; 16:45–58. [PubMed: 19001483]
Shin HY, Willi M, Yoo KH, Zeng X, Wang C, Metser G, Hennighausen L. Hierarchy within the mammary STAT5-driven Wap super-enhancer. Nat Genet. 2016; 48:904–911. [PubMed: 27376239]
Skene PJ, Henikoff S. A simple method for generating high-resolution maps of genome-wide protein binding. Elife. 2015; 4:e09225. [PubMed: 26079792]
Squadrito ML, Pucci F, Magri L, Moi D, Gilfillan GD, Ranghetti A, Casazza A, Mazzone M, Lyle R, Naldini L, et al. miR-511-3p modulates genetic programs of tumor-associated macrophages. Cell Rep. 2012; 1:141–154. [PubMed: 22832163]
Stark A, Brennecke J, Bushati N, Russell RB, Cohen SM. Animal MicroRNAs confer robustness to gene expression and have a significant impact on 3′UTR evolution. Cell. 2005; 123:1133–1146. [PubMed: 16337999]
Suzuki HI, Katsura A, Matsuyama H, Miyazono K. MicroRNA regulons in tumor microenvironment. Oncogene. 2015; 34:3085–3094. [PubMed: 25132266]
Suzuki HI, Yamagata K, Sugimoto K, Iwamoto T, Kato S, Miyazono K. Modulation of microRNA processing by p53. Nature. 2009; 460:529–533. [PubMed: 19626115]