RESEARCH ARTICLE
XXXXXXXXXXXXXXXXX
Copyright © 2015 American Scientific Publishers Advanced Science Letters All rights reserved Vol. XXXXXXXXX Printed in the United States of America
Assessing Attention and Meditation Levels in
Learning Process using Brain Computer Interface
Rahmah Mokhtar¹, Nurshafiqa Sharif², Nor Azan Mat Zin³, Siti Normaziah Ihsan4
1, 2,4 Faculty of Computer System and Software Engineering, Malaysia University of Pahang, 26300 Gambang, Malaysia 3Faculty of Information Science and Technology
The National University of Malaysia Bangi, Selangor, Malaysia
Attention and meditation influence the students while receiving knowledge in teaching and learning process. This research focuses on recognition of human brainwave electroencephalogram (EEG) signals, to detect the changes of attention and meditation level signal. A non-invasive brain-computer interfaces (BCI) is used to record the brain signals. These signals are acquired directly using an Android software (EEG Analyzer) and transmitted to a computer for further data processing and analysis. The objectives of this paper are to measure and identify brainwave patterns related to respondent’s attention and meditation level while perceive learning. The experiment has been done to eight primary school student aged seven to twelve years old. The result shows that the EEG can be measured and the pattern of EEG can be identified attention and meditation changes in students learning acceptance.
Keywords: BCI, attention, meditation.
1. INTRODUCTION
Emotion assessment is a rapidly growing research field, especially in the human-computer interface (HCI) community where assessing the emotional state of a user can greatly improve interaction quality by bringing it closer to human communication. This research focus on recognition of human brainwave electroencephalogram (EEG) signals of attention and meditation levels of kids while perceive learning using Brain Computer Interface (BCI). Meditation and attention is the basic cognitive ability of a person to perform any task or develop a skill1.
Recognizing these attention and meditation levels are beneficial in computer assisted learning and assessment. Knowing if a student is not paying attention and concentrate while perceive learning session can be beneficial information to teachers to deal with the student properly. Thus, the recognition of emotional response is essential since it has been claimed that motivation, and emotion are the three components of
*Email Address: [email protected]
learning2. A study by Nurshafiqa3 identifies how the
subject’s effort to a given specific task correlate to his or her concentration and meditation level. She found that if the subjects or the learners were focused, it was easy to handle and control the game and learn. The users can easily maintain their emotional state after several trials and they can train themselves to stay focused while learning. Kristin4 used meditation readings returned by
the BCI headset to record the respondent’s state of arousal. EEG recording device known as Brain Computer Interface (BCI) is a device that allows communication with the outside world from the electrical activity without the help of peripheral nerves or motor activity. In recent years, many companies developed Electroencephalography (EEG) interfaces at low cost. These devices have been developed primarily for entertainment and bringing it closer to user. As an example, NeuroSky’s technology has developed a minimally invasive and dry biosensor to read electrical neutron-triggered activity in the brain to determine states of attention and meditation 5. There were also example of
game that utilize BCI that used attention value where a Wiimote was used to target objects on screen, and when the maximum attention value is reached, the target explodes6. It is reported by Wang7 that BCI also was used
Adv. Sci. Lett. X, XXX–XXX, 2015
RESEARCH ARTICLE
handling a flight. The correct brain pattern was recorded with a more responsive game controller.
In this research, these signals were acquired directly using the BCI headset which will detect brainwaves and transmit them to a computer for further data processing and analysis. This study aims to identify brainwave patterns related to respondent’s attention and meditation level while perceive learning. There are many inexpensive, wireless, portable and easy-to-use EEG headsets available in the market nowadays, BCI implementations have become very easy and assessing attention and meditation values of the users are found to be reliable8. By using an EEG recording device with a
single dry electrode at the forehead, the measuring and analysis of brain states turns simpler and more comfortable for the subject 9.
The user could utilize the device without the help of knowledgeable persons. The single position electrode means that changes in brainwave activity in different parts of the brain cannot be observed. However, volume conduction makes it possible to measure electrical potentials at some distance from their source generators. Therefore, the single position electrode is able to track a substantial part of the entire brain’s activity. The sensing electrode is placed on the forehead. There is no hair between the electrode and the scalp, which will make for a stronger, steadier signal. The brain signals is also interrelated with higher states of consciousness derive from the frontal cortex, which is located below the forehead4.
2. METHODOLOGY
A. Device
BCI headset is used as the device to measures the brainwave and outputs the power spectra EEG in the form of attention and meditation signal values. The signals captured are used as inputs to algorithms to determine the attention and meditation level10. The algorithm returns one
number per second on a scale from 0-100, representing the respondent’s level of attention and meditation.
Inside every BCI device, there is a ThinkGear chip which functions to collect and processes the signal in a sequence of usable data and the interference that may occur are digitally filtered4. This chip enables the device
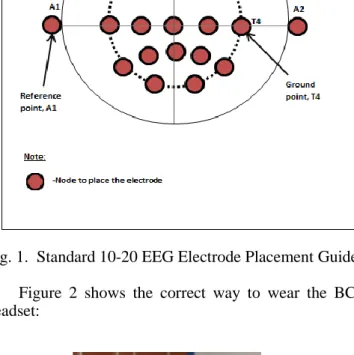
to interface with the wearer’s brainwaves by amplifying the raw brainwave signal and removing the ambient noise and the artifacts. This BCI headset has a dry silver electrode, created to read brain signals, touching the forehead at the position Fp1 in accordance with the American Electroencephalographic Society’s (1994) 10-20 system of electrode placement4. The headset’s
reference and ground electrodes are on the ear clip at A1 and at T4 will help in ensuring the accuracy of the brain signals11 as illustrated by Figure 1.
Fig. 1. Standard 10-20 EEG Electrode Placement Guide Figure 2 shows the correct way to wear the BCI headset:
Fig. 2. Headset Usage B. Respondent
The respondents in this study involved eight primary school children, age ranging from 7 to 12 years old. All the respondents were given sufficient and clear introduction of the test sessions.
C. Experimental setup
The respondent wore a BCI headset with the front electrode resting on her or his forehead and the ear clip properly in contact with the lower part of the earlobe to provide ground reference. The device worn by the respondent should be correctly connected via Bluetooth to the Android device used to capture the attention and meditation data. Each respondent took part in two
RESEARCH ARTICLE
XXXXXXXXXXXXXXXXX
0 20 40 60 80 100 120 0.000 100.000200.000300.000400.000 Attention Meditationsessions of mathematics learning. Session 1 began with respondents completing a 5 minutes session answering mathematic questions, without any prior preparation. They sat in front of the computer and immediately requested to start answering the mathematic questions.
After completing the first session, the respondent was asked to rest for about 2 minutes before they were allowed to explore the second interactive mathematic learning, Fun Math. After that, the next session of answering question from Fun Math began and lasted after 5 minutes. His or her EEG signal was recorded continuously while he or she answered all the questions throughout both sessions.
There were 3 types of signals captured by the headset: Type 4 (Attention level), Type 5 (Meditation level) and Type 22 (Eye blink strength). However, Type 22 dataset will be ignored. An Android-based software, EEG Analyzer will capture the raw attention and meditation level signals over time per second from the headset. The data will be exported into CSV (Comma Separated Value) format and can be viewed later in Microsoft Excel or Notepad for data analysis. Audio-video recordings of the subjects’ facial expressions, profile of each respondent, which includes age, gender and academic standing were also recorded during each session.
3. RESULT AND DISCUSSION
The raw datasets contain thousands of data that need to be sorted and filtered accordingly. The information included in the dataset are:
1) id is id of the record in SQLite database table on the device
2) type represents type of the signal (4 – attention, 5 – meditation, 22 – blink strength)
3) level represents attention level (from 0 to 100), meditation level (from 0 to 100) or blink strength (always positive integer value)
4) milliseconds represents time in milliseconds.
Fig. 3 is a typical example of a plot from a headset data of Respondent 1 in the first session, over time (seconds). The red line represents meditation level while the blue line represents attention. The significant minimum points of the red line (meditation) in 0 to 120 seconds roughly correspond to the onset of a few minutes in Session 1 task i.e. consequently an initial increase in the stress level of the respondent. While the significant maximum points of the red line (attention) occurs after 150 seconds which indicate that the respondent was relaxed compared to the earlier minutes of the test. This seems to apply to individuals who were unable to keep up with the pace of the responses to the stimuli in five minutes.
Fig. 3. Session 1: Respondent 1
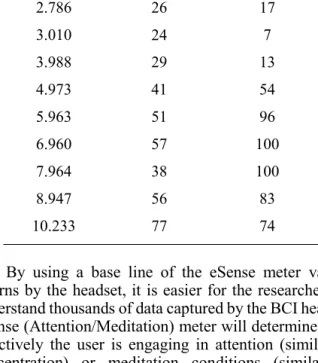
It was observed that when the task became more demanding, the meditation level of the respondent began to decrease and the level of attention will decrease as well, indicating an increase in the stress level. Table 1 illustrates this observation clearly. The sample will be taken only for the first 10 seconds. It can be seen that the level of meditation and attention decreased gradually until 3.010 second. However, the level of meditation and attention started to increase at 3.988 second and this trend continues until a certain condition occur depending on the respondent’s mood and condition.
Table.1. Sample Data
TIME SEQUENCE (SEC) MEDITATION ATTENTION 0.000 54 54 0.990 44 37 2.786 26 17 3.010 24 7 3.988 29 13 4.973 41 54 5.963 51 96 6.960 57 100 7.964 38 100 8.947 56 83 10.233 77 74
By using a base line of the eSense meter values returns by the headset, it is easier for the researchers to understand thousands of data captured by the BCI headset. eSense (Attention/Meditation) meter will determine how effectively the user is engaging in attention (similar to concentration) or meditation conditions (similar to relaxation) by decoding the electrical signals and
Adv. Sci. Lett. X, XXX–XXX, 2015
RESEARCH ARTICLE
applying algorithms to provide readings on a scale of 0-100. The eSense Attention meter indicates the intensity of a user’s level of mental focus or attention to determine the levels of concentration. eSense Meditation meter is related to the active mental processes in the brain and indicates the intensity of a user’s level of mental calmness or relaxation. Table 2 describes the eSense meter values.
Table. 2. Descriptions of the eSense Meter Values VALUE DESCRIPTION
1-20 ‘strongly lowered’ levels 20-40 ‘reduced’
40-60 ‘neutral’ / ’baseline’ levels
60-80 ‘slightly elevated’ /higher than normal levels
80-100 ‘elevated’/ ‘heightened’ levels
Attention and Meditation values ranging from 1 to 100, at a sampling rate of 1 Hz. These values are determined via proprietary algorithms. Values between 40 and 60 are considered ‘neutral’ or baseline, value between 60 and 80 mean slightly elevated eSense levels, and value between 80 to 100 refers to strongly elevated attention/meditation levels. Values below 40 are interpreted as (slightly/strongly) lowered levels. A zero eSense value means the signal cannot be calculated reliably due to background noise12.
Crowley13 reported that if the user is relaxed and not
under stress, then the readings return is high, whereas if they become stress, as a result of performing a task for example, the readings returned low for both attention and meditation levels. They also reported that the attention readings captured respondent’s effort level. If the respondent’s effort level is high, than the output can be almost 100. Whereas if he/she makes no effort at all it will be near to 0.
Table.3. Result of the Sessions
# Mean meditation (second)
Mean attention (second) Session 1 Session 2 Session 1 Session 2 1 48 49 42 45 2 49 43 44 37 3 59 51 34 48 4 61 58 44 46 5 56 55 45 44 6 64 56 40 37 7 50 61 39 39 8 52 60 46 65
Table 3 illustrates the mean attention and meditation levels of the respondents in 5 minutes for each Session 1 and Session 2. The data show that only respondents #1,#7 and #8 have increasing value of meditation levels. However, the reading of the meditation level of the other 5 respondents never went below 40 (as 20-40 is the baseline/neutral meditation level). The data also shows that for the majority of respondents, there is a decrease in stress levels from their first session to second level. Relaxing the body and closing eyes often helps in the mind to relax and increases the meditation level. Distractions, wandering thoughts, anxiety, agitation, and sensory stimuli may lower the meditation levels. The mean readings for attention and meditation of each session is calculated as:
Mean(Meditation)= ∑ (Meditation)/Total number of data
Mean (Attention)=∑ (Attention)/Total number of data Respondents #1,#3,#4,#7 and #8 showed increasing level of attention from Session 1 to Session 2 . It can be concluded that these 5 respondents benefited from their previous Session 1 task. However, another 3 respondents reported decreasing level of attention. It was observed from the video recording that respondent #2, #5 and #6 had wandering thoughts and distraction from friends’ voices while performing the second task. Their abilities to stay focused was decreasing and reported such decreasing attention readings. Distractions, wandering thoughts, lack of focus, or anxiety may lower the Attention level. For the majority of respondents, a decrease in stress from their first attempt to second attempt which resulted in better attention readings. The datasets collected from the BCI headset indicated when a respondent will experience a change in his/her level of
RESEARCH ARTICLE
XXXXXXXXXXXXXXXXX
attention and meditation.
The experiment indicates that BCI can measure the attention and meditation value which can be used the student performance while perceive learning. The repetition of task will influence the changing of the value in attention and meditation. It shows that this devices can monitor the changing of emotions changes in the students while perceive learning.
4. CONCLUSION AND FUTURE WORKS
This study was intended is to measure and identify brainwave patterns related to respondents’ attention and meditation level while learning. This study also examined the relationship between the levels of attention and stress the respondent was experiencing during the experimental sessions. Close examination of the two signals highlighted the correlation between attention, stress and effort. Explanations for the inconsistent stress responses between the respondents were suggested. These findings also proved that the respondent’s stress response can be varied to each other depending on their effort when assessing the stress reactions while learning. It is possible for children to achieve sustained attention and meditation in the ranges obtained from a series of repetitions especially in learning process. As for future works, there will be a new affective user model that will be targeted to be tested in learning and gaming system nowadays. Finally, this research will be designed to do a large scale experimental test with more users which include EEG studies and monitoring to test and verify the affective user model.
ACKNOWLEDGMENT
The authors would like to thank the Ministry of Education (MOE) for funding this research under RACE grant RDU 141304. The researchers would also like to thank UMP, individuals and organizations who have been involved in this research.
REFERENCES
[1] Navalyal, G. U., & Gavas, R. D. (2014). A dynamic attention assessment and enhancement tool using computer graphics. Human-centric Computing and Information Sciences, 4(1), 1-7.
[2] S. D’Mello et al., “Integrating affect sensors in an intelligent tutoring system,” in Int. Conf. On Intelligent User Interfaces, 2005, pp. 7-13.
[3] Nurshafiqa et al. (2015). Capturing Data of Children Concentration and Meditation Levels: How Learners’ Effort Influence the Academic Emotional Response Level, p.48, ICoCSIM Proceeding.
[4] Guðmundsdóttir, K. (2011). Improving players' control over the NeuroSky brain-computer interface.
[5] Crowley, K., Sliney, A., Pitt, I., & Murphy, D. (2010, July). Evaluating a brain-computer interface to categorise human emotional response. In 2010 10th IEEE International Conference on Advanced Learning Technologies (pp. 276-278). Ieee.
[6]PeekB. (2010, 26th June). ThinkGearNET. Available:http://thinkgearnet.codeplex.com
[7] Wang, A. I., & Larsen, E. A. Using Brain-Computer Interfaces In An Interactive Multimedia Application.
[8] Crowley K, Aidan S, Pitt I, Murphy D (2010) Evaluating a brain-computer interface to categorise human emotional response. ICALT doi:10.1109/ICALT.2010.81
[9] Yasui, Yoshitsugu. “A Brainwave Signal Measurement and Data processing Technique for Daily Life Applications.” Journal of Physiological Anthropology 28.3 (2009) : 145-150. Print.
[10] Rebolledo-Mendez, G., Dunwell, I., Martínez-Mirón, E. A., Vargas-Cerdán, M. D., De Freitas, S., Liarokapis, F., & García-Gaona, A. R. (2009). Assessing neurosky’s usability to detect attention levels in an assessment exercise. In Human-Computer Interaction. New Trends (pp. 149-158). Springer Berlin Heidelberg.
[11] S. Sanei and J. Chambers, EEG Signal Processing. John Wiley & Sons, Ltd, 2007.
[12] Shirazi, A. S., Hassib, M., Henze, N., Schmidt, A., & Kunze, K. (2014, March). What's on your mind?: mental task awareness using single electrode brain computer interfaces. In Proceedings of the 5th Augmented Human International Conference (p. 45). ACM.
[13] Crowley, K., Sliney, A., Pitt, I., & Murphy, D. (2011, July). Capturing and using emotion-based BCI signals in experiments: how respondent's effort can influence results. In Proceedings of the 25th BCS Conference on Human-Computer Interaction (pp. 132-138). British Computer Society.